Transcription
A Simple Guide to the Item Response Theory (IRT) and Rasch ModelingChong Ho Yu, Ph.DsEmail: chonghoyu@gmail.comWebsite: http://www.creative-wisdom.comUpdated: October 27, 2017This document, which is a practical introduction to Item Response Theory (IRT) and Rasch modeling, iscomposed of five parts:I.Item calibration and ability estimationII. Item Characteristic Curve in one to three parameter modelsIII. Item Information Function and Test Information FunctionIV. Item-Person MapV. MisfitThis document is written for novices, and thus, the orientation of this guide is conceptual and practical.Technical terms and mathematical formulas are omitted as much as possible. Since some concepts areinterrelated, readers are encouraged to go through the document in a sequential manner.It is important to point out that although IRT and Rasch are similar to each other in terms of computation,their philosophical foundations are vastly different from each other. In research modeling there is anongoing tension between fitness and parsimony (simplicity). If the researcher is intended to create a modelthat reflects or fits "reality," the model might be very complicated because the real world is "messy" inessence. On the other hand, some researchers seek to build an elegant and simple model that have morepractical implications. Simply put, IRT leans towards fitness whereas Rasch inclines to simplicity. To bemore specific, IRT modelers might use up to three parameters, but Rasch stays with one parameter only. Putit differently, IRT is said to be descriptive in nature because it aims to fit the model to the data. In contrast,Rasch is prescriptive for it emphasizes fitting the data into the model. The purpose of this article is not todiscuss these philosophical issues. In the following sections the term "IRT" will be used to generalize theassessment methods that take both person and item attributes into account, as opposed to the classical testtheory. This usage is for the sake of convenience only and by no means the author equates IRT with Rasch.Nevertheless, despite their diverse views on model-data fitness, both IRT and Rasch have advantages overthe classical test theory.Part I: Item Calibration and Ability EstimationUnlike the classical test theory, in which the test scores of the same examinees may vary from test to test,depending upon the test difficulty, in IRT item parameter calibration is sample-free while examineeproficiency estimation is item-independent. In a typical process of item parameter calibration and examinee
A simple guide to IRT and Rasch2proficiency estimation, the data are conceptualized as a two-dimensional matrix, as shown in Table 1:Table 1. 5X5 person by item matrix.Item 1Item 2Item 3Item 4Item 5AveragePerson 1111111Person 2011110.8Person 3001110.6Person 4000110.4Person 5000010.2Average0.80.60.40.20In this example, Person 1, who answered all five items correctly, is tentatively considered as possessing100% proficiency. Person 2 has 80% proficiency, Person 3 has 60%, etc. These scores in terms ofpercentage are considered tentative because first, in IRT there is another set of terminology and scalingscheme for proficiency, and second, we cannot judge a person’s ability just based on the number of correctitems he obtained. Rather, the item attribute should also be taken into account. In this highly simplifiedexample, no examinees have the same raw scores. But what would happen if there is an examinee, sayPerson 6, whose raw score is the same as that of Person 4 (see Table 2)?Table 2. Two persons share the same raw scores.Person 4000110.4Person 5000010.2Person 6110000.4We cannot draw a firm conclusion that they have the same level of proficiency because Person 4 answeredtwo easy items correctly, whereas Person 6 scored two hard questions instead. Nonetheless, for thesimplicity of illustration, we will stay with the five-person example. This nice and clean five-personexample shows an ideal case, in which proficient examinees score all items, less competent ones score theeasier items and fail the hard ones, and poor students fail all. This ideal case is known as the Guttmanpattern and rarely happens in reality. If this happens, the result would be considered an overfit. Innon-technical words, the result is just “too good to be true.”
A simple guide to IRT and Rasch3Table 1 5X5 person by item matrix (with highlighted average)Item 1Item 2Item 3Item 4Item 5Person 11111Average11Person 2011110.8Person 3001110.6Person 4000110.4Person 5000010.2Average0.80.60.40.20We can also make a tentative assessment of the item attribute based on this ideal-case matrix. Let’s look atTable 1 again. Item 1 seems to be the most difficult because only one person out of five could answer itcorrectly. It is tentatively asserted that the difficulty level in terms of the failure rate for Item 1 is 0.8,meaning 80% of students were unable to answer the item correctly. In other words, the item is so difficultthat it can "beat" 80% of students. The difficulty level for Item 2 is 60%, Item 3 is 40% etc. Please notethat for person proficiency we count the number of successful answers, but for item difficulty we count thenumber of failures. This matrix is nice and clean; however, as you might expect, the issue will be verycomplicated when some items have the same pass rate but are passed by examinees of different levels ofproficiency.Table 3. Two items share the same pass rate.Item 1Item 2Item 3Item 4Item 5Item 6AveragePerson 11111100.83Person 20111100.67Person 30011100.50Person 40001100.33Person 50000110.33Average0.80.60.40.200.8In the preceding example (Table 3), Item 1 and Item 6 have the same difficulty level. However, Item 1 wasanswered correctly by a person who has high proficiency (83%) whereas Item 6 was not (the person whoanswered it has 33% proficiency). It is possible that the text in Item 6 tends to confuse good students.Therefore, the item attribute of Item 6 is not clear-cut. For convenience of illustration, we call the portion ofcorrect answers for each person “tentative student proficiency” (TSP) and the pass rate for each item“tentative item difficulty” (TID). Please do not confuse these “tentative” numbers with the item difficulty
A simple guide to IRT and Rasch4parameter and the person theta in IRT. We will discuss them later.In short, both the item attribute and the examinee proficiency should be taken into consideration in order toconduct item calibration and proficiency estimation. This is an iterative process in the sense that tentativeproficiency and difficulty derived from the data are used to fit the model, and then the model is employed topredict the data. Needless to say, there will be some discrepancy between the model and the data in theinitial steps. It takes many cycles to reach convergence.Given the preceding tentative information, we can predict the probability of answering a particular itemcorrectly given the proficiency level of an examinee by the following equation:Probability 1/(1 exp(-(proficiency – difficulty)))Exp is the Exponential Function. In Excel the function is written as exp(). For example:e0 1e1 2.7182 exp(1)e2 7.3890 exp(2)e3 20.0855 exp(3)Now let’s go back to the example depicted in Table 1. By applying the above equation, we can give aprobabilistic estimation about how likely a particular person is to answer a specific item correctly:Table 4a. Person 1 is “better” than Item 1Item 1Item 2Item 3Item 4Item 5TSPPerson 10.550.600.650.690.731Person 20.500.550.600.650.690.8Person 30.450.500.550.600.650.6Person 40.400.450.500.550.600.4Person 50.350.400.450.500.550.2TID0.800.600.400.200.00For example, the probability that Person 1 can answer Item 5 correctly is 0.73. There is no surprise. Person1 has a tentative proficiency of 1 while the tentative difficulty of Item 5 is 0. In other words, Person 1 isdefinitely “smarter” or “better” than Item 5.
A simple guide to IRT and Rasch5Table 4b. The person “matches” the item.Item 1Item 2Item 3Item 4Item 5TSPPerson 10.550.600.650.690.731Person 20.500.550.600.650.690.8Person 30.450.500.550.600.650.6Person 40.400.450.500.550.600.4Person 50.350.400.450.500.550.2TID0.800.600.400.200.00The probability that Person 2 can answer Item 1 correctly is 0.5. The tentative item difficulty is .8, and thetentative proficiency is also .8. In other words, the person’s ability “matches” the item difficulty. When thestudent has a 50% chance to answer the item correctly, the student has no advantage over the item, and viceversa. When you move your eyes across the diagonal from upper left to lower right, you will see a “match”(.5) between a person and an item several times. However, when we put Table 1 and Table 4b together, wewill find something strange.Table 4b (upper) and Table 1 (lower)Person 1Item 10.55Item 20.60Item 30.65Item 40.69Item 50.73TSPPerson 20.500.550.600.650.690.8Person 30.450.500.550.600.650.6Person 40.400.450.500.550.600.4Person son 1Item 11Item 21Item 31Item 41Person 2011110.8Person 3001110.6Person 4000110.4Person 5000010.2Average0.800.600.400.200.001Item 5 Average11According to Table 4b, the probability of Person 5 answering Item 1 to 4 correctly ranges from .35 to .50.But actually, he failed all four items! As mentioned before, the data and the model do not necessarily fit
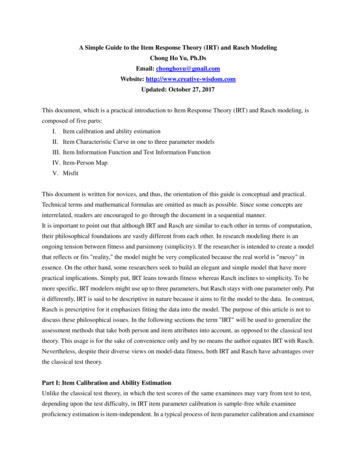
A simple guide to IRT and Raschtogether. This residual information can help a computer program, such as Bilog, to further calibrate theestimation until the data and the model converge. Figure 1 is an example of Bilog’s calibration output,which shows that it takes ten cycles to reach convergence.Figure 1. Bilog’s Phase 2 partial outputCALIBRATION PARAMETERSMAXIMUM NUMBER OF EM CYCLES:MAXIMUM NUMBER OF NEWTON CYCLES:CONVERGENCE CRITERION:ACCELERATION CONSTANT:1020.01001.00006
A simple guide to IRT and Rasch7Part II: Item Characteristic Curve (ICC)After the item parameters are estimated, this information can be utilized to model the response pattern of aparticular item by using the following equation:P 1/(1 exp(-(theta – difficulty)))From this point on, we give proficiency a special name: Theta, which is usually denoted by the Greeksymbol . After the probabilities of giving the correct answer across different levels of are obtained, therelationship between the probabilities and can be presented as an Item Characteristic Curve (ICC), asshown in Figure 2.Figure 2. Item Characteristic CurveIn Figure 2, the x-axis is the theoretical theta (proficiency) level, ranging from -5 to 5. Please keep in mindthat this graph represents theoretical modeling rather than empirical data. To be specific, there may not beexaminees who can reach a proficiency level of 5 or fail so miserably as to be in the -5 group. Nonetheless,to study the “performance” of an item, we are interested in knowing, given a person whose is 5, what theprobability of giving the right answer is. Figure 2 shows a near-ideal case. The ICC indicates that when iszero, which is average, the probability of answering the item correctly is almost .5. When is -5, theprobability is almost zero. When is 5, the probability increases to .99.IRT modeling can be as simple as using one parameter or as complicated as using three parameters, namely,
A simple guide to IRT and Rasch8A, B, and G parameters. Needless to say, the preceding example is a near-ideal case using only the B (itemdifficulty) parameter, keeping the A parameter constant and ignoring the G parameter. These threeparameters are briefly explained as follows:1. B parameter: It is also known as the difficulty parameter or the threshold parameter. This value tells ushow easy or how difficult an item is. It is used in the one-parameter (1P) IRT model. Figure 3 shows atypical example of a 1P model, in which the ICCs of many items are shown in one plot. One obviouscharacteristic of this plot is that no two ICCs cross over each other.Figure 3. 1P ICCs.2. A parameter: It is also called the discrimination parameter. This value tells us how effectively this itemcan discriminate between highly proficient students and less-proficient students. The two-parameter (2P)IRT model uses both A and B parameters. Figure 4 shows a typical example of a 2P model. As you cannotice, this plot is not as nice and clean as the 1P ICC plot, which is manifested by the characteristic thatsome ICCs cross over each other.
A simple guide to IRT and Rasch9Figure 4a. 2P ICCTake Figure 4b (next page) as an example. The red ICC does not have a high discrimination. The probabilitythat examinees whose is 5 can score the item is 0.82, whereas the probability that examinees whose is-5 can score it is 0.48. The difference is just 0.82 - 0.48 0.26. On the other hand, the green ICCdemonstrates a much better discrimination. In this case, the probability of obtaining the right answer giventhe of 5 is 1 whereas the probability of getting the correct answer given the of -5 is 0, and thus thedifference is 1-0 1. Obviously, the discrimination parameter affects the appearance of the slope of ICCs,and that’s why ICCs in the 2P model would cross over each other.
A simple guide to IRT and Rasch10Figure 4b. ICCs of high and low discriminations.However, there is a major drawback in introducing the A parameter into the 2P IRT modeling. In thissituation, there is no universal answer to the question “Which item is more difficult?” Take Figure 4b as anexample again. For examinees whose is 2, the probability of scoring the red item is 0.7 while theprobability of scoring the green item is 0.9. Needless to say, for them the red item is more difficult. Forexaminees whose is -2, the probability of answering the red item correctly is .6 whereas the probability ofgiving the correct answer to the green item is .1. For them the green item is more difficult. Thisphenomenon is called the Lord’s paradox.
A simple guide to IRT and Rasch11Figure 5. 3P ICCs3. C parameter: It is also known as the G parameter or the guessing parameter. This value tells us howlikely the examinees are to obtain the correct answer by guessing. A three-parameter (3P) IRT model uses A,B, and G parameters. Figures 5 and 4, which portray a 2P and 3P ICC plots using the same dataset, look verymuch alike. However, there is a subtle difference. In Figure 5 most items have a higher origin (the statisticalterm is “intercept”) on the y-axis. When the guessing parameter is taken into account, it shows that in manyitems, even if the examinee does not know anything about the subject matter ( -5), he or she can still havesome chances (p 0) to get the right answer.As mentioned in the beginning, IRT modelers assert that on some occasions it is necessary to takediscrimination and guessing parameters into account (2P or 3P models). However, in the perspective ofRasch modeling, crossing ICCs should not be considered a proper model because construct validityrequires that the item difficulty hierarchy is invariant across person abilities (Fisher, 2010). If ICCS arecrossing, the test developers should fix the items.The rule of thumb is: the more parameters we want to estimate, the more subjects we need in computing. Ifthere are sample size constraints, it is advisable to use a 1P IRT model or a Rasch model to conduct testconstruction and use a 3P as a diagnostic tool only. Test construction based upon the Item InformationFunction and the Test Information Function will be discussed next.
A simple guide to IRT and Rasch12Part III: Item Information Function and Test Information FunctionFigure 2. ICCLet’s revisit the ICC. When the is 0 (average), the probability of obtaining the right answer is 0.5. Whenthe is 5, the probability is 1; when the is -5, the probability is 0. However, in the last two cases we havethe problem of missing information. What does it mean? Imagine that ten competent examinees alwaysanswer this item correctly. In this case, we could not tell which candidate is more competent than the otherswith respect to this domain knowledge. On the contrary, if ten incompetent examinees always fail this item,we also could not tell which students are worse with regard to the subject matter. In other words, we havevirtually no information about the in relations to the item parameter at two extreme poles, and less andless information when the moves away from the center toward the two ends. Not surprisingly, if a studentanswers all items in a test correctly, his could not be estimated. Conversely, if an item is scored by allcandidates, its difficulty parameter could not be estimated either. The same problem occurs when allstudents fail or pass the same item. In this case, no item parameter can be computed.There is a mathematical way to compute how much information each ICC can tell us. This method is calledthe Item Information Function (IIF). The meaning of information can be traced back to R. A. Fisher’snotion that information is defined as the reciprocal of the precision with which a parameter is estimated. Ifone could estimate a parameter with precision, one could know more about the value of the parameter thanif one had estimated it with less precision. The precision is a function of the variability of the estimatesaround the parameter value. In other words, it is the reciprocal of the variance. The formula is as follows:
A simple guide to IRT and Rasch13Information 1/(variance)In a dichotomous situation, the variance is p(1-p) whereas p parameter value. Based on the item parametervalues, one could compute and plot the IIFs for the items as shown in Figure 6.Figure 6. Item Information Functions0.30.250.2IIFItem 10.15Item 2Item 30.10.050T-5 T-4 T-3 T-2 T-1T0T1T2T3T4T5ThetaFor clarity, only the IIFs of three items of a particular test are shown in Figure 6. Obviously, these IIFs differfrom each other. In Item 1 (the blue line), the “peak” information can be found when the level is -1. Whenthe is -5, there is still some amount of information (0.08). But there is virtually no information when the is 5. In item 2 (the pink line), most information is centered at zero while the amount of information in thelowest is the same as that in the highest . Item 3 (the yellow line) is the opposite of Item 1. One couldhave much information near the higher , but information drops substantively as the approaches the lowerend.The Test Information Function (TIF) is simply the sum of all IIFs in the test. While IIF can tell us theinformation and precision of a particular item parameter, the TIF can tell us the same thing at the exam level.When there is more than one alternate form for the same exam, TIF can be used to balance alternate forms.The goal is to make all alternate forms carry the same values of TIF across all levels of theta, as shown inFigure 7.
A simple guide to IRT and RaschFigure 7. Form balancing using the Test Information Functions.Test Information Functions1210A8B6CD420-5-4-3-2-101234514
A simple guide to IRT and Rasch15Part IV Logit and Item-Person MapOne of the beautiful features of the IRT is that item and examinee attributes can be presented on the samescale, which is known as the logit. Before explaining the logit, it is essential to explain the odd ratio. Theodd ratio for the item dimension is the ratio of the number of the non-desired events (Q) to the number of thedesired events (P). The formula can be expressed as: Q/P. For example, if the pass rate of an item is four ofout five candidates, the desired outcome is passing the item (4 counts) and the non-desired outcome isfailing the question (1 count). In this case, the odd ratio is 1:4 .25.The odd ratio can also be conceptualized as the probability of the non-desired outcomes to the probability ofthe desired outcome. In the above example, the probability of answering the items correctly is 4/5, which is0.8. The probability of failing is 1-0.8 0.2. Thus, the odd ratio is 0.2/0.8 0.25. In other words, the oddratio can be expressed as (1-P)/P.The relationships between probabilities (p) and odds are expressed in the following equations:Odds P/(1-P) 0.20/(1-0.20) 0.25P Odds/(1 Odds) 0.25/(1 0.25) 0.20The logit is the natural logarithmic scale of the odd ratio, which is expressed as:Logit Log(Odds)As mentioned before, in IRT modeling we can put the item and examinee attributes on the same scale. Buthow can we compare apples and oranges? The trick is to convert the values from two measures into acommon scale: logit. One of the problems of scaling is that spacing in one portion of the scale is notnecessarily comparable to spacing in another portion of the same scale. To be specific, the differencebetween two items in terms of difficulty near the midpoint of the test (e.g. 50% and 55%) does not equal thegap between two items at the top (e.g. 95% and 100%) or at the bottom (5% and 10%). Take weightreduction as a metaphor: It is easier for me to reduce my weight from 150 lbs to 125 lbs, but it is much moredifficult to trim my weight from 125 lbs to 100 lbs. However, people routinely misperceive that distances inraw scores are comparable. By the same token, spacing in one scale is not comparable to spacing in anotherscale. Rescaling by logit solves both problems. However, it is important to point out that while the conceptof logit is applied to both person and item attributes, the computational method for person and item metricsare slightly different. For persons, the odd ratio is P/(1-P) whereas for items that is (1-P)/P. In the logit
A simple guide to IRT and Rasch16scale, the original spacing is compressed, and as a result, equal intervals can be found on the logit scale, asshown in Table 5:Table 5. Spacing in the original and the Log scaleOriginal125102050UnequalspacingLogEqual Spacingn/a0n/a2-11 0.301030.30103-00.301035-23 0.69897 0.69897-0.30103 0.3979410-5511-0.698970.3010320-1010 1.301031.30103-10.3010350-2030 1.69897 1.69897-1.30103 0.39794In an IRT software application named Winsteps, the item difficulty parameter and the examinee theta areexpressed in the logit scale and their relationships are presented in the Item-Person Map (IPM), in whichboth types of information can be evaluated simultaneously. Figure 8 is a typical example of IPM.In Figure 8, observations on the left hand side are examinee proficiency values whereas those on the righthand side are item parameter values. This IPM can tell us the “big picture” of both items and students. Theexaminees on the upper left are said to be “better” or “smarter” than the items on the lower right, whichmean that those easier items are not difficult enough to challenge those highly proficient students. On theother hand, the items on the upper right outsmart examinees on the lower left, which implies that thesetough items are beyond their ability level. In this example, the examinees overall are “better” than the examitems. If we draw a red line at zero, we can see that examinees who are below average would miss a smallchunk of items (the grey area) but pass a much larger chunk (the pink area).
A simple guide to IRT and RaschFigure 8. Item-Person Map17
A simple guide to IRT and Rasch18Part V: MisfitIn Figure 8 (previous page), it is obvious that some subjects are situated at the far ends of the distribution. Inmany statistical analyses we label them as “outliers.” In psychometrics there is a specific term for this typeof outliers: Misfit. It is important to point out that the fitness between data and model during the calibrationprocess is different from the misfit indices for item diagnosis. Many studies show that there is norelationship between item difficulty and item fitness (Dodeen, 2004; Reise, 1990). As the name implies, amisfit is an observation that cannot fit into the overall structure of the exam. Misfits can be caused by manyreasons. For example, if a test developer attempts to create an exam pertaining to American history, butaccidentally an item about European history is included in the exam, then it is expected that the responsepattern for the item on European history will substantially differ from that of other items. In the context ofclassical test theory, this type of items is typically detected by either point-biserial correlation or factoranalysis. In IRT it is identified by examining the misfit indices. Table 6 is a typical output of Winsteps thatindicates misfit:Table 6. Misfit indices in 99Model fitIt seems confusing because there are four misfit indices. Let’s unpack them one by one. “IN.ZSTD” and“OUT.ZSTD” stand for “infit standardized residuals” and “outfit standardized residuals.” For now let’s put
A simple guide to IRT and Rasch19aside “infit” and “outfit.” Instead, we will only concentrate on “standardized residuals”. Regressionanalysis provides a good metaphor. In regression a good model is expected to have random residuals. Aresidual is the discrepancy between the predicted position and the actual data point position. If the residualsform a normal distribution with the mean as zero, with approximately the same number of residuals aboveand below zero, we can tell that there is no systematic discrepancy. However if the distribution of residualsis skewed, it is likely that there is a systematic bias, and the regression model is invalid. While itemparameter estimation, like regression, will not yield an exact match between the model and the data, thedistribution of standardized residuals informs us about the goodness or badness of the model fit. The easiestway to examine the model fit is to plot the distributions, as shown Figure 9.Figure 9. Distributions of infit standardized residuals (left) and outfit standardized residuals (right)In this example, the fitness of the model is in question because both infit and outfit distributions are skewed.The shaded observations are identified as “misfits.” Conventionally, while Chi-square is affected by samplesize, standardized residuals are considered more immune to the issue of sample size. The rule of thumb forusing standardized residuals is that a value 2 is considered bad. However, Lai et al. (2003) asserted thatstandardized residuals are still sample size dependent. When the sample size is large, even small and trivialdifferences between the expected and the observed may be statistically significant. And thus they suggestedputting aside standardized residuals altogether.Item fitModel fit takes the overall structure into consideration. If you remove some “misfit” items and re-run theIRT analysis the distribution will look more normal, but there will still be items with high residuals.Because of this, the “model fit” approach is not a good way to examine item fit. If so, then what is the propertool for checking item fit? The item fit approach, of course. “IN.MSQ” and “OUT.MSQ” stand for “infitmean squared” and “outfit mean squared.” In order to understand this approach, we will unpack theseconcepts. “Mean squared” is simply the Chi-squared divided by the degrees of freedom (df). Next, we will
A simple guide to IRT and Rasch20look at what “Chi-squared” means using a simple example.Table 7. 2X3 table of answer and skill levelAnswer correctly (1)Answer incorrectly (0)Column totalMore skilled(theta 0.5)10515Average(thetabetween -0.5and 0.5)5Less skilled(theta -0.5)151015520Row total3020Grand total: 50Table 7 is a crosstab 2X3 table showing the number of correct and incorrect answers to an item categorizedby the skill level of test takers. At first glance this item seems to be problematic because while only 10skilled test-takers were able to answer this item correctly, 15 less skilled test-takers answered the questioncorrectly. Does this mean the item is a misfit? To answer this question, we will break down howchi-squared is calculated.Like many other statistical tests, we address this issue by starting from a null hypothesis: There is norelationship between the skill level and test performance. If the null hypothesis is true, then what percentageof less skilled students would you expect to answer the item correctly? Regardless of the skill level, 30 outof 50 students could answer the item correctly, and thus the percentage should be 30/50 60%.Table 8. 3X3 table showing one expected frequency and one actual frequencyMore skilled(theta 0.5)Average(thetabetween -0.5& 0.5)Answer correctly (1)105Less skilled(theta -0.5)15 (12)Answer incorrectly (0)Column total5151015520Row total3020Grand total: 50Because 20 students are classified as low skilled and if 60% of them can answer the item correctly, then theexpected count (E) for students who gave the right answer belong to the low skilled group is 12 (20 X 60% )In Table 9, the number inside the bracket is the expected count assuming the null hypothesis is correct.
A simple guide to IRT and Rasch21Table 9. 3X3 table showing two expected counts and two actual countsMore skilled(theta 0.5)Average(thetabetween -0.5& 0.5)Less skilled(theta -0.5)Row totalAnswer correctly (1)10515 (12)30Answer incorrectly (0)Column total51510155 (8)2020Grand total: 50You may populate the entire table using the preceding approach, but you can also use a second approach,which is a short cut found by using the following formula:Expected count [(Column total) X (Row total)]/Grand totalFor example, the expected count cell of (less skilled, answer correctly) is: 20 X 20/50 8.Table 10. 3X3 table showing all expected counts and all actual countsMore skilled(theta 0.5)Answer correctly (1)Answer incorrectly (0)Column totalAverage(thetab
A simple guide to IRT and Rasch 4 parameter and the person theta in IRT. We will discuss them later. In short, both the item attribute and the examinee proficiency should be taken into consideration in order to