Transcription
Condition Monitoring of Axial Piston PumpA Thesis Submitted to theCollege of Graduate Studies and ResearchIn Partial Fulfillment of the Requirements forthe Degree of Master of Sciencein the Department of Mechanical EngineeringUniversity of SaskatchewanSaskatoonZeliang Li Copyright Zeliang Li, November 2005. All rights reserved.
Permission to UseIn presenting this thesis in partial fulfillment of the requirements for apostgraduate degree from the University of Saskatchewan, I agree that the libraries of thisUniversity may make it freely available for inspection. I further agree that the permissionfor copying this thesis in any manner, in whole or in part for scholarly purposes, may begranted by the professors who supervised this work or, in their absence, by the Head ofthe Department or Dean of the College in which this thesis work was conducted. It isunderstood that any copying, publication or use of this thesis or parts thereof for financialgain shall not be allowed without my written permission. It is also understood that duerecognition shall be given to me and to the University of Saskatchewan in any scholarlyuse which may be made of any material in this thesis.Requests for permission to copy or to make other use of material in this thesis, inwhole or in part, should be addressed to:Head of the Department of Mechanical EngineeringUniversity of SaskatchewanEngineering Building57 Campus DriveSaskatoon, Saskatchewan S7N 5A9Canadai
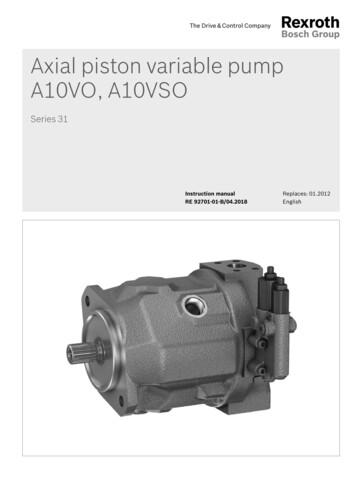
AbstractCondition Monitoring is an area that has seen substantial growth in the last fewdecades. The purpose for implementing condition monitoring in industry is to increaseproductivity, decrease maintenance costs and increase safety. Therefore, conditionmonitoring can be used not only for planning maintenance but also for allowing theselection of the most efficient equipment to minimize operating costs.Hydraulic systems are widely used in industry, aerospace and agriculture and arebecoming more complex in construction and in function. Reliability of the systems mustbe supported by an efficient maintenance scheme. Due to component wear or failure,some system parameters may change causing abnormal behaviour in each component orin the overall circuit. Research in this area has been substantial, and includes specializedstudies on artificial fault simulation at the University of Saskatchewan.In this research, an axial pump was the focus of the study. In an axial pistonpump, wear between the various faces of components can occur in many parts of the unit.As a consequence, leakage can occur in locations such as between the valve plate andbarrel, the drive shaft and oil wiper, the control piston and piston guide, and the swashplate and slippers. In this study, wear (and hence leakage) between the pistons andcylinder bores in the barrel was of interest. Researchers at the University ofSaskatchewan, as well as at other research institutions, have been involved in studies todetect wear in pumps using a variety of condition monitoring algorithms. However, toverify the reliability and indeed, limitations of some of the approaches, it is necessary totest the algorithms on systems with “real” leakage. To introduce actual wear in the pistonof pumps can be very difficult and very expensive. Hence, introducing piston wear in an“artificial” manner would be of great benefit in the evaluation of various conditionmonitoring techniques.Since leakage is a direct consequence of piston wear, it is logical to conclude thatvarying the leakage in some prescribed manner can be used to artificially simulate wear.A prime concern, therefore, is to be able to precisely understand the dynamicrelationships between the wear and leakage and the effect it has on the output flow orpressure waveform from the pump.ii
Introducing an artificial leakage to simulate the wear of pistons is a complex task.The creation of an artificial leakage path was not simply a process of providing a resistiveshort to the tank at the outlet of the pump port as was done in other studies. The objectivewas to create a leakage environment that would simulate leakage from a single piston (orcombination of several pistons thereof). The complexity of the flow and pressure ripplewaveforms (which various condition monitoring algorithms require) was such that a morecomprehensive leakage behaviour had to be modeled and experimentally created.A pressure control servo valve with a very high frequency response was employedto divert the flow from the pump outlet with a prescribed waveform directly to the tank tosimulate the piston leakage from the high pressure discharge chamber to the pump casedrain chamber as the simulated worn piston made contact with the high pressurechamber. The control algorithm could mimic the action of a single worn piston at variousdegrees of wear. The experimental results indicated that the experimental system couldsuccessfully introduce artificial leakage into the pump which was quite consistent with aunit with a “real” worn piston. Comparisons of the pressure ripples from an actual faultypump (worn piston) and the “artificial” faulty pump (artificial leakage) are presented.iii
AcknowledgementsThe author would like express his sincere gratitude to his supervisors, Dr. RichardBurton and Dr. Peter Nikiforuk, for their valuable guidance, advice and encouragementthroughout the course of this study and the writing of this thesis. It was a great pleasurefor the author to work with his supervisors. This has been a precious opportunity for theauthor not only to gain knowledge and skills in the fluid power and control areas, but alsoto learn much more about approaches, attitudes towards work and interpersonal relations.In addition, the author would like to extend his sincere thanks to Mr. Doug Bitnerfor his essential technical assistance during all phases of this research. Additionally,gratitude is also owed to Mr. Tonglin Shang for his physical assistance.Furthermore, the author wishes to express a lot of thanks to his family,particularly his wife, Hong Jiang, for their encouragement and support during this study.Last, but not least, the author gratefully acknowledges the financial assistance,from a Discovery Grant from NSERC.iv
Table of ContentsPermission to Use .iAbstract .iiAcknowledgements .ivTable of Contents .vList of Figures .viiiList of Tables xiNomenclature .xiiChapter 1 Introduction .11.1 Background .11.2 Condition monitoring of hydraulic pumps . .41.3 Project objectives .81.4 Thesis outline . .10Chapter 2 Axial Piston Pump .112.1 Introduction of variable axial piston pump .112.2 Failure modes and effects for pump components .182.3 Choice of parameter to be studied: piston wear .222.4 Summary . 22Chapter 3 Simulation . 233.1 Relationships between piston leakage and piston wear .233.2 Simulation model .263.3 Simulation results .283.4 Summary .37Chapter 4 Methodology .394.1 Experimental methodology .394.2 Experimental test system .414.2.1 Test circuit system .41v
4.2.2 Data acquisition system .444.2.3 Pressure control servo valve . 444.2.3.1 Pressure control servo valve inner structure and mechanism .444.2.3.2 Pressure control servo valve steady state flow . .474.3 Method to measure leakage . 484.3.1 Leakage from the worn piston (real leakage) . 484.3.2 Introduced artificial leakage in the pressure servo valve .484.4 Pressure control servo valve response . 504.5 Test conditions and procedure . 524.6 Summary .52Chapter 5 Experimental Results .545.1 Experimental data repeatability . 545.2 Pressure ripples from the normal pump .565.2.1 Pressure ripples .565.2.2 Pressure ripples changes with temperature .585.2.3 Output flow relationship with pressure .595.3 Pressure ripples from the experimental faulty pump . .615.4 Ripples from the artificial leakage faulty pump .665.4.1 Artificial leakage .665.4.2 Pressure ripple from the artificial faulty pump . .705.5 Comparison of the normal pump and faulty (artificial) pump pressure waveforms.745.6 Variable artificial leakage summary .835.7 Summary .84Chapter 6 Conclusions and Future Work .856.1 Introduction .856.2 Summary and Conclusions .856.2.1 Faults in an axial piston pump, piston wear and its effecton pump performance .85vi
6.2.2 Methodology to introduce leakage .866.2.3 Experimental results 876.2.4 Research conclusions .876.3 Recommendations for future work .87References . 88Appendix AReynolds Number for Piston Leakage Fluid .92Appendix BDerivation of Equations . .93B.1 Derivation of the Equation for Total Pump Kinematical Flow .93B.2 Derivation of the Equation for Pump Output Pressure .97Appendix CSimulation Parameter .105Appendix DCalibration Information . .107D1Pressure Transducer . 107D2Flow Transducer . .108D3 Diaphragm Differential Pressure Transducer . .109Appendix EExperimental Instruments .111Appendix FDerivation of the Flow through the Pressure Control ServoValve .113Appendix IPower Spectral Density .118Appendix HNormalization Data .120vii
List of FiguresFigure 1.1 A basic hydraulic circuit: pump, control valve and actuator . 2Figure 1.2 A variable displacement axial piston pump . .8Figure 2.1 Variable displacement axial piston pump .13Figure 2.2 Pump pumping motion .15Figure 2.3 Relief notches in valve plate (Vickers PVB5) .16Figure 2.4 Instantaneous cylinder chamber pressure .17Figure 3.1 Pumping motion with leakage . 24Figure 3.2 Piston leakage passage - Annular leakage path . .25Figure 3.3 Pump kinematical output flow (simulated) .29Figure 3.4 Pump output flow waveform (simulated).30Figure 3.5 Pump output pressure waveform (simulated).32Figure 3.6 Pump output pressure waveform (experimental).32Figure 3.7 Comparison of normal and faulty pump flow waveform (simulated) .33Figure 3.8 Piston delivered flow related to concave pattern (simulated) .34Figure 3.9 Comparison of normal pressure and faulty pump pressure waveforms(simulated) . .35Figure 3.10 Faulty pressure ripples from simulation and experiment .35Figure 3.11 Comparison of pump flow ripples with different worn pistons (simulated).36Figure 3.12 Comparison of pump pressure ripples with different worn pistons(simulated) . . .37Figure 4.1 Schematic of introducing artificial piston leakage for pump .40Figure 4.2 Schematic of the experimental setup 42Figure 4.3 Photograph of the experimental system .44Figure 4.4 Inner structure of the pressure control valve 46Figure 4.5 Relationships of Fss, Fial and Fal .49Figure 4.6 Pressure control servo valve responses with input signal . 51Figure 5.1 Pressure ripple repeatability (experimental) 55Figure 5.2 Pressure ripple for the normal pump (experimental) 56Figure 5.3 Power spectral density of normal pump pressure ripple .57Figure 5.4 Comparison of the pump output flow at 26.50C and 380C (experimental). 58viii
Figure 5.5 Comparison of the pump output pressure at 26.50C and 38.0 0C(experimental) 59Figure 5.6 Comparison of pump output flow between 7 MPa and 21 MPa at 30.00C(experimental) .60Figure 5.7 Pressure ripple of the faulty pump (experimental) .62Figure 5.8 Real faulty pump power spectral density .63Figure 5.9 Pressure ripple comparison between normal pump and faulty pump(experimental) . .64Figure 5.10 Power spectral density comparisons of normal pump and faulty pumppressure . .64Figure 5.11 Pressure comparison of normal and real faulty pumps (experimental) .65Figure 5.12 Comparison of normal pump and faulty pump power spectral density .66Figure 5.13 Introduced additional artificial leakage (experimental) .67Figure 5.14 Comparison of the additional artificial leakage and simulatedtheoretical piston leakage . .68Figure 5.15 Servo valve input signal 69Figure 5.16 Introduced additional artificial leakages from different valve inputs(experimental) .70Figure 5.17 Pressure ripple from artificial faulty pump (experimental) 71Figure 5.18 Power spectral density of the pressure ripple from the artificial faultypump .72Figure 5.19 Pressure ripples from different artificial faulty pumps (experimental) .73Figure 5.20 Pressure ripples from different artificial faulty pumps (detailed,experimental) . .73Figure 5.21 Comparison of the experimental pressure waveforms for the pump with a realfault (not artificially created) and a normal pump .74Figure 5.22 Normalized data of a pump with a real fault (60 microns) with respect to thenormal pump .75Figure 5.23 Comparison of the artificial faulty pressure and the normal pressurewaveforms (experimental) . . .76Figure 5.24 Normalized pressure data of artificial faulty pump . .76ix
Figure 5.25 Comparison of pressure ripple between normal pump and faulty pumppressure waveforms (experimental) 77Figure 5.26 Comparison of normalization data of real fault and artificial fault pressure(60 microns) . .78Figure 5.27 Pressure ripple waveform comparison of a normal and real faulty pump (30microns) (experimental) .79Figure 5.28 Normalized data of the real faulty pump (30 microns) .80Figure 5.29 Pressure comparison of a normal and artificial faulty pump (30 microns).81Figure 5.30 Normalized data of artificial faulty pump (30 microns) .81Figure 5.31 Comparison of the normalized data of the real faulty and the artificial faultypump pressure waveform (30 microns) .82Figure 5.32 Comparison of real faulty and artificial faulty pump pressurewaveforms (30 microns) (experimental) 83Figure A.1 The schematic for piston leakage .92Figure B.1 Scheme of axial piston pump for derivation of the flow equation .94Figure B.2 Scheme for simple hydraulic circuit .97Figure B.3 Control volume for the instantaneous piston flow .98Figure B.4 Scheme for derivation of pump output pressure equation .99Figure B.5 Discharge area of the piston port opening to the discharge chamber in thevalve plate .104Figure D.1 Calibration of pressure transducer. .107Figure D.2 Calibration of flow transducer .109Figure D.3 Calibration of diaphragm pressure transducer (used to measure calculateartificial leakage flow) . .110Figure F.1 Equivalent circuit of the servo valve torque motor .113Figure F.2 Simplified block diagram Model 15-010 pressure control servo valve. .114Figure F.3 Simplified block diagram Model 15-010 pressure control servo valve withneedle valve as load .116Figure H.1 Definition of data normalization .121Figure H.2 Normalized data plot. . 121x
List of TablesTable 1.1Typical components’ faults and their effects on circuit performance .3Table 2.1 Pump components’ possible faults (causes) and effects .19Table 5.1 Comparison indicator of four data sets . . . 55Table 5.2 Artificial fault data 84Table 5.3 Real fault pump data .84Table C.1 Simulation parameter list .105Table E.1 Summary of equipment for experiment .111xi
NomenclatureAdn The discharge area for Pn piston port opening to the discharge chamber in valveplate [m2]A p Piston of area [m2]Av The discharge orifice area of the needle valve [m2]B Bulk modulus [Pa]C d 1 Flow discharge coefficient of the discharge area for piston port opening to dischargechamberC d 2 Discharge coefficient of needle valve orificedDiameter of piston [m]hg Gap (radial clearance) between piston and cylinder bore [m]L Length of leakage passage [m]m Number of pistons in pumpn 1, 2, 3 . mρ Flow density [kg/m3]Pc Case drain chamber pressure [Pa]Pfp Faulty pressure ripple [Pa]Pnd Pressure normalization dataPnp Normal pressure ripple [Pa]Ppn Instantaneous pressure in Pn piston chamber [Pa]Ps Pump output pressure (discharge chamber pressure) [Pa]Qkpn Kinematical flow delivered by Pn piston [m3/s]Qlpn Internal leakage from Pn piston to case chamber [m3/s]QpFlow from piston chamber to discharge chamber [m3/s]Q pn Flow from Pn piston chamber to discharge chamber [m3/s]QsrRpPump output flow [m3/s]Radius of piston [m]Piston pitch radius on barrel [m]S pnStroke for Pn piston [m]tV0VcTime [second]Piston initial volume [m3]Discharge chamber control volume [m3]Greek symbols:αPhase delay [rad], equal to 2 π / mβAngle of swash plate [rad]µAbsolute fluid viscosity [N.sec/m2]ωAngular velocity of the pump drive shaft [rad/s]xii
Chapter 1 Introduction1.1 BackgroundCondition monitoring is an area that has seen substantial growth in the last fewdecades. As a simple definition, condition monitoring is an approach which can be usedto gain information on the “health” of components or systems. Condition monitoringincludes not only fault detection and fault diagnosis, but also fault analysis. The purposefor implementing condition monitoring in industry is to increase productivity, decreasemaintenance costs and increase safety. Therefore, condition monitoring can be used notonly for planning maintenance, but also for allowing the selection of the most efficientequipment to minimize operating costs. The final goal of a successful conditionmonitoring scheme is to detect the presence of faults before a catastrophic event orunscheduled shutdown occurs. Condition monitoring is a management tool whichprovides information about the likely future performance, which is most suitable whenthe failure mode is gradual and progressive.Hydraulic systems are becoming more complex in design and in function. Thereliability of these systems must be supported by efficient “maintenance regimes”. Thereare three such regimes: breakdown maintenance (most expensive), time basedmaintenance, and condition based maintenance (least expensive) [1]. Choosing amaintenance regime depends on the system. If the systems do not require high reliabilityor if economics or safety is not the issue, the breakdown maintenance approach may besufficient. However, for maximum reliability and safety, the condition based maintenanceapproach should be implemented. In general, most hydraulic systems do require highreliability and thus the latter condition monitoring approach is most desirable.Condition based maintenance of a system can be very cost effective. Hibberd(1988) estimated that it would save about 100M to 150M per year to apply conditionbased maintenance of pumping systems alone in British industry [2]. Thus, the conditionmonitoring of a hydraulic system can bring benefits other than just reliability andimproved safety.Fluid power systems are widely used in industries such as aerospace, automotive,agriculture, and construction just to name a few. One of the most important1
considerations in any fluid power system is the control of pressurized fluid. If the controlcomponents are not selected properly, the system will not work as required. Consider thehydraulic circuit shown schematically in Figure 1. This circuit shows three of the basiccomponents which are usually found in hydraulic applications: pump, control valve andactuator. Due to component wear or failure, some system parameters may change causingabnormal behavior in each component or in the overall circuit itself. Therefore, if theaccurate and reliable performance of the system is an objective, it is necessary to monitorthe condition of the main components of the system. To do so, it is necessary tounderstand what kind of failures can exist in each component and how those failuresaffect both the component’s performance and that of the complete system.A c tu a to rD ir e c t io n a l c o n t r o l v a lv ePum pFigure1.1 A basic hydraulic circuit: pump, control valve and actuatorDuring the past few decades, a substantial amount of research has been done onthe condition monitoring of hydraulic systems and components, mainly related to valvesand actuators. Some of the more common techniques used for condition monitoring are:contamination control [3, 4], parameter or state estimation [5], spectral analysis [6],vibration analysis [7], acoustic emission [8], expert systems [1, 9], thermodynamic2
measurement [10], extended Kalman filter (EKF) [5, 11], fuzzy logic [12], neuralnetworks (NN) [1, 13, 14, 15, 16, 17] and support vector machine (SVM) [18]. Some ofthese techniques are “intrusive”; that is, they require the removal of a component part.Some are “off-line”, in that the analysis is done later or at some remote location. Sometechniques are “on-line” in that the measurement is made in real time. A more detaileddiscussion of these areas and the work published on these topics is presented in thesection on literature review.Consider the circuit shown in Figure 1. As mentioned above, the maincomponents are the pump, valve and actuator. Table 1 lists some of the more commonfaults which are experienced in these components and the effects that they have on thesystem performance.Table 1.1 Typical components’ faults and their effects on circuit performanceComponentsActuatorFaultsEffects1. Internal leakage (pistonwear).Directionalcontrol valveAxial pistonpump1. Poor positional accuracy, oiloverheating, actuator drift.1. Internal leakage (spooland body).1. Noise, inability to lock spool inthe center position.2. Sticking (friction change).2. Noise, spool moves erratically.1. Internal leakage (piston1. Pressure generation insufficient,wear)flow drop off, noise.2. Wear of swash plate,2. Noise, overheating, vibration,bearing, slipper, driverincreased torque and henceshaft.input power.A great deal of the published research has focused on the application of conditionmonitoring techniques to one or several of the faults listed in Table 1. In most cases,verification tests on the components required physical failures which can be very costly,unsafe and in some cases, unreliable (a reasonable number of samples not being able tobe collected for statistical significance). In order to reduce the cost, and to increase safety3
and reliability, the components should not be damaged during these kinds of failures.Therefore, one approach that has been used is the introduction of “artificial faults” whichsimulate faults without damaging the components. Hindman et al [1] used “cross portcalibrated orifices” to simulate internal leakage in the actuators and valves of anindustrial backhoe loader. Bhojkar et al [19] used one of solenoids in a solenoidproportional valve to create an external force on the spool to mimic different frictioncharacteristics on the valve spool. In addition, Le et al [13] and Crowther et al [14]introduced artificial friction at the actuators using a connecting cylinder whose dampingwas adjusted by cross port calibrated orifices.1.2 Condition monitoring of hydraulic pumpsMany studies have been published during the past few decades on the topic of thecondition monitoring of individual hydraulic components and of complete systems.Several techniques were used frequently in these studies. The following review will focuson the condition monitoring research and associated analyzing techniques as applied tohydraulic pumps which, as will be stated later, are the subject of this study.Neill et al [8] used acoustic emission (AE) to detect incipient cavitation incentrifugal impeller pumps. The raw AE data from the AE sensors at three points wereprocessed using root mean square (RMS). The results showed the AE can detectcavitation inception by non-intrusive means.Yates [20] proposed that thermodynamic theory could be used to monitor pumpperformance. A monitoring system was used to measure various parameters, such asrelative enthalpy change, suction pressure, discharge pressure, fluid temperature, andinput power to the motor. The efficiencies of the pump and motor were calculated.Weddfelt et al [10] used a thermodynamic measurement method to monitor the conditionof a fluid power system. The efficiencies of a pump, motor and fluid power transmissionlines were calculated. The thermodynamic method was found to be dependent onmeasuring the quantities flow, pressure and temperature as compared to more traditionalmethods which use angular speed and torque in additional to flow rate, and pressure. Themain drawback with a measurement system based on the thermodynamic properties wasthat it was very slow.4
Cao [5] utilized the extended Kalman filter (EKF) to estimate parameters for theswash plate assembly and control piston in a load-sensing pump. In this research, thespring constant, damping coefficient and spring pretension in the swash plate assemblywere estimated. The results indicated that the estimated values did agree quite well withtheir physical counterparts.Lu et al [16] used neural networks (NN) to predict the wear in pistons in an axialpiston pump. He simulated piston wear by machining clearances between the piston andsleeve. He used pump inlet pressure to detect changes in the performance of the pump.The sum of the inlet pressure variation (peak ripple of certain pistons) was used to train aneural network. The trained network was then tested by subjecting the network to a signalfrom a pump which was not used to train the network. He found that NNs could be usedto detect increasing wear in the pistons. However, he found that if a network was testedwith data that displayed faults larger than those used in the training, then a successfulfault prediction was not possible. Conversely, he found that if the degree of wear wasequal or less than that used in training, then the success rate was high. He concluded thatthis method had some limitations in reliably detecting faults. He also pointed out that thecost to replace the original piston by the machined pistons was very expensive, andintroduced uncertainty in the experimental technique. He recommended that some otherform of introducing the fault would be highly desirable.In the most studies involving the condition monitoring of pumps, bearings wereoften the focus of the study and often involved vibration analysis. Luo and Smith [21]used demodulation analysis (one method to process the original vibration signal byfiltering and rectifying) to classify the rolling-element bearing faults for earlier detectionof bearing faults. Demodulation enhances repetitive signals which are caused by pulsesemanating from damaged bearings. In the early stage, the signals for bearing flaws maygo undetected among general machine noise. The use of the demodulation detectiontechnique makes it possible to pinpoint not only the nature, but the location of bearingdamage, such as inner race, outer race, rolling element, etc. This method could be use toclassify early bearing faults in pumps.Wang et al [22] classified bearing faults into six types. Six bearings with thesefaults were tested on a test-rig pump and vibration signals were collected under similar5
conditions. All six sets of data were pre-processed. The input vectors were then formedby the time-domain RMS values plus the frequency-domain RMS values in eachfrequency band for all six sets of data. The bearing faults were classified successfullyusing neural network models. Wang concluded that the most relevant features of preprocessing the data for this problem were not only to save time, but also to achieve a highpattern classification success rate.Domotor and Tepro [23] detected rolling bearing defects in a hot water circulatingpump by frequency spectral analysis. They concluded that defects and cavitation aresimilar in appearance in the case of water pumps. Therefore, the vibration spectra must beanalyzed carefully. In addition, they concluded that it is advisable to measure severalparameters vibration, for example, acceleration, envelope acceleration and RMS velocity.Envelope acceleration usually can give an earlier alert signal than RMS velocity.In contamination monitoring, ferrography i
In this research, an axial pump was the focus of the study. In an axial piston pump, wear between the various faces of components can occur in many parts of the unit. As a consequence, leakage can occur in locations such as between the valve plate and barrel, the drive shaft and oil wiper, the control piston and piston guide, and the swash

