Transcription
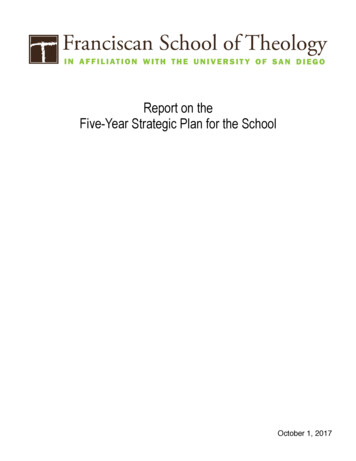
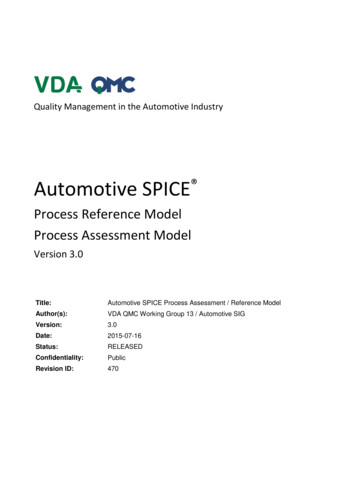
Automotive data acquisition system - FSTDavid Rua CopetoInstituto Superior TécnicoTechnical University of LisbonLisbon, PortugalSeptember 28, 2009much easier tuning of vehicles, monitoring of criticalparts (such as the engine) and as a useful tool for assessing driver performance. Current solutions found onthe market offer the ability to record wheel speed, temperature, pressure, engine RPM’s, suspension travel oracceleration.By adding wireless transmission hardware to a datalogger, gathered data can be analyzed right after beinggenerated, and even in real-time, allowing actions to betaken much quicker in the case of dangerous or failure situations; in the case of two-way communicationit may also be used to adjust some parameters.This work is primarily aimed at a particular prototype vehicle (figure 1), built at Instituto Superior Técnico (IST), to participate in the Formula Student competitions. In these competions, held every year in different countries, teams of students compete with theirprototypes in many different ways, from the dynamicperformance of the vehicles on track to the way theymanage their team.Abstract - This thesis addresses the design, implementationand validation of a telemetry system for a Formula Studentprototype vehicle, having in mind an existing CAN-bus network of sensors in it. To achieve this, the proposed systemis divided in two blocks: a mobile station and a base station.The first, is placed on the vehicle and is connected to its sensors through a CAN-bus. This mobile station has the functionof recording locally the data generated by the bus activity andalso of transferring this data wirelessly to the base station located off-track. The second has the function of picking up thedata sent through the wireless link and presenting it in an attractive and comprehensible way to the user. Besides the “online” operation, the base station is also capable of presentingdata from previous logging sessions for analysis.Given the type of vehicle (and competition) this work is applied to, certain requirements are set in terms of both systemcapabilities and project management. In one hand the systemmust be able to sustain a harsh environment, namely vibration, heat, liquids and electromagnetic interference, and onthe other hand it must be lightweight, cheap and user-friendly.The developed telemetry system was successfully deployedon a practice track, being able to reliably record CAN-busdata of a variable number, sample rate and type of sensors.The performance of the radio link between stations was alsoevaluated both in controlled and real environments in orderto understand the limits of the system. The results show amaximum wireless data rate of 4.28 kB/s for a typical vehicleposition on track.Keywords: Telemetry, CAN-bus, Zigbee, Formula Student,automotive data logger, graphical user interface.1IntroductionFigure 1: The prototype FST03 during a test run.A great deal of time, effort and expense goes into theconstruction of a prototype. As it represents the tangible result of the breakthroughs accomplished after manyhours of research, it is of major importance to havethe best enlightenment possible on it’s performance andmaintenance conditions, and in this way nowadays sensor networks and data gathering systems are a mandatory part of any fairly complex machine.An important field where data loggers have been usedextensively is the automotive area. Specially in competition, data logging plays an important role, allowing aThe project presented here has the objective of designing and building a fully working CAN-bus data logger with telemetry capabilities for a Formula studentprototype vehicle. The system should be able to connect with an existing CAN-bus network of sensors andassure the recording of all the data put on the CAN-bus.Besides this, it should be able to transmit live sensordata through a radio link while the vehicle is running onthe track to a location off-track, and making it available1
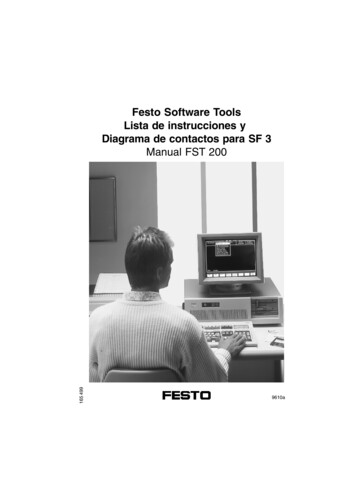
for the user in an atractive way. Finally, the built systemshould be validated in a real environment, that is, working in the prototype vehicle its meant for (figure 1).22.1In order to interface the CAN-bus controller of theMCU to the physical medium, a transceiver is used Microchip’s MCP2551 CAN transceiver. This IC translates the TTL level signals output by the microcontrollerinto signals conforming to ISO-11898 up to a speed of1 Mbit/s [3].According to physical layer specification ISO-118982 the CAN-bus should be fitted with a terminating resistor of 120 Ω on both ends with the purpose of eliminating signal reflections and ensure the bus has the correctDC values [5], as can be seen in figure 2.Mobile stationMicrocontroller and Real-Time ClockAt the core of the mobile station a microcontrolleris used to interconnect and control all the other modules. The device used is a Microchip’s PIC18F46858 bit microcontroller operating at 5 V and running withan oscillator frequency of 40 MHz, provided by the external 10 MHz crystal in combination with the internal4 PLL.In order to have a time base for the files created on thememory module (section 2.4) a real-time clock (RTC) isadded to the mobile subsystem. Connected to the microcontroller, using an I²C bus, is a Maxim’s DS3232 RTC,which has high accuracy and incorporates in its packagean oscillator, a temperature sensor and age compensating logic, achieving in this way a very robust device thatcan withstand temperature swings [7].For continuous timekeeping a 3 V (200 mAh) coincell battery (CR2032) is connected to the RTC. Whenthe supply voltage drops bellow the battery’s voltage,the power supply changes to battery mode. In thismode the typical current consumption for timekeepingis 1.5 µA and therefor the cell’s life is more than 15years, which is large enough for this application.Figure 2: CAN-bus physical layer block diagram.2.3Wireless LinkTo implement the wireless communication betweenthe mobile and the base station the chosen radio modules are MaxStream’s XBee-Pro OEM. The key featuresof the devices, as given by the manufacturer [8, page 5],are presented in table 1.Table 1: XBee-PRO transceivers specifications.2.2CAN-bus InterfaceThe Controller Area Network (CAN) is a serial communications protocol developed by Bosch [1] widelyused in automotive applications. The CAN communication protocol is a Carrier Sense Multiple Access/Collision Detection (CSMA/CD) protocol. Thismeans that every node on the network must monitor thebus for a period of no activity before trying to send amessage on the bus (Carrier Sense). Also, once this period of no activity occurs, every node on the bus has anequal opportunity to transmit a message (Multiple Access). As for the Colision Detection, if two nodes on thenetwork start transmitting at the same time, the nodeswill detect the collision and take the appropriate action.In the CAN protocol, a non destructive bitwise arbitration method is utilized, which means that messages willremain intact after arbitration, even if collisions are detected. All this arbitration takes place without corruption or delay of the higher priority message (the nodetransmitting the highest priority message will continueand the others will wait) [2].SpecificationsXBee-PROIndoor/Urban RangeOutdoor line-of-sight RangeTransmit Power OutputRF Data RateSerial Interface Data RateReceiver SensitivitySupply VoltageTransmit Current (18 dBm)Idle / Receive CurrentPower-down CurrentOperating FrequencyUp to 100 mUp to 1500 m60 mW (18 dBm)250.000 bps1200-115200 bps-100 dBm)2.8-3.4 V215 mA55 mA 10 µAISM 2.4 GHz bandIn order to validate the specifications given by themanufacturer, measurements were done (table 2) for thecenter frequency, the channel power, the bandwidth occupied by a channel and the Adjacent Channel PowerRatio (ACPR), for different power output settings tolook for possible changes in performance.Taking advantage of the radio modules automaticallyoutputting the Received Signal Strength (RSS) value,2
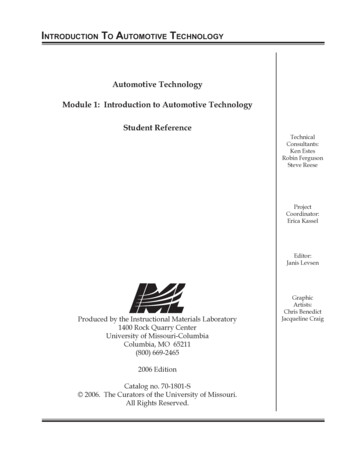
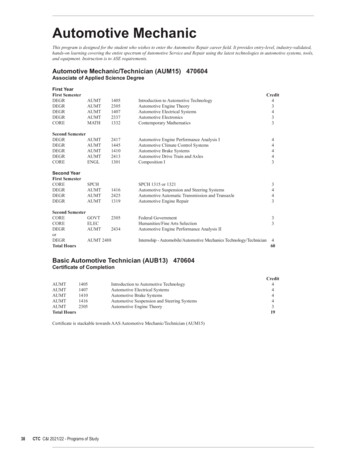
(60 mW), in frequency channel 2.410 GHz, with broadcasting addressing mode, no sleep mode, retries, acknowledge packets nor encription of the messages.Table 2: Radio modules measurements results for 18 dBmoutput power setting.Measurements (expected)ResultError (%)Center Freq. (2.410 GHz)Channel Power (18 dBm)Bandwidth (2 MHz)ACPR2.410401 GHz16.4 dBm2.41977 MHz-41.73 dB0.0178.8921n/a2.4Since a wireless link is being used, there is the possibility of transmission interruption or fail (range shortage or electromagnetic interference). To ensure that nodata gathered by the sensors is lost, it is necessary tohave a storage component. This is chosen to a USBmemory drive together with FTDI’s Vinculum VNC1L1A USB Host Controller. This IC is able to, besideshandling the USB Host Interface, deal, in a transparent way, with the FAT file structure. The Vinculum isintegrated in the system with the help of the VDIP1 development module, as can be seen in figure 4.measurements for power/distance ratio are also madeand compared with the theoretical loss of signal strengthof an electromagnetic wave in a line-of-sight propagation through free space - Free Space Path Loss (FSPL).In this way, having the devices at a distance in meters,d, communicating using a carrier of frequency, f , andwith c being the speed of light in vacuum:FS PL 4πdλ!2 4πd fcData storage!2(1)which expressed in dB is:Figure 4: VDIP1 module schematic detail.FS PLdB 20 log10 (d) 20log10 ( f ) 147.55.(2)Although there is an extra cost introduced by the useof one more module to interface the memory, substantial improvements in operating speed and implementation time are made, as the overhead of handling the FATstructure with the microcontroller (in the case of a memory card) is eliminated, as it is transferred to the dedicated USB Host Controller. Other advantages of thissolution are, besides the very high endurance of USBflash drives, their low price and high availability compared to memory cards.The connection between the microcontroller and theVDIP1 module is done through a parallel FIFO interface using 8 data lines and 4 control linesThe result can be seen in figure 3. Although the results are quite far from the theoretical value (in blue),still at the tested distance the transceivers are workingabove the sensibility limit of -100 dBm (table 1). Thereasons for the values being much lower than the theoretical expectations are believed to be related with theway the test was conducted. The number of samples ofthe RSS value per distance is very low and since between successive packets there are variations in pathand reflections in surrounding objects then, likewise,the power varies a lot.2.5Power supplyThe prototype vehicle has a 12 V battery that powersall the electrical systems on it and since two differentvoltage levels are needed on the circuit, 5 V and 3.3 V,two regulators are used.During the test of the complete mobile station’s circuit it was noted that when the system would be powered without a USB drive and then the drive was be connected, the MCU would reset. This behaviour was givento the sudden current draw by the USB drive to whichthe regulator could not respond and caused a drop onthe MCU supply voltage enough to make it reset. Tomitigate this fault a high value capacitor was added tothe system.The power consumption by the mobile station wasmeasured in 2 different states. In the Standby state,Figure 3: Result of the power/distance ratio measurement.FS PLdB in blue. Using a whip antenna in green.The RF modules interface with the MCU is donethrough a TTL level asynchronous serial port at115200 baud and are configured to work at 18 dBm3
that was fitted to the bottom so that fixation holes couldbe added can also be seen. These provide safe holdingpoints when the unit is placed on the vehicle.when the system is waiting on orders from the base station, the DC current, as measured with a multimeter, is145 mA which is slightly higher than expected since themajor contributors should be the MCU, that accordingto [4, page 424] draws typicaly 28 mA (and maximum44 mA), the Vinculum that needs 25 mA [6, page 14]and the XBee-PRO radio transceivers, that are configured for no sleep, and so their power consumption, from[8, page 8], is 55 mA1 . The difference between the expected value and the result for the current consumptionin this state is believed to be related with both the USBHost controller module circuits and the USB memorydrive.For the measurement when the station is in the Logstate, a different method had to be used in order to beable to characterize the comsumption in the most powerintensive phase, that is when a message shows up inthe CAN-bus and it is recorded in the memory and sentthrough the wireless link. A 0.1 5% Ω resistor was fitted in series with the positive supply line and the voltagedrop between its ends was observed in the differenceof 2 channels in an oscilloscope to be approximately30 mV. From this, the value of the current burst is computed to be 300 mA, a value that is due to the high current consumption of the radio transceiver, according to[8, page 8] of 215 mA, while it is in transmit mode.2.6Figure 5: Final assembly of the PCB board inside the enclosure fitted with cables to the connector and power switch. Thetransceiver adapting cable and the main regulator heatsink canalso be seen.Since is a system which is going to be used by otherpeople, an informative sticker and information LED’swere added. They provide provides basic informationon power and signal connections, as well as, antennatype, and allow the user to easily find out the state inwhich the mobile station is, respectively. The finishedmobile station’s prototype can be seen in figure 6.Prototype constructionThe layout of the mobile station’s printed circuitboard was done in Altium Designer, and it’s design hadthe size, the easy assembly and the high versatility ofthe prototype as main concerns. The size was reducedby using SMD components as much as possible but stillkeeping enough space for an easy assembly, as well asfor the wires and connections of the board to it’s exterior connectors. The versatility and expandability of theboard was assured by providing access to some extrawireless radio’s pins (RSS signal and 3.3 V regulatedsupply), to all the microcontroller’s ports, and also byfitting extra placement holes for “big” capacitors (seenbefore in section 2.5).To house the PCB board, a commercial box was modified in order to support the circuit’s connections to theCAN-bus, the USB memory drive, the antenna and thepower switch. The CAN-bus cabling running acrossthe vehicle uses IP672 sealed connectors, so a flangedplug is mounted on one of the enclosure’s side panelsfor superior resistance and isolation as can be seen infigure 5. In the same figure the extra aluminium pieceFigure 6: Final mobile station’s prototype.1 According to [8, page 22] when the modules are configured for nosleep, their power consumption in idle mode is the same as in receivemode.2 Ingress Protection rating. The first number concerns solid materials and the second liquids: 6-Totally protected against dust, 7Protected against the effect of immersion up to 1 m.2.7SoftwareThe program state diagram running in the mobile station’s microcontroller is shown in figure 7. At power up,4
there is first an initialization stage. The MCU’s ports,UART communication channel and the CAN-bus controlling hardware is configured, the Vinculum USB Hostcontroller is initialized and the presence of a USB driveis checked for. The program then stays in Standby tilla Start logging command arrives through the wirelesslink. From here, a new file is started on the USB driveand the program enters the Log loop, being interruptedfor each arriving message: messages on the CAN-bus orcommands from the base station on the serial line (coming from the radio link). The interrupt routine for theCAN-bus takes care of the incoming messages, puttingtogether a data frame from the meaningful CAN message data and sending it both to the storage device andthe base station (through the radio link). If a Stop logging command is received through the serial line, meaning the user issued a stop order in the base station software, the file (on the USB drive) is closed and the environment is reset for a new session. In the followingparagraphs a deeper insight into the main routine of theMCU’s software is presented, along with the interruptroutines and the MCU’s peripherals access routines andimplementation details.Figure 8: Format of the messages sent from the mobile station.3Base StationThe base station is the part of the system that is located off-track (figure 9). Its hardware is formed by awireless transceiver and a PC that runs the user interface software to the system, allowing both “online” datacollection and “offline” data analysis. The software iswritten in C with Qt graphical libraries.Figure 9: Base station.The application is structured according to figure 10.Since it is possible to configure the software for the kindof session and network it will work with, an importantpiece is the startup wizard. This pre-application configuration tool guides the user into the sort of session heFigure 7: State diagram of the mobile station software.wants, asking for all the information needed to build theenvironment. This results in the main application window and the database being built. Deppending on theThe messages (or frames) sent from the mobile sta- type of session the database is filled up with data valtion to the base station through the wireless link have ues, in the case of an Offline session, or is empty, in thealways the same size and format although they can be case of an Online session. Likewise, the data source anddata frames or feedback frames. Data frames are sent structure of the main window also depends on the typewhen the mobile station is in the Log state, and they of session. The data is completly loaded at startup if itscontain the meaningfull fields of the CAN messages re- source is the hard drive or the USB memory drive, or, inceived - the CAN ID of the sensor and the CAN 4 byte the case of an Online session it is received by the serialdata field, plus a frame number. The feedback frames interface “block” comming from the Zigbee radio. Afuse reserved CAN ID numbers to signal Start, Info or ter the main window is built, the user has the possibilityError conditions to the base station. The frames are to change a few details in the visualization of the itemscomposed by 7 bytes and their format is deppicted in and also control the state of the mobile station.figure 8.The wizard is composed of a series of input fields5
Figure 11: Main window in an Online session.rate in kB/s and the current state at which the mobilestation is. It also includes an activity log so that theFigure 10: General structure of the base station software.user has feedback of what is “going on” in the embarkedsubsystem.Everytime the log “Start” button is pressed a new rundesigned to help start the application, and cannot bebegins.Consequently a new file for each sensor to holdskiped. The user must complete the forms in order tothedatafrom the run is created and the Values Plot isproperly build the application for the desired purpose,reset.although in an Online session some of the informationFor both modes of the offline session type (load dataentered can be later modified.The database is organized as a list of sensors. For from hard drive or load from USB drive) the main wineach sensor, besides the data values, details on name, dow has a static structure. The are only two elements,CAN-bus ID and type are kept, and whether the val- the Sensors List and the Plot Area, which make availues should be ploted or not (Online session). There are able all the controls over each trace on the plot and show8 types of sensor available: Tire temperature, Throt- the enabled traces respectively.tle position, Steering position, Wheel speed, Suspension displacement, Engine coolant temperature, EngineRPM and Sine Wave (for testing purposes). For each 4 System performancetype a different display widget exists.In an online session the main window (figure 11) isIn order to evaluate the entire system’s performance,built dinamically, in acordance with the options entered tests are run in two different environments - the benchby the user, which means that not all sensor display wid- and the track.gets are viewable everytime, only if they are being used,and the same for the Values Plot area, only if this output is chosen for (at least) one of the sensors it will be 4.1 Bench testsshown. There are though, some elements that are always built and integrated in the main window. The StaIn the bench, a CAN-bus network emulation platformtus Information and the Sensors List items have this be- is used so that the interaction with the network this workhaviour, but can, like all the items in window, be hidden connects to could be emulated. This testing platformif necessary.is composed of simple modules that can be connectedThere is a sensor display widget for each type of sen- through a CAN-bus and generate data in a similar waysor in the system for displaying its current value, and as the CAN-bus network nodes of the vehicle do.the Values Plot item, displays the incoming data for theThe built platform has nodes that can be freely conselected sensors and enables zooming and axis dragging nected/disconnected to the CAN-bus. Each node of theusing the mouse buttons, besides showing coordinate testing network is programmed to output (by putting avalue with just a click. The current plot image can be CAN-bus message on the bus) a sine wave3 with a cersaved as an image file (.jpg, .png or .bmp) by chosing tain frequency. By using a sine wave, the data generatedthis option on the File menu.in each node is known a priori and so it can be easilyThe Status Information item, besides holding the log spoted if the logging of the CAN-bus messages is beingstate control button, from which the user can issue the successful.commands, shows the name of the file being writen in3 Constructed out of a sample of 91 values per quarter of periodthe USB memory drive, the current wireless link data6
4.1.1CAN-bus interruption routine timmingEach time a new message is put on the CAN-bus, themobiles station’s CAN interruption routine picks it upand sends the meaningful data through the wireless link(using the UART to connect to the radio transceiver).Since the MCU can only deal with one CAN-bus message at a time, the amount of time this process takes iscrucial to understand what is the least time spacing thatmessages put in the CAN-bus can have between them.In order to quantify the time a function takes, a randomMCU i/o pin is set high throughout its duration and captured with an oscilloscope. For this test, one node of theCAN-bus network emulation board is connected to theCAN-bus, and it sends messages periocally as explainedabove.The two important actions made by this routine arethe recording of the data frame on the USB memorydrive and sending it through the serial link to the radiomodule. Likewise the time taken by each of these function calls is measured and in the CAN interruption routine the call to function sendFrame() takes 448 µs andthe call to vinculumWriteToFile() takes 8 µs. This result is in discordance with the aproximated transmissiontime computation that can be done based on the baudrate setting of the UART communication channel. Asmencioned before, the baud rate is set to 115200 baud,which means that the line switches state 115200 timesper second. Since each switch in state is equivalent to 1bit, the time a bit takes to be transmitted is:Figure 12: Setup for the maximum throughput measurementon the bench.Since this test has the objective of studying the behaviour of the wireless connection between stations, themobile station is disconnected from the testing CANbus and the main program is changed so that data framescontaining the sine wave (used in the same way as explained before) values are sent to the base station at acertain frequency. This way, by changing the frequencyat which the frames are sent and computing the amountof bytes arriving per second4 at the receiving end (basestation), the throughput of the wireless link can be obtained as can be seen in figure 13.1 8.681µs,(3)115200and for a data frame with 7 bytes (section 2.7) itmakes the time to transmit a message:tbit tmessage 7 8 bit tbit 486.1µs,(4)which is higher than the measurement made. The difference is found to be due to the MCU baud rate setting.According to [4, page 232], for a device’s oscillator frequency of 40 MHz and a UART baud rate setting of115200 baud, the actual rate has a positive error to theset value and is 125000 baud. If the time per bit and thetime per message are computed again:tbitREAL 1 8µs,125000tmessageREAL 7 8 bit tbitREAL 448µs.4.2Figure 13: Results of the measurements of the wireless linkthroughput in the bench. Expected value in red and the system’s value in blue.(5)(6)Wireless link maximum throughputIn order to obtain the efective maximum data transmission rate achieved by the wireless link between themobile and base stations, the test setup of figure 12 isused, where d 1 m.4 Thethroughput value is computed by making an average of thebytes/s arriving in a period of 60 seconds.7
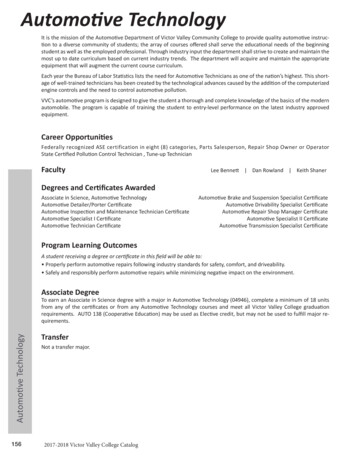
A maximum throughput of 9.61 kB/s is achieved by with time. In this way, it is of interest to study whatthe wireless link with a relative error to the expected of is the best location around the course to place the mo0.04.bile station. Two different locations are used and theyare chosen for both being out of the limits of the trackand being believed to turn out the best results in terms5 Track testsof wireless propagation, due to having less obstacles orless distance to the track. In figure 15, the two locaThe system was also tested in a real environment, that tions can be seen. Location 1 (blue square) is on top ofis, connected to the vehicle’s CAN-bus network of sen- a small garages building, approximately 4 meters high,sors, with the vehicle running on the practice track. The from where all the track can be seen, and Location 2objective was to evaluate the performance of the sys- (red square) is by the course’s start line, at approxitem in the ambience in which it was designed to work mately 1.5 meters in height.and also to understand if its enrollment in an electricallynoisy system would cause failure. Besides the functioning considerations, overall mechanical design and resistance was also evaluated.The CAN-bus network of sensors was composed of3 nodes placed throughout the vehicle as can be seen infigure 14.Figure 15: Practice track image with points of interest. Location 1 (blue square), Location 2 (red square), Track point1 (green circle), Track point 2 (yellow circle), Trees (greenelipse) and Low area (orange elipse).Figure 14: Sensors network on the vehicle. The nodes(green) are connected to the mobile station (red) throughthe CAN-bus (yellow). Sensors: tire temperature (orange),wheel speed (blue), suspension displacement (dark red), throttle (yellow), engine RPM (red), engine coolant temperature(pink) and steering angle (gray).5.1Performance for different base stationpositioningWith the vehicle running on the track, the distancebetween the mobile and the base station is the key factor, for the good operation of the system, being changed8
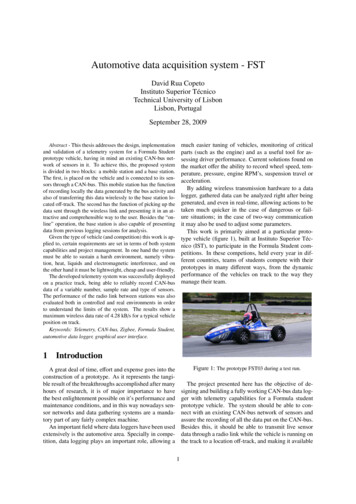
In order to evaluate the wireless link, the emulationplatform (explained above in section 4.1) is added to theCAN-bus network already in the vehicle, with just onenode generating a sine wave, in order to, as before, have“known” data being generated on the embarked system.By looking for imperfections on the sine wave shape(figure 16, captured with the Save plot image functiondescribed in section 3), it was possible to identify thespots on the track where the wireless connection between the mobile and the base station was temporarily broken as the vehicle performs several laps. The“higher” connection loss spots of the track are markedon figure 15. In this figure, it can be seen that with thebase station at Location 1 the critical Track points are1 and 3, which is belived to be due to trees in the station’s line-of-sight propagation5 , and for Location 2 thecritical Track point is number 2, due to the track goingthrough a lower ground area at that point.Figure 17: Data acquired at the practice track. Temperaturesof the tire’s inside (pink) and outside (red), the throttle’s position (blue) and the engine’s RPM (green).5.2Wireless link maximum throughputThe efective maximum data transmission rate on thetrack was obtained for what is thought as one of theworst case scenarios, when the car is passing by Trackpoint 1 (figure 15) and the base station is at Location3, which differs from Location 2 on the height, beingthis approximately 80 cm off the ground. The testingscheme is in all similar to the one of figure 12 for thebench test, with the difference being the distance thatseparates the two stations d ' 300 m, as can be seen infigure 15. The result of the throughput capability of thewireless link can be seen in figure 18.Figure 16: Example of a sine wave with short imperfections(black circle).Overall, the performance in both locations is similar,as the position of objects in the middle of the track areacreates dificulties for both in different spots, and the factthat from one Location to the other, the distance to thevehicle is exchanged by height (which translates in lineof-sight propagation between stations).Although the method used enabled some weaker connection spots on the practice track to be identified, thepeformance/coverage of the connection is good, as, considering the average speed at which the vehicle performs the laps (measured to be always above 40 km/hon this track), the losses in “li
Automotive data acquisition system - FST David Rua Copeto Instituto Superior Técnico Technical University of Lisbon Lisbon, Portugal September 28, 2009 Abstract - This thesis addresses the design, implementation and validation of a telemetry system for a Formula Student prototype vehicle, having in mind an existing CAN-bus net-work of sensors .