Transcription
City Connects:Intervention and ImpactPROGRESS REPORT 2018
ACKNOWLEDGEMENTSCity Connects is grateful for the support of the public and private school districts with whom we partner inBoston, Springfield, Brockton, and Salem, Massachusetts; Dayton and Springfield, Ohio; New York, NewYork; Minneapolis, Minnesota; and Hartford, Connecticut. We thank the superintendents, data liaisons,administrators, and student support professionals who have helped introduce and support City Connects intheir districts. The work of City Connects would not be possible without the support of the principals, teachers,staff, and students in our partner schools. City Connects is deeply indebted to the work and guidance of the lateGeorge F. Madaus, designer of the City Connects evaluation plan, and the late Thomas Kellaghan, one of its firstexternal reviewers. Finally, we thank the Lynch School of Education, Boston College, and all of our funders;their generous support of City Connects has allowed us to help thousands of students achieve and thrive.CURRENT FOUNDATION SUPPORTBarr FoundationThe Better Way FoundationCatholic Schools FoundationChildren’s Aid SocietyFireman Charitable FoundationGHR FoundationThe Charles Hayden FoundationThe Richard K. Lubin Family FoundationThe Ludcke FoundationThe Mathile Family FoundationThe Herman and Frieda L. Miller FoundationThe New Balance FoundationNew ProfitI. A. O’Shaughnessy FoundationAmelia Peabody FoundationThe Philanthropic InitiativeThe Sheehan Family FoundationStrategic Grant PartnersGOVERNMENT AND DISTRICT SUPPORTU.S. Department of Education, Institute of Education SciencesMassachusetts Department of Elementary and Secondary EducationBoston Public SchoolsBrockton Public SchoolsHartford Public SchoolsSalem Public SchoolsSpringfield Public Schools
Table of ContentsIntroduction. . . . . . . . . . . . . . . . . . . . . . . . . . . . . . . . . . . . . . . . . . . . . . . . . . . . . . . . . . . . . . . . . . . . . . . . . . . . . . . . . . . . . . . . . . . . . . . . . . . . . . . . . . . . . . . . . . . . . . . . . . . . 1The story of our growth. . . . . . . . . . . . . . . . . . . . . . . . . . . . . . . . . . . . . . . . . . . . . . . . . . . . . . . . . . . . . . . . . . . . . . . . . . . . . . . . . . . . . . . . . . . . . . . . . . . . . . . . . . . . . . . . 3Why City Connects?. . . . . . . . . . . . . . . . . . . . . . . . . . . . . . . . . . . . . . . . . . . . . . . . . . . . . . . . . . . . . . . . . . . . . . . . . . . . . . . . . . . . . . . . . . . . . . . . . . . . . . . . . . . . . . . . . . . . 5Model and implementation. . . . . . . . . . . . . . . . . . . . . . . . . . . . . . . . . . . . . . . . . . . . . . . . . . . . . . . . . . . . . . . . . . . . . . . . . . . . . . . . . . . . . . . . . . . . . . . . . . . . . . . . . . . 9Model. . . . . . . . . . . . . . . . . . . . . . . . . . . . . . . . . . . . . . . . . . . . . . . . . . . . . . . . . . . . . . . . . . . . . . . . . . . . . . . . . . . . . . . . . . . . . . . . . . . . . . . . . . . . . . . . . . . . . . . . . . . . . . . 9Context of implementation. . . . . . . . . . . . . . . . . . . . . . . . . . . . . . . . . . . . . . . . . . . . . . . . . . . . . . . . . . . . . . . . . . . . . . . . . . . . . . . . . . . . . . . . . . . . . . . . . . . . . . 11Reviews and services. . . . . . . . . . . . . . . . . . . . . . . . . . . . . . . . . . . . . . . . . . . . . . . . . . . . . . . . . . . . . . . . . . . . . . . . . . . . . . . . . . . . . . . . . . . . . . . . . . . . . . . . . . . . . 13Outcomes summary. . . . . . . . . . . . . . . . . . . . . . . . . . . . . . . . . . . . . . . . . . . . . . . . . . . . . . . . . . . . . . . . . . . . . . . . . . . . . . . . . . . . . . . . . . . . . . . . . . . . . . . . . . . . . . . . . . . 19Robustness across methods. . . . . . . . . . . . . . . . . . . . . . . . . . . . . . . . . . . . . . . . . . . . . . . . . . . . . . . . . . . . . . . . . . . . . . . . . . . . . . . . . . . . . . . . . . . . . . . . . . . . . 20Robustness across samples. . . . . . . . . . . . . . . . . . . . . . . . . . . . . . . . . . . . . . . . . . . . . . . . . . . . . . . . . . . . . . . . . . . . . . . . . . . . . . . . . . . . . . . . . . . . . . . . . . . . . . 21Robustness across sites. . . . . . . . . . . . . . . . . . . . . . . . . . . . . . . . . . . . . . . . . . . . . . . . . . . . . . . . . . . . . . . . . . . . . . . . . . . . . . . . . . . . . . . . . . . . . . . . . . . . . . . . . . 21Impact on schools. . . . . . . . . . . . . . . . . . . . . . . . . . . . . . . . . . . . . . . . . . . . . . . . . . . . . . . . . . . . . . . . . . . . . . . . . . . . . . . . . . . . . . . . . . . . . . . . . . . . . . . . . . . . . . . . . . . . . 23Principal satisfaction. . . . . . . . . . . . . . . . . . . . . . . . . . . . . . . . . . . . . . . . . . . . . . . . . . . . . . . . . . . . . . . . . . . . . . . . . . . . . . . . . . . . . . . . . . . . . . . . . . . . . . . . . . . . . 23Teacher satisfaction and impact on teaching. . . . . . . . . . . . . . . . . . . . . . . . . . . . . . . . . . . . . . . . . . . . . . . . . . . . . . . . . . . . . . . . . . . . . . . . . . . . . . . . . . 25Impact on community agencies. . . . . . . . . . . . . . . . . . . . . . . . . . . . . . . . . . . . . . . . . . . . . . . . . . . . . . . . . . . . . . . . . . . . . . . . . . . . . . . . . . . . . . . . . . . . . . . . . . . . . 29Conclusions. . . . . . . . . . . . . . . . . . . . . . . . . . . . . . . . . . . . . . . . . . . . . . . . . . . . . . . . . . . . . . . . . . . . . . . . . . . . . . . . . . . . . . . . . . . . . . . . . . . . . . . . . . . . . . . . . . . . . . . . . . . . 31City Connects: Intervention and Impact / Progress Report 2018
2018 Trustees of Boston College, Chestnut Hill, Massachusetts
IntroductionAcross America, children in high-poverty urban schools face out-of-school challenges thatimpede their success in the classroom and in life. In the 1960’s, the Coleman Report andothers concluded that socioeconomic background is a significant factor affecting students’academic achievement (Harrington, 1962; Coleman et al., 1966). Current research confirmsthat contexts beyond the school are critical, accounting for up to two-thirds of the variance instudent achievement (Phillips et al., 1998; Rothstein, 2010).The impact of poverty outside of school contributes to inequality in educational outcomes;in fact, Berliner (2013) has identified poverty as the single most critical factor to address ineducation reform. The achievement gap related to income has grown as the divide betweenthe income levels of rich and poor families has widened (Duncan & Murnane, 2011; Reardon,2011). Collectively, this work points to a straightforward conclusion: schools cannot close theachievement gap without a systemic approach to addressing out-of-school disadvantage (Bryk,Sebring, Allensworth, Luppescu, & Easton, 2010; Walsh & Murphy, 2003). Yet, as noted byCarter and Reardon (2014), while much research has been dedicated to documenting theconsequences of inequality, less has focused on what can be done to reduce inequality.City Connects emerged in response to the need for a systemic approach to addressing the outof-school factors that can impede a student’s ability to succeed and thrive in school (Walsh& Brabeck, 2006). Its mission is to help students—academically, socially, emotionally, andphysically—by connecting each and every child to a tailored set of prevention, interventionand enrichment services in the school and community. When a school implements CityConnects, effective student support becomes central to its mission and day-to-day operations.The array of services and enrichments in the urban community also become central tothe school’s role in supporting students and evidence becomes available for evaluatingeffectiveness.Starting more than fifteen years ago in a single Boston Public school, the partnership amongBoston College, school districts, and community agencies continues to grow. As the 2017-18school year began, City Connects was in 90 high-poverty urban public, Catholic, and charterschools across five states.Evidence demonstrates that being in a City Connects school makes a difference for students.In elementary school, students in City Connects schools significantly outperform their peerson report card scores in reading, writing, and math (Walsh et al., 2014) and standardized testscores in reading and math (City Connects, 2014). After leaving City Connects and movingon to middle school, students scored higher on statewide math and English language artstests than comparison peers who were never enrolled in a City Connects school (Walsh et al.,2014). Students previously enrolled in City Connects elementary schools later demonstratedlower rates of chronic absenteeism and dropped out of high school at about half the rate ofcomparison students (City Connects, 2014). The consistency of findings across methods,samples, and sites argues that City Connects is not merely associated with, but causes, thesebenefits for students (City Connects, 2016).City Connects: Intervention and Impact / Progress Report 20181
There is now growing national recognition that schools need interventions like City Connects—evidence-basedways to provide comprehensive supports to students in schools. The national nonprofit research firm Child Trendshas produced two reports on the evidence base for this work, which they term “integrated student support”(Moore et al., 2014, 2017). These reports concluded that broadly, the evidence for positive outcomes for students ispromising.With strong evidence that comprehensive student support benefits students, the next research frontier is to betterunderstand how. In October 2017, the Center for Optimized Student Support, which houses City Connects, hostedthe first national research conference on integrated student support. Researchers from across the country andbeyond the U.S. convened to review the evidence and set a research agenda. At the conference, a broad consensusemerged that researchers must now seek to understand more deeply how integrated student support works,including the relative importance of different elements and features of specific interventions and the influence of,and impact on, the context of implementation.In alignment with this call to research, we offer in this report an in-depth picture of the City Connects interventionand its implementation. We begin with the story of our growth and a rationale for City Connects. Next, we offercontext on our current sites of implementation, followed by a description of elements of the City Connects model,including reviews of student strengths and needs and connections to services in the school and community. Wepresent data illustrating the nature and scope of implementation of these elements of the intervention. We alsodescribe the impact that the intervention has on schools, as reported by teachers and principals, and communities,as reported by community partner agencies.2 2018 Trustees of Boston College, Chestnut Hill, Massachusetts
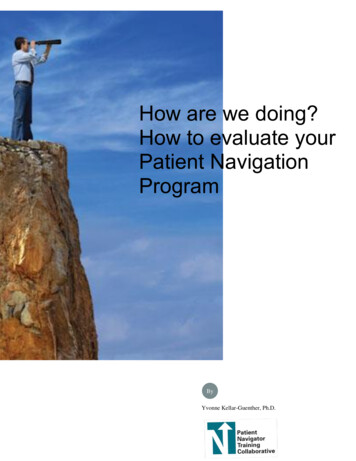
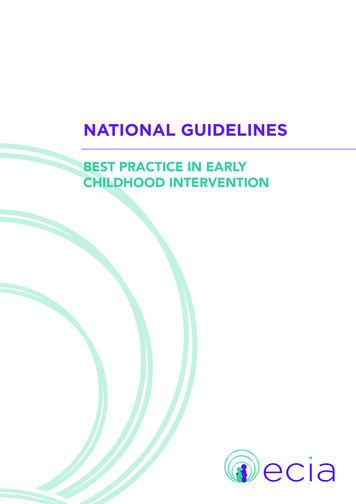
The story of our growthSTART UPThe partnership that led to City Connects began in the early 1990s. Researchers and leaders atBoston College, a Boston Public elementary school, and community agencies began to exploreways to address out-of-school factors that impact students’ success and thriving in school.The partners drew on best practices emerging at the time from research on student support.From 1999 to 2001, in an iterative process, they repeatedly convened school principals,teachers, other school and district staff, representatives of community agencies, and familiesto develop a practice that systematized the work traditionally done in schools by schoolcounselors, nurses, psychologists, community partners, and others. The resulting system,designed to permit measurement of outcomes, was initially implemented in Boston schools inthe 2001-02 academic year.REPLICATECity Connects has proved replicable. It expanded to a new area of the city in the 2007-08school year. It expanded to a distant site (Dayton, OH) and to urban Catholic schools inBoston in the 2008-09 academic year. Two years later, the success of City Connects led to theprogram’s launch in the “Turnaround” (consistently low-performing) schools in the BostonPublic district. City Connects also launched in public schools in Springfield, MA.At early stages of growth and replication, evidence of positive outcomes for students beganto accumulate. Over time, the evidence base has grown dramatically, demonstrating that CityConnects students outperform their peers in measures of academic achievement in elementaryschool. These benefits persist into middle school and high school (lower chronic absenteeism;lower likelihood of dropout).SCALEThe expanding evidence base has led more districts and states to seek out City Connects asa comprehensive approach to supporting all students. It has expanded to districts in NewYork City (in partnership with Children’s Aid Society); Springfield, OH; Brockton, MA;Minneapolis, MN; Hartford, CT; and Salem, MA. It is now implemented in 90 public, charter,and Catholic schools in five states, serving over 27,000 students. Anonymous surveys acrossthe network consistently indicate high levels of satisfaction among principals, teachers, andcommunity partners.City Connects is now recognized nationally as a comprehensive approach to student supportthat can be delivered at low cost and that yields significant, positive outcomes for children’sachievement and life chances.Figure 1 illustrates the growth and development of City Connects.City Connects: Intervention and Impact / Progress Report 20183
FIGURE 1. Timeline of City Connects’ expansion4 2018 Trustees of Boston College, Chestnut Hill, Massachusetts
Why City Connects?What happens outside of school can greatly impact what happens inside of school. Forstudents living in poverty, out-of-school factors can be pervasive and severe. Students andtheir families may struggle with hunger, housing, medical issues, or other needs. A lack oftime or resources may mean that needs remain unmet and connections that would benefit astudent or a family are not made.The City Connects approach to addressing these out-of-school factors is grounded indevelopmental science. Four core principles of effective practice emerging from thedevelopmental sciences have informed the development of City Connects and guide the workof addressing the out-of-school factors that impact achievement.COMPREHENSIVEChildren develop across biological, psychological, and social domains (Bronfrenbrenner& Morris, 2006; Ford & Lerner, 1992). Each domain is simultaneously impacting each ofthe other domains (Rutter, 2007). For this reason, student support must take differentdevelopmental domains into account. At the same time, children’s needs span a continuum ofintensity, from mild to severe. Therefore, student support must be offered at various levels ofintensity: prevention, early intervention, and intensive/crisis intervention (Adelman & Taylor,2006).CUSTOMIZEDChild development is dynamic and complex, and each child experiences a unique interactionbetween personal characteristics and environment (Cicchetti & Sroufe, 2000). As a result,no two children’s experiences or developmental trajectories are identical (Sameroff, 2009).Also, developmental science points to the value of addressing children’s strengths in additionto their needs, creating conditions for resilience (Masten & Tellgen, 2012). Thus, to beeffective, student support practices must take into account and tailor approaches based on theindividual strengths and needs of every student in a school.COORDINATEDDevelopmental science points out the mutually influential relationships among a child andhis or her home, school, and neighborhood (Bronfenbrenner & Morris, 2006). Aligningefforts across these contexts is especially important for children at economic disadvantage(Dearing et al., 2016; Garcıa Coll et al., 1996). For example, given the critical role of familiesin children’s development, it is important that student support plans be coordinated withfamily collaboration. Also, effective student support involves an assessment of strengths andneeds with teacher input. To provide the full array of supports students need, schools shouldleverage the work of providers and resources from the community (Brabeck & Walsh, 2003;D’Agostino, 2013). Coordination requires communication and systems for aligning the effortsof these people and groups.City Connects: Intervention and Impact / Progress Report 20185
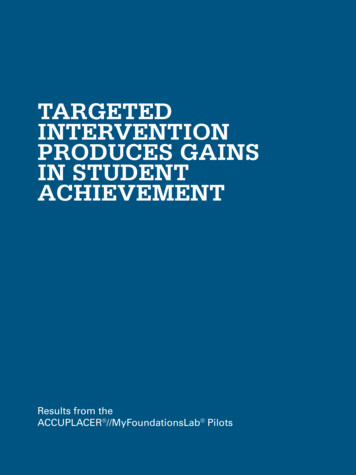
CONTINUOUSDevelopmental science suggests that continuity of care in a safe, predictable, and stable environment positivelyimpacts development (Waters, Weinfield, & Hamilton, 2000). Implementation of student support should promotethis continuity and stability. Further, connecting students to the supports that best match their evolving strengthsand needs is an iterative process because development is dynamic and changes over time. For example, earlychildhood experiences affect what happens in elementary school and beyond (Shonkoff & Phillips, 2000). As aresult, children may need varying levels of support across the continuum of their development.City Connects operationalizes these principles in its specific model for student support. As a comprehensiveapproach, City Connects considers the overlapping impact of four developmental domains—academic, social/emotional, health, and family—on children’s readiness to learn and thrive in school. See Figure 2.FIGURE 2. The interaction of children’s developmental s and services are identified in all of these areas at the levels of prevention/enrichment, early intervention,or intensive intervention.The City Connects practice considers both strengths and needs of every student in a school across these domains,and connects each to services at appropriate levels of intensity in a customized way. The practice ensures that eachand every child in a school is considered individually to find the unique combination of supports and services thatwill help that child to thrive.Customization also occurs at the level of the school. Research indicates that the climate and overall socialconditions of schools have consequences for academic development (Berkowitz et al., 2017; Thapa et al., 2013).To widen opportunities for enrichment, for prevention purposes, and also in cases when a need becomes evidentwithin or across entire grade levels, supports are brought into the school to serve large numbers of students.City Connects is coordinated, structurally linking districts and schools with community partners to make availablethe full array of supports and services students may need, as shown in Figure 3.6 2018 Trustees of Boston College, Chestnut Hill, Massachusetts
FIGURE 3. The City Connects partnershipDistricts geThis partnership includes structures to enable coordination. For example, core processes ensure teacher input ina review of strengths and needs of every child, close collaboration with families in developing and carrying outindividual support plans, and regular communication with community agencies providing services.Finally, to ensure that student support is continuous, City Connects developed a practice in which the individualstrengths and needs of every student are reviewed every year, and in which a secure, proprietary database makes iteasy to follow up on each student’s service referrals and progress throughout the school year and across years.City Connects: Intervention and Impact / Progress Report 20187
8 2018 Trustees of Boston College, Chestnut Hill, Massachusetts
Model and implementationModelThe City Connects approach for collaborating with a school district to implement its modelis grounded in the literature on implementation science informing sustainable interventions(Foley et al., 2015). Before implementation, a steering committee is formed, typically in thespring, with representation from both City Connects and the district. The committee engagesin several stages of planning. First, City Connects works with the district to conduct a needsassessment, seeking the input of principals, teachers, families, students, and communityagencies to understand current strengths and needs in the area of student support. Anenvironmental scan identifies a range of agencies and resources in the community. Next,City Connects reports findings to the district and, if the district decides to move forward withimplementation, provides infrastructure and supports, including materials for recruiting andhiring, and an orientation process for principals. This process enables a shared vision forsuccess and alignment of priorities.Following this planning process, implementation is launched, typically at the start of anacademic year. There are five key components of the implementation model:1. CITY CONNECTS COORDINATORAt the core of the intervention is a City Connects Coordinator in each school, trained asa school counselor or school social worker, who connects students to a customized setof services through collaboration with families, teachers, school staff, and communityagencies. The Coordinator follows standardized practices codified in the City ConnectsPractice Manual, as shown in Figure 1 and detailed in the components below.In some districts, the Coordinator is a new position created in the school, and in others,an existing position, such as a school counselor role, is redefined to include responsibilityfor implementing the City Connects model. Depending on the size of the school, twoCoordinators may be hired. Typically, there is one Coordinator for every 400 students inthe school.2. WHOLE CLASS REVIEWThe Coordinator works with each classroom teacher to review each and every student inthe class and develop customized support plans that addresses their individual strengthsand needs. There are five aspects of the Whole Class Review (WCR):1. Identifying the strengths and needs of each student across four domains (academic,social/emotional/behavioral, health, and family)2. Identifying and locating appropriate school- and/or community-based services andenrichments3. Establishing the connection between these service providers and individual childrenand their familiesCity Connects: Intervention and Impact / Progress Report 20189
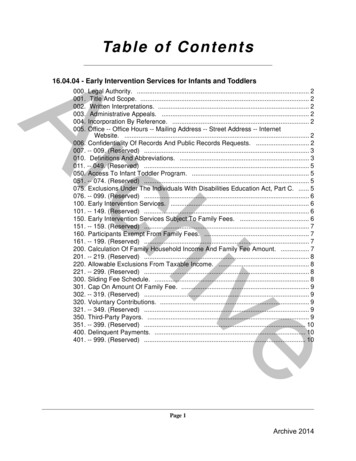
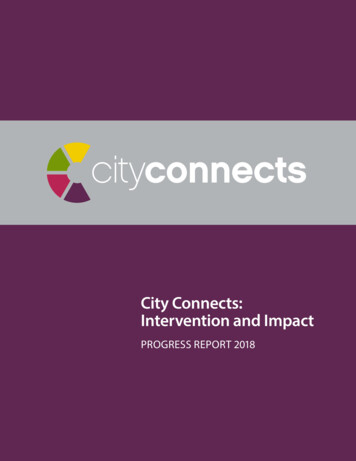
4. Documenting and tracking the delivery of services5. Following up to ensure appropriateness of fitAs they conduct the WCR, at the most general level, the teacher and Coordinator group the students in a classinto three tiers: strengths and minimal risk (Tier 1); strengths and mild (Tier 2a) to moderate (Tier 2b) risk; orstrengths and severe risk (Tier 3).3. INDIVIDUAL STUDENT REVIEWStudents identified as having intensive needs, at any point during the school year, receive an Individual StudentReview (ISR). A wider team of professionals discuss and develop specific measureable goals and strategies forthe student. The ISR is conducted by the student support team—an existing school structure that can includeschool psychologists, teachers, principals, nurses, and occasionally community agency staff members—thatis typically led by the Coordinator. The Coordinator communicates with the family before and after the ISR.Typically, 8% to 10% of the students in a school receive an ISR in a given year.4. COMMUNITY AGENCY PARTNERSHIPSA critical aspect of the Coordinator’s role is developing and maintaining partnerships with community agenciesand institutions. These relationships are vital to providing all students with the supports and enrichmentsthey need to thrive. In 2016-17, over 212,000 services were delivered by more than 1,100 different communitypartners.5. CONNECTING STUDENTS TO SERVICES, TRACKING, AND FOLLOWING UPDuring and after these conversations with teachers, school staff and leaders, and community agencyrepresentatives, City Connects Coordinators connect each student to the particular enrichment and serviceprograms that will best meet his or her strengths and needs. Coordinators work closely with families asstudents are referred and connected to particular enrichments and services.To aid with the process, and to permit streamlined tracking and follow-up, City Connects has developed aproprietary web-based database, the Student Support Information System (SSIS). SSIS allows for securecollection of data on student reviews, individual student plans, service referrals, and providers (both schoolbased and community agencies) who deliver services. The database systematizes the work of referring studentsto services, contributing to efficiency and helping to enable one Coordinator to serve 400 students. SSIS dataare used for three purposes: 1) record-keeping at the individual and school level; 2) monitoring and evaluatingthe implementation of the intervention throughout the school year; and 3) conducting research on theeffectiveness of the intervention.Services can be classified into three broad categories: prevention and enrichment, early intervention, andintensive/crisis intervention. Each category includes services of different types. The tailoring of servicesis accomplished through different combinations of quantity and type of services from these three broadcategories, resulting in a unique set of services for each student.10 2018 Trustees of Boston College, Chestnut Hill, Massachusetts
Figure 4 provides a visual overview of the core work of the City Connects Coordinator within the context of theschool and community.FIGURE 4. The City Connects core practiceREVIEW OF EVERY STUDENTWITH THEIR TEACHERFAMILIESTAILORED SUPPORT PLANFOR EVERY STUDENTFACKDBEEINDIVIDUAL STUDENTREVIEWUPPROPOSEDPLAN & TIEROF OLLWCOMMUNITYPARTNERSContext of implementationCity Connects was implemented in 84 schools in five states across 10 school districts (totaling 29,936 students) inthe 2016-17 school year. Seven of the 10 school districts were public school districts and three were Catholic schooldistricts. Schools served students ranging from pre-kindergarten through grade 12, with a majority of schoolsserving students in kindergarten through eighth grades. Table 1 presents a summary of pre-kindergarten throughgrade 12 student characteristics for each school district as well as an average across all City Connects schools.The information on student demographics presented in Table 1 highlights the significant academic and financialneeds that students in City Connects schools experience. In City Connects schools, 85% of the population includesminority students; almost half of the student population identify as Hispanic and a quarter identify as Black. Thereare differences across districts in student race/ethnicity, highlighting the varied contexts in which City Connects isimplemented. For example, compared to the overall City Connects sample, Ohio Public Schools serve significantlymore Black students; New York City and Hartford Public Schools serve significantly greater numbers of Hispanicstudents; and Boston Public Schools serve the greatest number of Asian students. City Connects Catholic schoolsare more likely than public schools to serve White students.City Connects: Intervention and Impact / Progress Report 201811
TABLE 1. City Connects student demographic characteristics from the 2016-17 school year, grades lyokePublicHartfordPublicNew YorkCity holicCityConnectsNumber of 2929,936Number of Schools201512892144984% .7%*50.1%*48.4%% English NA27.2%*27.5%% 9%82.7%76.0%NANA77%*NA1% Special 0%22.2%*10.5%*10.4%*6.0%% Race/EthnicitySource: State education department websites (profiles.doe.mass.edu; on-tool; https://tools.nycenet.edu/dashboard/; reportcard.education.ohio.gov) unless otherwise indicated by **City Connects SSIS database or other dataNA: Data not available.¹Definition of economic disadvantage varies across sites (State-specific Economic Disadvantage definition: Boston, Springfield, Brockton, Holyoke, Ohio, New York City; Eligibility for Freeor Reduced-Price Lunch: Hartford, Boston Catholic, Ohio Catholic, Minneapolis Catholic). Aggregate City Connects total cannot accurately be computed.Generally, more than a quarter of students in City Connects schools are English Language Learners and about 20%of students receive special education services. Further, at least two-thirds of students in City Connects schools areeconomically disadvantaged. It is important to note that this measure differs across school districts, and the statespecific definitions have a higher income threshold to qualify as being in economic need than the traditional metricof eligibility for free or reduced-price lunch—and thus, fewer students are classified as experiencing economicdisadvantage. Turning to differences in City Connects schools across districts, Boston public schools serve thelargest number of English Language Learners, more than a third of their student population. Further, Ohio publicschools serve significantly fewer special education students compared to the other districts. New York, Hartfordand Springfield have the highest rate of economic disa
City Connects: Intervention and Impact Progress Report 2018 5 Why City Connects? What happens outside of school can greatly impact what happens inside of school. For students living in poverty, out-of-school factors can be pervasive and severe. Students and their families may struggle with hunger, housing, medical issues, or other needs. A lack of