Transcription
How are we doing?How to evaluate yourPatient NavigationProgramByYvonne Kellar-Guenther, Ph.D.
TABLE OF CONTENTSHow to use this toolkit . 1Set your goals . 2Types of goals . 3Tools to use in planning – Setting goals, identifying what will be measured . 1Moving from goals to action steps . 3Identifying your first step . 3Tools to use in planning – the 5 Whys . 7SMART action steps to address the Whys . 8Types of change you may want to conquer . 8Tools to use in identifying objectives . 9Writing smart action steps . 10Tools to Use – Writing SMART Objectives/Action Steps . 11SMART Objective checklist . 12Data Collection . 13Identifying what to collect . 13Tools to use – To identify what data you need to collect . 16Tools to sse – For data analysis . 20Descriptive data analysis. 23References . 311
HOW TO USE THIS TOOLKITThis toolkit is designed for Patient Navigation program managers who have little to no experiencewith evaluation. The purpose of the toolkit is to help identify goals, identify what measures can betracked to help determine if goals are being met, creating data collection tools, and some basicdescriptive analysis.This toolkit does NOT tell give instruction on how to conduct statistical data analysis nor how tocreate a program logic model. Both of these are important but there are many tools out there onhow to create logic models. For data analysis, there are classes on statistical techniques. The dataanalysis discussed here can help identify if participants saw a change and how many, it cannotidentify if the change was statistically significant or that the change only happened due to theprogram.SET YOUR GOALSEvaluation serves as a road map for your project. You need to know what you hope to achieve atthe end of your grant period and the stops along the way that show you are on the right path.Evaluation helps you do that.Goals come in different sizes and different time periods. There are larger goals such as wanting toimprove the health of a specific population. This can take many years until an effect is seen. Forproject goals, think about the time you have to complete a project and what can really happenduring that time frame. Some examples of project goals include; 2“Our goal is to reduce barriers to care and connect patients to needed resources.”“Our goal is to decrease cardiovascular risk factors by helping patients adopt behavioralchanges.”“Our goal is to improve screening among the underserved population.”
TYPES OF GOALSThere are two types of goals – process goals and impact (or outcome) goals.Process goals are focused on getting pieces in place to deliver the program or intervention anddelivering the program or intervention.Impact is what happens as a result of the person being part of your intervention or program.One of the roles of Patient Navigation is to remove barriers to care. This can result in thefollowing types of goals:Sample PN Process Goals (getting pieces in place to deliver the program) Reduce barriers to care by identifying the type of barriers our patients face to getting medicalcareo Practical (e.g. child care, transportation)o Emotional (e.g. depression, fear) Identify the gaps or unmet needs in services for our clients Understand our patients’ satisfaction with services and how we can improve our careSample Impact Goals (what we want to change as the result of having the program) Decrease risk of disease/Increase adoption of health behaviorsDecrease the number of patients who do not show for appointments or who are unprepared fora screeningIncrease the number of Latino women without insurance who are screened for breast cancerevery year.ft with your group so that you can identifyur goal and what you should measure.3
TOOLS TO USE IN PLANNING – SETTING GOALS, IDENTIFYING WHAT WILL BEMEASUREDGroup Charge and Membership (revisit this document at each phase)1. What do you hope to accomplish as a result of working together? What do you want to be ableto tell others your group got done? (This is your goal. You may have more than one. Decidehow many you can do given your resources and time.)a) To help with this think through the following two questions: Who do you need to buy-into this program to help us keep it going? What will they want to see?b) Now write out your goal:c) Look at your goal statement. Can outsiders tell which group or groups you are targeting?If not, re-write the goal statement here making it clear what group is being targeted.1
2. How will you know you achieved the goal? What will you see that is different or what willyou no longer see? Or if you are wildly successful, what will be different, what will it looklike? (this will help you know what you need to measure in your evaluation)3. Why is this important? What is the benefit of getting this done? OR Why does this matter?How does this program make a difference with the group you want to serve?4. Who are the stakeholders for this project? Who has something to gain or lose based onthe outcome (or lack of outcome) of this project? This group is important because yourevaluation can affect them. Consider asking them if there is information they need from yourevaluation. You may also be getting data from this group.Try to keep your stakeholders in mind throughout your entire evaluation. Better yet, see if youcan include some of them in all the different phases!2
MOVING FROM GOALS TO ACTION STEPSYour goal is the end point or destination but you still need to identify mile markers along your pathto know you are making progress. You also need to be able to think through what action stepsneed to happen to help keep your project moving.You will use this phase to help write your problem statement for your project (or potential funder).IDENTIFYING YOUR FIRST STEPAfter you set your goal, identify the problem that has led to the issue you are trying to address.For example, if there is a group that is not getting screened, what do you already know about whythat group is or is not getting screened? You can use literature like journal articles, health behaviortheories like the Transtheoretical Model, or your experiences and what you have heard from yourpatient/client group.There are many tools to help think through this – brainstorming, flowcharting, Fishbone Diagrams,and the 5 Whys.The next section reviews how to use the 5 Whys approach. The following videos explain how touse this approach.5 Whys (MindTools.com)5 Whys: Root Cause AnalysisThe 5 Whys (Harvard Business Review)3
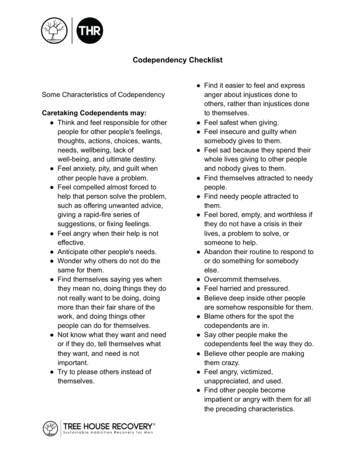
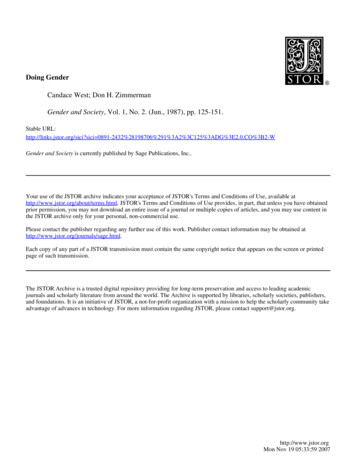
Basically, your group starts with what you are seeing and then begins to ask why. For example,“Our clinic has a large group of African American women who are at-risk for type 2 diabetes.”Why? Because these women are overweight or obese based on BMI. Why? Because of their diet.Why? Their cultural foods include high fatty foods.Only 3 whys were identified here but, using this information, you might choose to deliver aneducational program aimed at preparing cultural foods differently.Often what happens is that your “whys” take you down many different paths.Here is an example of a series of “Whys” for a person.4
As you can see in the example, there are two main reasons for the weight gain. One piece can bechosen to focus on, the orange path, or a program or intervention can be used that addresses botheating and lack of movement. Just make sure EVERY piece that you are hoping to change ismeasured.Now let’s see how this would look for a group of people.Problem Statement: There is a high rate of STIs among teenagers in X Public Schools1st Why: Teenagers are having unprotected sex2nd Why: teenagers aren’t accessing free condoms3rd Why: teenagers aren’t aware they can get free condoms4th Why: condoms aren’t being distributed to teenagers5th Why: School system doesn’t allow condoms to be handed outProblem Statement: There is a low rate of exclusive breastfeeding among low SES women in X.1st Why: Women supplementing breastfeeding with formula2nd Why: Women are experiencing challenges with breastfeeding3rd Why: Women do not know how to resolve breastfeeding challenges4th Why: Women are not getting the support from their family physicians on how toovercome breastfeeding challenges5th Why: Physicians are not trained on how to manage breastfeeding challenges5
As you fill out your 5 whys sheets, try to do one for each path. Similarly to the example above,you could end up with 4 sheets. Below are some general types of causes that might help youdevelop the 5 whys for your program.Types of Causes– Physical causes – Tangible, material items failed in some way (for example, aperson does not have transportation so he/she cannot get to a gym).– Human causes – People did something wrong, or did not do something that wasneeded. Human causes typically lead to physical causes (for example, chocolate in aperson’s house).– Organizational causes – A system, process, or policy that people use to makedecisions or do their work is faulty (for example, she has a desk job so it is hard tomove during the working day).6
Print off this page and fill this out with your group so that you can identify your goal and what youshould measure.TOOLS TO USE IN PLANNING – THE 5 WHYSProblem Statement:Why is that?1st WhyWhy is that?2nd WhyWhy is that?rd3 WhyWhy is that?4th Why5th Why7
SMART ACTION STEPS TO ADDRESS THE WHYSOnce you have identified what your program will address, you need to identify those smaller stepsto take in moving towards your goal. You can think of these like places to stop on your journey (for example, we stop in Phoenixfor the night) or like inches on your yard stick (this small step helps us move towards thewhole yard).TYPES OF CHANGE YOU MAY WANT TO CONQUERThe Institute for Healthcare Improvement identified the following lists of changes healthcareprograms may want to conquer.8 Eliminate Waste: Eliminate an activity or resource that is non-value added to an externalcustomer. Improve Work Flow: Improve processes to improve the products/services. Optimize Inventory: Understand where inventory is stored in a system to findimprovement opportunities. Change the Work Environment: Can be a high-leverage opportunity to make all otherprocess changes more effective. Producer/Customer Interface: To benefit from improvements in quality of products andservices, the customer must recognize and appreciate the improvements. Manage Time: Gain advantage by reducing time to develop new products, waiting timesfor services, lead times, and cycle times for all functions in the organization. Focus on Variation: Reduce variation to improve outcome predictability and to helpreduce the frequency of poor results. Error Proofing: Redesign the system to make it less likely for people in the system tomake errors. Focus on the Product orproducts and services, notService: Address improvement ofjust processes.Your team may want to use thesesmaller goals you are trying toaccomplishing your larger goal.to as objectives and/or aimto identify your sub-goals or thereach on the way toThese sub-goals are often referredstatements.
Print off this page and fill this out with your group so that you can identify the smallersteps/markers you will achieve on your way to achieving your larger goal.TOOLS TO USE IN IDENTIFYING OBJECTIVES1. At the end of the project you would like to see*:a. The benefit of achieving this goal is:*You did this on the Group Charge page.2.To achieve this you need to (objectives or aims that fit with what you learned when doing the 5Whys):a)b)c)For example, if my goal is to lose 10 pounds in 2 months, my objectives or aims might be:a. To get a baseline – how much do I weigh right now? What am I eating? How manysteps do I take in a day?b. To increase my steps by 250 each day until I am at 10,000 steps a day.c. To decrease my calories so I eat no more than 1,500 calories per day.For example, if the program goal is to increase breastfeeding among low SES women in X city, myobjectives or aims might be:a. To get a baseline about the perceived knowledge of physicians on handlingbreastfeeding challengesb. To increase physician knowledge of handling breastfeeding challengesThese become the objectives or aim statements.Do a gut check. Based on what you know from the literature, your theory, or your experience, willthese things really move you towards you larger goal? If yes, keep going.9
Tip: If you have more than 3 aim statements, look at your list. Choose the 3 that you have themost control over, tap into the experience/expertise of your team, and/or are most likely to lead toquick successes.WRITINGACTIONSMARTSTEPSSMART is an acronym to help you ensure you are clearly explaining WHO is going to do WHAT,WHEN, WHY (what does it demonstrate) and TO WHAT STANDARD. The reasons to writeSMART objectives or action steps is to: think through your plan,understand how one part of the plan influences another partidentify steps that need to happen prior to and after other stepsidentify who is ultimately responsible for this getting done (accountability)The table below helps explain each part of SMART.SMARTSpecificQuestions to ask to make sure your objective/action step has these:Does each step clearly and specifically state what you are trying to achieve? Who willdo what?Measurable How will you (and others) know if progress is being made on achieving this step?AttainableIs achieving this step dependent on anyone else? Is it possible to reframe your stepOrthat it only depends on you and not others? Is it feasible to complete within the givenAchievable time? What factors may prevent you from achieving your goal?RelevantWhy is achieving this step important towards achieving the larger goal?Time-bound Does something need to happen before you start? If so, when will it be done so youcan start? When will you end this action step by? Do you need to finish this actionstep before you can start another action step?Here are some web sites you can visit for more SMART examples:CDC: Writing SMART ObjectivesUniversity of Virginia: Writing SMART Goals10
TOOLS TO USE – WRITING SMART OBJECTIVES/ACTION STEPSAction Plan – What steps must you take to achieve this aim?Task/to-do itemWho in What has to be donecharge? before you start?What resourceshave?What resourcesneed?Date Start DateEndObstacles/Challenges – What obstacles stand in the way of you achieving your goal?ObstacleHow will you address the challenges if/when they arise?
SMART OBJECTIVE CHECKLIST ifyesWe have a step were we get baseline data OR we already have the baseline data.Our activities do not all start on day 1 and end when the grant ends.It is clear which activities have to happen before others can begin.We left time to analyze our data.We left time to write our report.We can explain how each step moves us towards our larger goal.In each step, it is clear who will be responsible for overseeing this step (either a name or therole)
DATA COLLECTIONBefore you start providing services, make sure you can gather data to show what you have done.Your first step is identifying what data you will need to show progress on your aims and goals.You can gather data in many ways including: Using data you already have to treat the patientso Age, type of insurance, weight, height, A1C, smoking status, blood pressure, dates ofservices/screenings Directly from patients by asking themo Barriers to getting care Directly from patients where they fill something outo Questionnaireso Sign-in sheets at a program (name, contact info, demographics you may need like race,age, zip code). Remember to always include the date of the program and the topic.IDENTIFYING WHAT TO COLLECTThere are several ways to think about what data you need. One way to is to write down your subgoals and aims and think about what data you need to have to show that you have reached this goal.For example, using one of the goals from an earlier section: “Deliver a 6-week Diabetes Craft Plusprogram to 100 African American Women who are classified as ‘overweight’ based on their BMI.”To demonstrate you did this, you will need to track:o Race/ethnicity of everyone who came through the program.o Gender of everyone who came through the program.o How many sessions each participant attended. (What if you had 100 women but only 20did all 6 weeks? Did you meet your goal? You might also need to a new action step andfind out why it is so hard to make it to all 6 weeks. This could help you refine yourprogram and how it is delivered).o You need beginning BMI (height and weight to calculate it).o You may need the last BMI if you are hoping to show a change but you need to decide ifyou can really decrease BMI in 6 weeks. (You may want to monitor weight change overtime in case BMI doesn’t change.)13
What if your goal for the 100 African American Women who attended all 6 weeks of the CraftPlus program was to report that they have the skills to make healthier traditional dishes? Todemonstrate this achievement you will need to track:o Race/ethnicity of everyone who came through the program.o Gender of everyone who came through the program.o How many sessions each participant attended. You only want to include those whoattended all 6 weeks in your analysis.o A way to measure their confidence that they can make these traditional meals “healthier.”o This can be a survey or set of questions that ask them how confident they aremaking these meals with less fat.o It could be asking them to take a traditional recipe and show where they mightmake changes to make the meal healthier.o If you wanted to show a change or improvement you could get data from the first class andthen again at the last but you need a way to match these responses (a name, an ID number)or you can ask them if they think they know more.o Comparing the first class to the lasts class is more objective while asking them ifthey think they changed is more subjective.o What you need really depends on what you, and your stakeholders, including yourfunder, want.Here are some questions you need to answer as a group to help you think through what datayou need to collect: What information is important to collect?– Are trends or patterns by groups like ethnicity, race, type of health condition,socioeconomic status important to know? If yes, make sure you have that datacollected. Why is this data element important?– Will it be used to show that the program is working?– Will it be used to make changes to how the program is delivered?– What data goes with each sub goal, aim, or SMART objective?14 Who will collect the data? Does this data already exist somewhere else? Where will data be collected? When will data be collected?
List of Sample PN Process Goals &Measures Dates of contact between PN and patient Types of barriers for getting medical careaddressed:o Practical (e.g. child care,transportation)o Emotional (e.g. depression, fear) Types of barriers for getting medical careclients experience Date of hand-off # of referrals given & # of successfulreferrals Role/type of provider connected patientwith Date connected patient with medicalhome Patient’s satisfaction with services Type of contact (e.g. phone, face-to-face) Duration of time spent with the patient Type of screening conducted for patients Date of screening # of clients reached (by week, month,year)List of Sample Reach Measures for PNPrograms Age or date of birth of patient Race/ethnicity Zip code Insurance type/insured Disease typeList of Sample Impact Goals Health indicator at beginning of projectand while getting services (A1C, weight,BMI, smoking status, etc.) Number of patients that hadrecommended diagnostic follow-upwithin (time period like 30 days, 60days, 90 days)Number of patients that did notreceive recommended diagnosticfollow-up within xx daysNumber of patients who initiatedtreatment within xx daysNumber of patients that did notinitiate treatment within xx days.Number of patients who fullyunderstand their treatmentrecommendation.Number of patients adhering totreatment recommendationsNumber of patients who received asurvivorship care planNumber who were prepared for theirmedical appointment (e.g. bowelprep)Number who missed medicalappointmentsNumber of patients who reportpositive change in health behavior(e.g. smoking less)
TOOLS TO USE – TO IDENTIFY WHAT DATA YOU NEED TO COLLECTMeasurement Planning Form - ExplainedMeasure – what do What are you trying to learn about? What will this data help you figure out?you want to seeTypeOutcome (Impact)ProcessWhy is thisWhat will this tell you? Are you looking to see if your program does something specific like helping losemeasure needed in weight? Are you trying to identify patient barriers so you can make changes to an existing program?our project?OperationalDefinitionHow will you know it when you see it? If you are looking for a percent to do something, what is yourdenominator (total group)? Do you have that number?ExclusionsWho is not included in this data? Would you exclude males, people who didn’t complete the program, etc. . .UsefulDo you want to compare those from one age group to another? Do you want to look at men vs women? ThoseStratifiers/Ways to in one program to those in another? The group one PN worked with vs a group another PN worked with?look at the dataData Collection & Where is the data from? Are you pulling it from medical records or do you need to collect it yourself? If youSampling Method need to collect it is it at the beginning of a class, a phone call, when the session is over? How will you collectthe data- a questionnaire, questions you ask (like zip code), etc?Display/VisualWill you make a crosstab table (gender by how many in each group lost weight)? A bar chart? A run chart?Goal/how muchHow much change do you need to see? Is dropping a pound at any point in the program enough or do you want
changea certain percentage of body weight lost? Do I need to smoke one less cigarette or have stopped smoking for 3months?Source (may notneed)If you are looking at another study to help you think through what you would expect to see, cite that here.Measurement Planning Form for Example MeasureMeasurePercent of attendees who report they understand what is needed to make traditional foods healthy traditionalfoods.Typex OutcomeProcessWhy is thisThe participants in this project need to report how confident they feel about making a health.measure needed inour project?OperationalDefinitionNumerator: Each week the number of program participants who report they feel very confident theyunderstand how to take a traditional dish and make it healthier.(how will I know Denominator: The number of program participants. Multiply the ratio by 100 to convert to percent.it when I see it?) (numerator/denominator) * 100 %ExclusionsNoneUsefulNumber of classes attended thus far; Age of participant.Stratifiers/Ways tolook at the data17
Data Collection & Each week send out an online survey asking participants 2 questions: (1) to rate their level of confidence inSampling Method altering a recipe of a traditional dish so that it is healthy and (2) to rate their confidence in cooking that dish.Participants can choose “not at all confident”, “somewhat confident”, “confident” or “highly confident”.Participants would need to enter their code so that the staff can determine how many classes that participant hasattended and the gender. The participant numbers, dates of classes attended, gender, age, weight, and A1c willbe stored in the StudyData.xls on the e: drive.How show thedata?Create an Excel spreadsheet that tracks the numbers each week so that a chart can be made showing the riseand fall of the percentage each week.GoalAt least 70% of the participants rate themselves as highly confident or confident in their ability to alter a recipeof a traditional dish so that it is healthy and at least 70% of the participants rate themselves as highly confidentor confident in their confidence in cooking that dishSourceReference: Optimizing Patient Flow: Moving Patients Smoothly Through Acute Care Settings. IHI InnovationSeries white paper. Boston: Institute for Healthcare Improvement; 2003.Measurement Planning Form – Template for you to useMeasure – whatdo you want to seeTypeWhy is thismeasure needed inour project?18Outcome (Impact)Process
ays tolook at the dataData Collection &Sampling MethodDisplayGoal/how muchchangeSource (may notneed)19
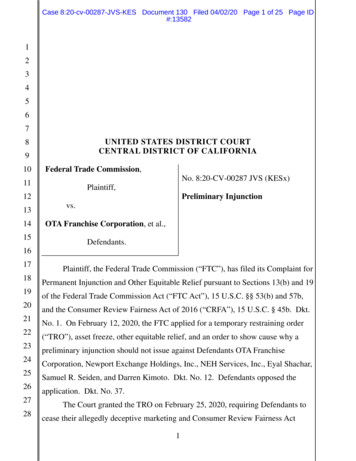
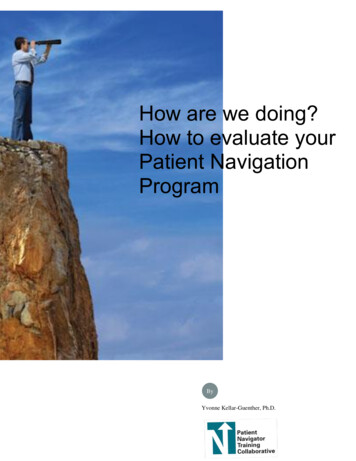
TOOLS TO USE – FOR DATA ANALYSISTo give you an idea of how to collect and store data for analysis, here is an excel spreadsheet CEPEG (the Community andEpidemiology Program Evaluation Group) used to gather and compare data across 15 PN and CHW programs. This excelspreadsheet had 66 columns per line. What you see below is all the data fields.
21
Things to note:o For the project the decision was made to get the number of people served in each zip code rather than by person. This wasbecause the zip code is a HIPAA identifier if area is not heavily populated.o We asked for age rather than date of birth because date of birth is a HIPAA identifier. It is better to get date of birth if thatis allowed.22
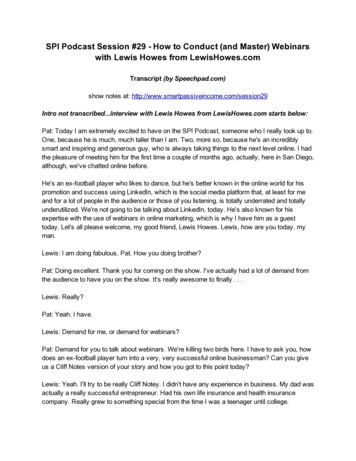
DESCRIPTIVE DATA ANALYSISThere are two types of statistics—descriptive statistics and inferential statistics. Descriptive statistics are used to describe the group data was collected from and show andsummarize your data so that you can see the patterns. You might be able to see that therewas a change from time 1 to time 2 but you CAN NOT tell if that change was statisticallysignificant.To claim a “significant difference” you would need to use inferential statistics.A lot goes into choosing which inferential statistics to use and there are specialized programs torun these statistics. If you really want to say your program made a statistically significantdifference, it is strongly recommended that you hire someone to do this for you.Be sure to include that person in the goal setting discussion. He/she will help you design your datacollection tools so that your group has the data you need to run that appropriate statistics.This section is devoted to descriptive statistics which can be easily calculated using a spreadsheetor even by hand.There are different types of descriptive statistics. First, you can report a frequency andpercentage for each group. Sticking with the Diabetes in African American women example, youmay choose to report how many women in each racial/ethnic group participated. You might gowith the racial/ethnic categories that the federal government uses for the census but, you wouldprobably be better off if you had racial/ethnic categories that fit your group (e.g. African born,American born, or you if you have a large immigrant population you might have Ethiopian,Kenyan, etc.) A report out with the federal government race categories might look like this:Frequency the number in the group, often shown as ‘n’.In the example below, the total number in the group is 23, or n 23.Percentage # in group/total #, then multiply by 100In the example below, for African American race the % in the group is 26% (6/23 0.26, times100 26%)RaceAfrican American – non-HispanicAsian or Pacific Islander – non-HispanicHispanicNative American, American Indian, or Alaskan Native – non-HispanicN 236120% of total26%4%9%0%
White – non-HispanicOther – mixedMissing122052%9%You may notice that missing is included. You will most likely have missing data and that is okay.One reason you may want to report on missing data is because people like the totals to add up andif there is a lot of missing data, it is helpful for the reader to be aware of that so they can interpretthe data better.If it has been awhile since you had math: Calculate a percent by dividing the number in your group by the total number you servedwhich in this example is 23, then multiply that number by 100 to obtain the percentage.When looking at the table above you may notice that what this data does is describe who wasserved. This is important. If your program is targeting African-Ame
3 TYPES OF GOALS There are two types of goals - process goals and impact (or outcome) goals. Process goals are focused on getting pieces in place to deliver the program or intervention and delivering the program or intervention. Impact is what happens as a result of the person being part of your intervention or program. One of the roles of Patient Navigation is to remove barriers to care.