Transcription
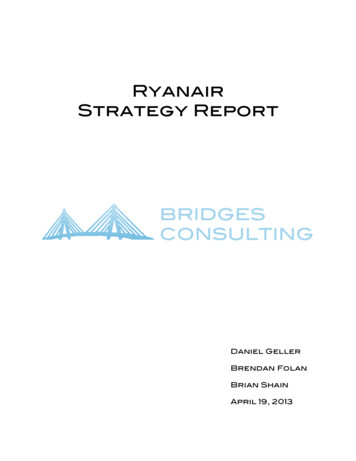
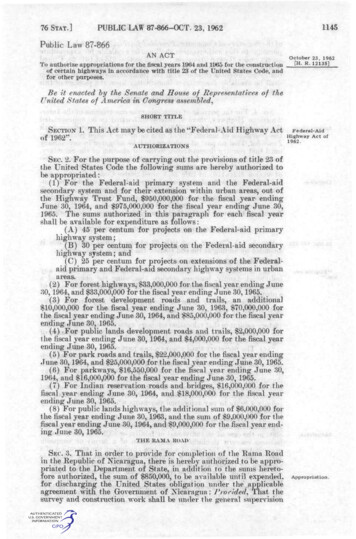
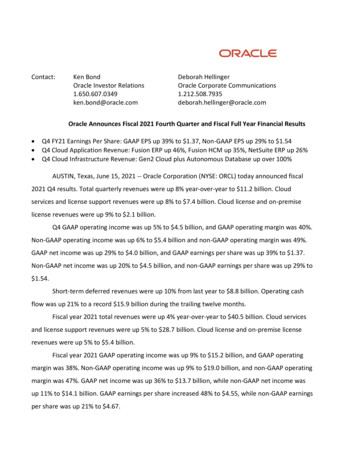
REVENUE & RIDERSHIP REPORTJUNE & FISCAL YEAR-END 2020lSEPTA annual ridership 223.5 million or 24% below last year due to COVID-19lCity & Suburban Transit ridership 24% and 23% below last yearlRegional Rail ridership 23% below FY 2019lFiscal year passenger revenue 25% below budget and 24% below last yearSEPTA RIDERSHIP PERFORMANCEAverage Daily Rides in 000's1,250Budget1,000Last Year750500250This Year0JulAug SepOctNov DecJanFebMarAprMayJun56220FY 19FY 20Budget116988Prepared By:Revenue & Ridership ManagementSoutheastern Pennsylvania Transportation Authority
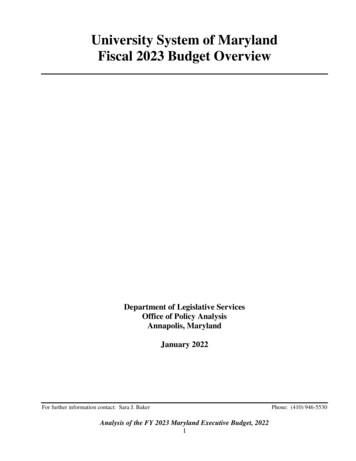
Revenue & Ridership PerformanceJune & Fiscal Year-End 2020Yearly performance dramatically changed after reporting a modest increase in ridership yearover-year through February or the first eight months of this year. Annual ridership for fiscal year2020 was 223.5 million trips or 23.7% below last year. The decrease in total passenger tripsversus last year is directly related to the ongoing COVID-19 global pandemic, which has impactedservice, work schedules, and travel patterns for the Authority and public. The governor issued astay-at-home order for Southeastern Pennsylvania on March 23rd which closed non-essentialbusinesses and schools to mitigate the spread of COVID-19. During the stay-at-home orders, theAuthority remained open as an essential business operating a reduced service schedule withprocedures in place to enhance social distancing through backdoor loading and vehicle capacitylimits. The COVID-19 pandemic will continue to negatively impact revenue and ridership into theforeseeable future.The region shifted to the yellow phase on June 5th which lifted the stay-at-home order withconditional work and social restrictions still in effect. Later in June, the Philadelphia suburbsmoved to a modified green phase. Due to the relaxed restrictions and the lifting of the stay-athome order, June ridership increased in comparison to recent months, but remained far belownormal levels. June passenger revenue and ridership was 69% below last year.Fiscal year-end divisional performance compared to last year reports City Transit ridership down23.8%, Suburban Transit ridership down 22.9%, and Regional Rail down 23.2%. Year-over-yeartotal trips were down 56.4 million for City, 5.1 million for Suburban, and 7.9 million for RegionalRail.Philadelphia gasoline prices for fiscal 2020 started at 2.90 per gallon and began to consistentlydecline throughout the rest of the year. Second quarter gas prices fell to 2.75 per gallon and inthe third and fourth quarter the region saw gas prices around 2.10 per gallon. Gas prices weredirectly affected by COVID-19 from reduced demand from restricted transportation and travel.The most recent area unemployment rates from the Bureau of Labor Statistics report the City andconsolidated Suburban average unemployment rates at 15.8% and 11.6%, respectively. The Stateunemployment rate is 13.2% compared to 3.8% last year. Due to the pandemic, the U.S.unemployment rate rose sharply from 3.8% in February, among the lowest on record, to 13.0% inMay.The following table provides a quarterly ridership comparison between FY 2020 and FY 2019 thatshows the dramatic effect the COVID-19 crisis had on ridership. The first and second quartersreported a zero percent change in ridership that continued through February or eight months intothe fiscal year. The third quarter was partially impacted reporting ridership down 11%. The entirefourth quarter was impacted reporting ridership down 82% or 60.9 million trips. Consolidatedyear-end ridership was 24% below FY 2019 with trip losses totaling 69.4 million.FISCALYEAR20202019DIFF.% DIFF.QUARTERLY 88-82%TOTAL223.483292.858-69.375-24%
June consolidated passenger revenue of 10.4 million was 27.3 million or 72.5% below budgetand 23.1 million or 69% below last year. Monthly passenger revenue reported City Transit 65%,Suburban Transit 52%, and Regional Rail 92% below budget.Year-to-date consolidated passenger revenue is 25.3% or 118.4 million below budget and 23.7%or 108.4 million below last year. Passenger revenue totals report the City 26%, Suburban 23%,and Regional Rail 25% below budget.June consolidated average daily linked ridership of 174,000 was 465,000 trips or 72.8% belowlast June and 482,000 trips or 73.6% below target. In June, 4.5 million originating trips wererecorded or 73.4% below budget and 70.6% below last year.Year-to-date average daily linked ridership of 535,000 trips is 25.2% below budget and 23.2%below last year. City Transit’s 403,000 daily riders: 25.4% below budget and 23.3% below last year Suburban Transit’s 42,000 daily riders: 23.5% below budget and 22% below last year Regional Rail’s 91,000 daily riders: 25% below budget and 23.6% below last year
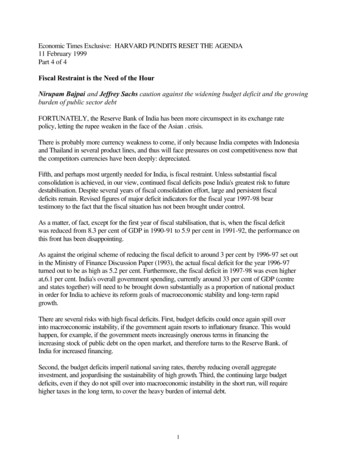
SEPTA RIDERSHIP PERFORMANCE BY DIVISIONFISCAL YEAR 2020JUNE 2020 VS. LAST YEAR* City down 11.2 million or -66%* Suburban down 1.1 million or -62%* Reg. Rail down 2.4 million or -92%* Total down 14.7 million or -69%FY 2020 VS. LAST YEAR* City down 56.4 million or -23.8%* Suburban down 5.1 million or -22.9%* Reg. Rail down 7.9 million or -23.2%* Total down 69.4 million or -23.7%PERCENT CHANGERIDERSHIP PERFORMANCEFY 2020 VS. FY OVDECJANFEB*MARAPR*MAYJUNMONTHCITYSUBURBANREGIONAL RAILFY 2020JUL *AUGSEPOCT *NOVDECJANFEB *MARCITY 15.321 20.171 19.443 19.837 23.442 17.520 17.408 18.620 17.124SUBURBAN 1.544 2.075 1.798 1.810 2.098 1.639 1.628 1.703 1.598REGIONAL RAIL 2.493 3.235 3.033 2.998 3.570 2.734 2.772 2.828 2.062TOTAL 19.358 25.481 24.274 24.645 29.110 21.893 21.808 23.151 276223.483JUL *AUGSEPOCT *NOVDECJANFEB *MARAPR *MAYJUNCITY 16.034 20.685 18.825 20.123 23.651 17.601 17.433 18.646 23.939 19.130 23.573 16.874SUBURBAN 1.661 2.107 1.768 1.822 2.176 1.652 1.591 1.625 2.135 1.737 2.152 1.727REGIONAL RAIL 2.422 2.930 2.758 2.792 3.340 2.556 2.646 2.720 3.353 2.777 3.295 2.603TOTAL 20.117 25.722 23.351 24.737 29.167 21.809 21.670 22.991 29.427 23.644 29.020 21.204YTD236.51422.15334.192292.859FY 2019FY 2020 VS. 2019CITYSUBURBANREGIONAL 22.9%-23.2%-23.7%Note: March through June results significantly impacted by COVID-19 crisis which started in mid-March.July decrease result of one less day in fiscal month compared to last July.RRD ridership increase influenced by a change from a transit to commuter rail pass for Airport Line employeeseffective July 1, 2019. Above unlinked ridership totals are reflected in millions. * Indicates five-week month.
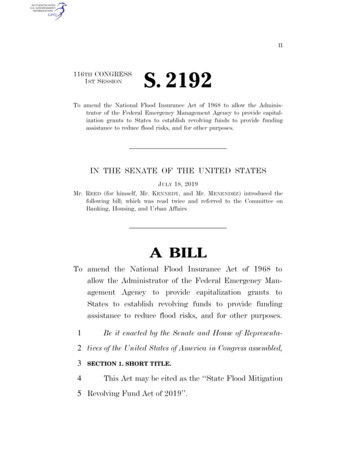
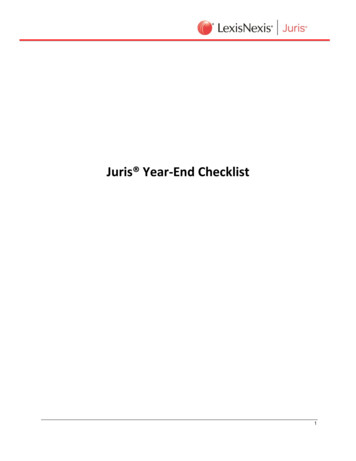
SEPTA ANNUAL RIDERSHIP BY DIVISIONFY 2009 - FY 2020Trips in MillionsSEPTA ANNUAL RIDERSHIP320329.6321.0295334.0337.3339.3HIGHEST IN23 ps in MillionsCITY TRANSIT Y13FY14FY15FY16FY17FY18FY19FY20Trips in MillionsTrips in MillionsSUBURBAN TRANSIT 17FY18FY1934.734.434.2FY17FY18FY19FY20REGIONAL RAIL FY20NOTED IMPACT:FY 2010 ridership impacted by six-day transit strike, two major snowstorms and weak economy throughout year.FY 2011 ridership rebounds recording highest total since 1989, aided by high gas prices despite fare increase.FY 2012 records ridership growth for second straight year as fuel prices range high between 3.30 and 4.00 per gallon.FY 2013 impacted by Hurricane Sandy resulting in a two million trip loss from two suspended service days.FY 2014 ridership decline influenced by harsh winter weather and fare pricing change.FY 2015 ridership remains consistant from prior year, Regional Rail sets new record with 37.4 million trips.FY 2016 ridership slips due to Papal visit, lower fuel prices and increased use of ride sharing services, RRD sets record.FY 2017 impacted by RRD rail car shortage during first quarter and six-day City Transit strike in early November 2016.FY 2018 trips down from modest fare increase & harsh winter, Suburban Transit records 4.2% trip increase.FY 2019 ridership impacted by City Transit trip losses from competition, roadway congestion, and other factors.FY 2020 significant ridership decline from COVID-19 crisis starting in mid-March through June or fiscal year-end.
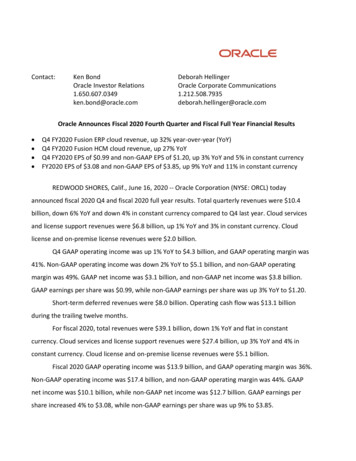
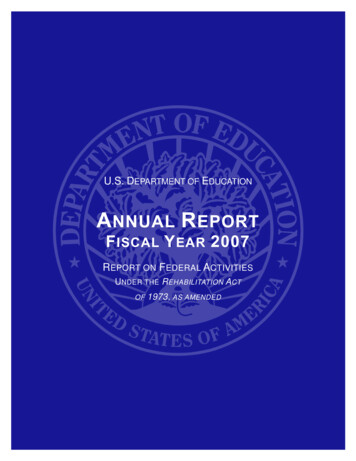
RIDERSHIP FARE MIXFY 2020Transit RidershipSenior Citizen10%Other4%Cash13%Token/Travel Wallet23%Quick Trip2%Pass38%Student Pass10%Railroad RidershipSenior Citizen6%Other2%Adult Cash5%Ticket18%Pass69%Note: Above ridership based on linked ridership or base ride originating trips excluding transit transfers.
REVENUE & PASSENGER ANALYSISJUNE 2020I. Consolidated Passenger Revenue ( 000)BudgetActual% BudgetLast Year% Last YrSurfaceSubway-ElevatedLight RailCity Transit 12,0838,8062,050 22,940 5,3222,143686 8,151-56.0%-75.7%-66.5%-64.5% 10,2157,9331,710 ban Transit 2,019546 2,565 979 245 1,224-51.5%-55.1%-52.3% 1,928 504 2,433-49.2%-51.4%-49.7% 12,188 37,693 1,009 10,384-91.7%-72.5% 11,215 33,505-91.0%-69.0%Regional RailTotal Passenger RevenueII. Consolidated Monthly Passengers (000's linked)SurfaceSubway-ElevatedLight RailADA ParaTransitShared Ride ProgramCity TransitVictoryFrontierADA ParaTransitSuburban TransitRegional 7%-73.6%47253114639-69.0%-64.8%-92.6%-72.8%III. Consolidated Monthly Passengers (000's unlinked)City TransitSuburban TransitRegional RailTOTAL19,0111,8012,88223,693IV. Key Statistics per Equivalent DayAverage Daily Passengers (000's, linked):City Transit490Suburban Transit51Regional Rail116TOTAL656
REVENUE & PASSENGER ANALYSISJUNE FYTD 2020I. Consolidated Passenger Revenue ( 000)BudgetActualSurfaceSubway-ElevatedLight RailCity Transit 153,943 112,121 26,113 292,177VictoryFrontierSuburban TransitRegional RailTotal Passenger Revenue% BudgetLast Year% Last Yr 115,215 82,688 19,250 217,153-25.2%-26.3%-26.3%-25.7% 150,045 109,274 25,504 284,823-23.2%-24.3%-24.5%-23.8% 25,594 6,670 32,264 19,923 4,986 24,909-22.2%-25.2%-22.8% 25,077 6,444 31,522-20.6%-22.6%-21.0% 143,259 467,700 107,245 349,307-25.1%-25.3% 141,365 457,709-24.1%-23.7%II. Consolidated Monthly Passengers (000's linked)SurfaceSubway-ElevatedLight RailADA ParaTransitShared Ride ProgramCity TransitVictoryFrontierADA ParaTransitSuburban TransitRegional %-23.6%-23.2%III. Consolidated Monthly Passengers (000's unlinked)City TransitSuburban TransitRegional RailTOTAL242,37622,70235,039300,117IV. Key Statistics per Equivalent DayAverage Daily Passengers (000's, linked):City Transit539Suburban Transit55Regional Rail121TOTAL715
Southeastern Pennsylvania Transportation AuthorityConsolidatedStatement of Revenue and Passengersfor the Budget Month Ended June 2020Current monthThis YearBudget 7,253 18,782 9,324 35,359 1,983 354 37,696Actual 4,1233,9152,20310,241014310,384Var.Last YearVar. % (3,130) -43.2% (14,866) -79.2% (7,121) -76.4% (25,118) -71.0% (1,983) -100.0% (211) -59.7% (27,312) -72.5% Actual4,85417,5639,90432,32188330133,505Passenger Revenue(000 omitted)Year to DateThis YearVar. Adult CashPassesTickets/TokensFull Fare AdultsOther FaresHalf FareTotal Passenger Revenue l 58,058168,06893,325319,45126,6443,212349,307Last YearVar.Var. % (30,509) -34.4% (58,296) -25.8% (19,427) -17.2% (108,231) -25.3% (9,046) -25.3% (1,117) -25.8% (118,394) -25.3% ActualVar. 7%-21.2%-23.3%Passengers(000 6,8165762,1999013,676946145513134,466(1,668) -74.3%(5,269) -70.6%(2,731) -75.2%(9,668) -72.5%(1,138) -100.0%(170) -64.2%(1,000) -62.0%(289) -84.1%(55) -80.4%(31) -69.8%(12,350) -81.0%-72.5%-70.6%Adult CashPassesTickets/TokensFull Fare AdultsSchoolDisabledSeniorOtherParatransitShared rideTotal Linked 8.4%-25.4%-19.8%-25.2%
Southeastern Pennsylvania Transportation AuthorityAll Transit DivisionsStatement of Revenue and Passengersfor the Budget Month Ended June 2020Current monthThis YearBudget 6,245 10,807 6,220 23,273 1,923 311 25,506Actual 4,1213,1112,0039,23501409,375Var.Last YearVar. % (2,124) -34.0% (7,697) -71.2% (4,217) -67.8% (14,038) -60.3% (1,922) -100.0% (170) -54.8% (16,131) -63.2% Actual3,88010,7886,51521,18484626122,291Passenger Revenue(000 omitted)Var. %6.2%-71.2%-69.3%-56.4%-100.0%-46.2%-57.9%Year to DateThis YearBudgetAdult CashPassesTokensFull Fare AdultsSchoolDisabledTotal Passenger Revenue 76,754 132,891 76,373 286,018 34,605 3,818 324,441Actual 48,186100,36864,706213,26025,9702,832242,062 Last YearVar.Var. %ActualVar. 79)-37.2%-24.5%-15.3%-25.4%-25.0%-25.8%-25.4% 64,013 130,537 79,312 273,862 38,763 3,719 .7%-21.2%-23.3%Passengers(000 3,9345762,0418633,480946025413134,256(1,525) -72.6%(3,458) -62.9%(2,247) -72.2%(7,229) -67.5%(1,117) -100.0%(156) -62.5%(845) -58.4%(246) -82.0%(55) -80.4%(31) -69.8%(9,678) -81.0%-72.5%-66.2%Adult CashPassesTokensFull Fare AdultsSchoolDisabledSeniorOtherParatransitShared rideTotal Linked 1,91513,9632,858684467133,008
Southeastern Pennsylvania Transportation AuthorityRegional Rail DivisionStatement of Revenue and Passengersfor the Budget Month Ended June 2020Current monthThis YearBudget 1,0087,9753,10412,086604412,190Actual 28051991,00631,009Var.Last YearVar. %Actual (1,006) -99.8% 974 (7,170) -89.9% 6,774 (2,904) -93.6% 3,389 (11,080) -91.7% 11,137 (60) -100.0% 37 (41) -94.0% 40 (11,181) -91.7% 11,215Passenger Revenue(000 omitted)Var. %Year to DateThis YearLast YearBudgetActualVar. 11,813 93,473 36,379 141,665 1,085 510 143,260 9,872 67,700 28,619 106,191 674 380 107,245 (1,941) (25,773) (7,760) (35,474) (411) (130) (36,015)-16.4%-27.6%-21.3%-25.0%-37.9%-25.6%-25.1% 11,916 88,149 39,434 139,499 1,348 518 dult CashPassesTickets/VouchersFull Fare -22.6%-33.2%-26.8%-21.5%-55.0%-91.9% Total Linked .8%-88.1%-94.1%-91.0%-100.0%-93.4%-91.0%Adult CashPassesTickets/VouchersFull Fare AdultsOther FaresHalf FareTotal Passenger RevenueVar. %ActualVar. %Passengers(000 ) -99.8%(1,810) -91.9%(484) -92.8%(2,438) -92.5%(21) -100.0%(14) -94.5%(155) -92.6%(44) -97.8%
Ridership Percentage By Time PeriodJune FY 2020.30%25%22%21%19%Ridership %20%17%23%20%19%17%15%11%11%10%5%6%5% 4%5%0%00:00-05:5906:00-08:59A.M. PEAK09:00-11:5912:00-14:59Time PeriodSurface TransitNote:Excludes Free Interchange Ridership15:00-17:59P.M. PEAKHigh Speed (Sub-El)18:00-20:5921:00-23:59
SENIOR CITIZEN RIDERSHIPJUNE FY 2020 Vs. FY 2019 (Unlinked)SENIOR CITIZEN AVERAGE DAILY RIDERSHIPBy Surface District, Sub/El Line & ,0002,0000ALGCALCOMELMFKDMIDSOUJUNE FY'20MODEAVERAGE DAILYFY'20FY'19VICMSH% 42,241119,8571,494,196357,581SUBURBAN 1-63%TOTALFRTMKTBRDRRDJUNE FY'19CITY TRANSITSurfaceHi-SpeedREGIONAL RAILNOR% VARYEAR TO DATEFY'20FY'19% VAR-57% 14,075,066 ,961,070-21%834,0862,152,114-61% 20,509,556 25,527,684-20%
VS.BUDGETSEPTA RIDERSHIP UPDATEJUNE 2020 & YEAR-ENDVS.LAST YEARJUN 2020:- 72.5%- 69.2%YEAR-END:- 25.5%- 23.7%400RIDERSHIP AVERAGE: 318.2 UDGET300.1RRidership in 0R7I.S7IMS0FY13FY14FY15FY16FY17FY18FY 2020: JULY 2019 - JUNE 2020FY19FY20
l ll l SEPTA annual ridership 223.5 million or 24% below last year due to COVID-19 l ll l City & Suburban Transit ridership 24% and 23% below last year l ll l Regional Rail ridership 23% below FY 2019 l ll l Fiscal year passenger revenue 25% below budget and 24% below last year 56220 116988 Prepared By: Revenue & Ridership Management Southeastern Pennsylvania Transportation Authority