Transcription
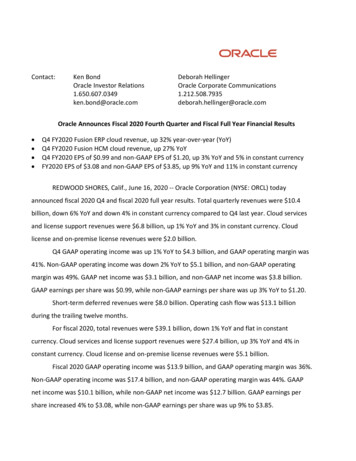
Contact:Ken BondOracle Investor Relations1.650.607.0349ken.bond@oracle.comDeborah HellingerOracle Corporate le.comOracle Announces Fiscal 2020 Fourth Quarter and Fiscal Full Year Financial Results Q4 FY2020 Fusion ERP cloud revenue, up 32% year-over-year (YoY)Q4 FY2020 Fusion HCM cloud revenue, up 27% YoYQ4 FY2020 EPS of 0.99 and non-GAAP EPS of 1.20, up 3% YoY and 5% in constant currencyFY2020 EPS of 3.08 and non-GAAP EPS of 3.85, up 9% YoY and 11% in constant currencyREDWOOD SHORES, Calif., June 16, 2020 -- Oracle Corporation (NYSE: ORCL) todayannounced fiscal 2020 Q4 and fiscal 2020 full year results. Total quarterly revenues were 10.4billion, down 6% YoY and down 4% in constant currency compared to Q4 last year. Cloud servicesand license support revenues were 6.8 billion, up 1% YoY and 3% in constant currency. Cloudlicense and on-premise license revenues were 2.0 billion.Q4 GAAP operating income was up 1% YoY to 4.3 billion, and GAAP operating margin was41%. Non-GAAP operating income was down 2% YoY to 5.1 billion, and non-GAAP operatingmargin was 49%. GAAP net income was 3.1 billion, and non-GAAP net income was 3.8 billion.GAAP earnings per share was 0.99, while non-GAAP earnings per share was up 3% YoY to 1.20.Short-term deferred revenues were 8.0 billion. Operating cash flow was 13.1 billionduring the trailing twelve months.For fiscal 2020, total revenues were 39.1 billion, down 1% YoY and flat in constantcurrency. Cloud services and license support revenues were 27.4 billion, up 3% YoY and 4% inconstant currency. Cloud license and on-premise license revenues were 5.1 billion.Fiscal 2020 GAAP operating income was 13.9 billion, and GAAP operating margin was 36%.Non-GAAP operating income was 17.4 billion, and non-GAAP operating margin was 44%. GAAPnet income was 10.1 billion, while non-GAAP net income was 12.7 billion. GAAP earnings pershare increased 4% to 3.08, while non-GAAP earnings per share was up 9% to 3.85.
“In Q4, non-GAAP earnings per share grew 5% in constant currency driven by strongperformances in both our cloud infrastructure and cloud applications businesses,” said Oracle CEO,Safra Catz. “Leading the way was our Fusion Cloud ERP Suite that grew 35% in constant currency,and our Fusion Cloud HCM Suite grew 29% in constant currency. Our overall business didremarkably well considering the pandemic, but our results would have been even better except forcustomers in the hardest-hit industries that we serve such as hospitality, retail, and transportationpostponing some of their purchases. Still, for the third year in a row, we delivered double-digitconstant currency earnings per share growth in FY20.”“In Q4, we launched a vastly improved version of our Exadata Cloud@Customer service,”said Oracle Chairman and CTO, Larry Ellison. “Exadata Cloud@Customer now enables our existingon-premise database customers to run the Oracle Autonomous Database in their own datacenter;previously, the Oracle Autonomous Database was only available in Oracle’s Gen2 Public Cloud.Enabling all our on-premise database customers to upgrade and run Oracle’s latest and bestdatabase technology in their own data center should dramatically accelerate the rate of adoptionof the Oracle Autonomous Database especially by our largest customers including banks andgovernments that are not currently planning to move their largest and most critical systems to apublic cloud.”The board of directors declared a quarterly cash dividend of 0.24 per share of outstandingcommon stock. This dividend will be paid to stockholders of record as of the close of business onJuly 15, 2020, with a payment date of July 28, 2020.Q4 Fiscal 2020 Earnings Conference Call and WebcastOracle will hold a conference call and webcast today to discuss these results at 2:00 p.m.Pacific. You may listen to the call by dialing (816) 287-5563, Passcode: 425392. To access the livewebcast, please visit the Oracle Investor Relations website at http://www.oracle.com/investor. Inaddition, Oracle’s Q4 results and fiscal 2020 financial tables are available on the Oracle InvestorRelations website.A replay of the conference call will also be available by dialing (855) 859-2056 or (404) 5373406, Passcode: 1424537.
About OracleThe Oracle Cloud offers a complete suite of integrated applications for Sales, Service,Marketing, Human Resources, Finance, Supply Chain and Manufacturing, plus Highly-Automatedand Secure Generation 2 Infrastructure featuring the Oracle Autonomous Database. For moreinformation about Oracle (NYSE:ORCL), visit us at www.oracle.com or contact Investor Relations atinvestor us@oracle.com or (650) 506-4073.# # #TrademarksOracle and Java are registered trademarks of Oracle and/or its affiliates. Other names may betrademarks of their respective owners."Safe Harbor" Statement: Statements in this press release relating to Oracle's future plans,expectations, beliefs, intentions and prospects, including statements regarding the rate of adoptionof our Autonomous Database, are "forward-looking statements" and are subject to material risksand uncertainties. Many factors could affect our current expectations and our actual results, andcould cause actual results to differ materially. We presently consider the following to be among theimportant factors that could cause actual results to differ materially from expectations: (1) TheCOVID-19 pandemic has affected how we and our customers are operating our respectivebusinesses, and the duration and extent to which this will impact our future results of operationsand our overall financial performance remains uncertain. (2) Our success depends upon our abilityto develop new products and services, integrate acquired products and services and enhance ourexisting products and services. (3) Our cloud strategy, including our Oracle Software-as-a-Serviceand Infrastructure-as-a-Service offerings, may adversely affect our revenues and profitability. (4)We might experience significant coding, manufacturing or configuration errors in our cloud, licenseand hardware offerings. (5) If the security measures for our products and services are compromisedand as a result, our customers' data or our IT systems are accessed improperly, made unavailable,or improperly modified, our products and services may be perceived as vulnerable, our brand andreputation could be damaged, the IT services we provide to our customers could be disrupted, andcustomers may stop using our products and services, all of which could reduce our revenue andearnings, increase our expenses and expose us to legal claims and regulatory actions. (6) Ourbusiness practices with respect to data could give rise to operational interruption, liabilities orreputational harm as a result of governmental regulation, legal requirements or industry standardsrelating to consumer privacy and data protection. (7) Economic, political and market conditions canadversely affect our business, results of operations and financial condition, including our revenuegrowth and profitability, which in turn could adversely affect our stock price. (8) Our internationalsales and operations subject us to additional risks that can adversely affect our operating results.(9) Acquisitions present many risks and we may not achieve the financial and strategic goals thatwere contemplated at the time of a transaction. A detailed discussion of these factors and other
risks that affect our business is contained in our SEC filings, including our most recent reports onForm 10-K and Form 10-Q, particularly under the heading "Risk Factors." Copies of these filings areavailable online from the SEC or by contacting Oracle Corporation's Investor Relations Departmentat (650) 506-4073 or by clicking on SEC Filings on Oracle’s Investor Relations website athttp://www.oracle.com/investor. All information set forth in this press release is current as of June16, 2020. Oracle undertakes no duty to update any statement in light of new information or futureevents.
ORACLE CORPORATIONQ4 FISCAL 2020 FINANCIAL RESULTSCONDENSED CONSOLIDATED STATEMENTS OF OPERATIONS( in millions, except per share data)2020REVENUESCloud services and license supportCloud license and on-premise licenseHardwareServicesTotal revenues % ofRevenues% Increase(Decrease)in US % Increase(Decrease)in ConstantCurrency (11%)(6%)3%(21%)(7%)(8%)(4%)Three Months Ended May 31,% OPERATING EXPENSESCloud services and license supportHardwareServicesSales and marketingResearch and developmentGeneral and administrativeAmortization of intangible assetsAcquisition related and otherRestructuringTotal operating )(18%)(58%)(9%)OPERATING INCOMEInterest expenseNon-operating income, 10%(125%)3%10%(123%)INCOME BEFORE PROVISION FOR INCOME TAXESProvision for income taxes3,69658035%5%3,86612635%1%(4%)361%(2%)374%30% 3,74034%(17%)(14%) 1.101.07NET INCOME 3,116EARNINGS PER SHARE:BasicDiluted 1.010.99WEIGHTED AVERAGE COMMON SHARES OUTSTANDING:BasicDiluted3,0913,162 3,3893,495(1) We compare the percent change in the results from one period to another period using constant currency disclosure. We present constant currencyinformation to provide a framework for assessing how our underlying businesses performed excluding the effect of foreign currency rate fluctuations. Topresent this information, current and comparative prior period results for entities reporting in currencies other than United States dollars are convertedinto United States dollars at the exchange rates in effect on May 31, 2019, which was the last day of our prior fiscal year, rather than the actual exchangerates in effect during the respective periods. Movements in international currencies relative to the United States dollar during the three months endedMay 31, 2020 compared with the corresponding prior year period decreased our revenues by 2 percentage points, operating expenses by 2 percentagepoints and operating income by 2 percentage points.1
ORACLE CORPORATIONQ4 FISCAL 2020 FINANCIAL RESULTSRECONCILIATION OF SELECTED GAAP MEASURES TO NON-GAAP MEASURES (1)( in millions, except per share data)2020GAAPAdj.TOTAL REVENUESCloud services and license support 10,4406,845 TOTAL OPERATING EXPENSESStock-based compensation (3)Amortization of intangible assets (4)Acquisition related and otherRestructuring 6,1313863661169 OPERATING INCOME 4,309 OPERATING MARGIN %% Increase (Decrease) % Increase (Decrease) inin US Constant Currency (2)Three Months Ended May AAP 23%)(59%)(10%)****(9%)(2%)(13%)(18%)(58%)(8%)**** 10,4416,846 11,1366,799 (832)(386)(366)(11)(69) 5,299- 6,87939442415168 (1,001)(394)(424)(15)(168) 5,878-833 5,142 4,257 1,004 5,26141%49%332019Non-GAAP38%47%1%(2%)3%0%305 bp.202 bp.307 bp.192 bp.INCOME TAX EFFECTS (5) 580 170 750 126 673 799361%(6%)374%(4%)NET INCOME 3,116 663 3,779 3,740 331 4,071(17%)(7%)(14%)(5%)DILUTED EARNINGS PER SHARE 0.99 1.20 1.07 1.16(8%)3%(5%)5%3,495(10%)(10%)(10%)(10%)DILUTED WEIGHTED AVERAGE COMMON SHARES OUTSTANDING3,162-3,1623,495-(1) This presentation includes non-GAAP measures. Our non-GAAP measures are not meant to be considered in isolation or as a substitute for comparable GAAP measures, and should be read only in conjunction withour consolidated financial statements prepared in accordance with GAAP. For a detailed explanation of the adjustments made to comparable GAAP measures, the reasons why management uses these measures,the usefulness of these measures and the material limitations on the usefulness of these measures, please see Appendix A.(2) We compare the percent change in the results from one period to another period using constant currency disclosure. We present constant currency information to provide a framework for assessing how ourunderlying businesses performed excluding the effect of foreign currency rate fluctuations. To present this information, current and comparative prior period results for entities reporting in currencies other thanUnited States dollars are converted into United States dollars at the exchange rates in effect on May 31, 2019, which was the last day of our prior fiscal year, rather than the actual exchange rates in effect duringthe respective periods.(3) Stock-based compensation was included in the following GAAP operating expense categories:Cloud services and license supportHardwareServicesSales and marketingResearch and developmentGeneral and administrativeTotal stock-based compensationThree Months EndedMay 31, 2020GAAPAdj.Non-GAAP 27 (27) 3(3)12(12)69(69)254(254)21(21) 386 (386) -Three Months EndedMay 31, 2019GAAPAdj.Non-GAAP 25 (25) 3(3)12(12)82(82)231(231)41(41) 394 (394) -(4) Estimated future annual amortization expense related to intangible assets as of May 31, 2020 was as follows:Fiscal 2021Fiscal 2022Fiscal 2023Fiscal 2024Fiscal 2025ThereafterTotal intangible assets, net 1,3511,102679445126353,738(5) Income tax effects were calculated reflecting an effective GAAP tax rate of 15.7% and 3.3% in the fourth quarter of fiscal 2020 and 2019, respectively, and an effective non-GAAP tax rate of 16.6% and 16.4% in thefourth quarter of fiscal 2020 and 2019, respectively. The difference in our GAAP and non-GAAP tax rates in the fourth quarter of fiscal 2020 was primarily due to the net tax effects on stock-based compensationexpense and acquisition related items, including the tax effects of amortization of intangible assets. The difference in our GAAP and non-GAAP tax rates in the fourth quarter of fiscal 2019 was primarily due to a taxbenefit arising from the increase of a deferred tax asset associated with a partial realignment of our legal structure; the net tax effects on stock-based compensation expense; and acquisition related items,including the tax effects of amortization of intangible assets.* Not meaningful2
ORACLE CORPORATIONFISCAL 2020 YEAR TO DATE FINANCIAL RESULTSCONDENSED CONSOLIDATED STATEMENTS OF OPERATIONS( in millions, except per share data)2020REVENUESCloud services and license supportCloud license and on-premise licenseHardwareServicesTotal revenues % ofRevenues% Increase(Decrease)in US % Increase(Decrease)in ConstantCurrency )(7%)(4%)(1%)4%(11%)(6%)(3%)0%Year Ended May 31,% %100%OPERATING EXPENSESCloud services and license supportHardwareServicesSales and marketingResearch and developmentGeneral and administrativeAmortization of intangible assetsAcquisition related and otherRestructuringTotal operating (6%)(6%)29%(42%)(2%)OPERATING INCOMEInterest expenseNon-operating income, )2%3%(4%)(80%)4%(4%)(80%)INCOME BEFORE PROVISION FOR INCOME TAXESProvision for income 6% 11,08328%(9%)(7%) 3.052.97NET INCOME 10,135EARNINGS PER SHARE:BasicDiluted 3.163.08WEIGHTED AVERAGE COMMON SHARES OUTSTANDING:BasicDiluted3,2113,294 3,6343,732(1) We compare the percent change in the results from one period to another period using constant currency disclosure. We present constant currencyinformation to provide a framework for assessing how our underlying businesses performed excluding the effect of foreign currency rate fluctuations. Topresent this information, current and comparative prior period results for entities reporting in currencies other than United States dollars are convertedinto United States dollars at the exchange rates in effect on May 31, 2019, which was the last day of our prior fiscal year, rather than the actual exchangerates in effect during the respective periods. Movements in international currencies relative to the United States dollar during the year ended May 31,2020 compared with the corresponding prior year period decreased our revenues by 1 percentage point, operating expenses by 1 percentage point andoperating income by 1 percentage point.3
ORACLE CORPORATIONFISCAL 2020 YEAR TO DATE FINANCIAL RESULTSRECONCILIATION OF SELECTED GAAP MEASURES TO NON-GAAP MEASURES (1)( in millions, except per share data)2020GAAPAdj.TOTAL ensesupportsupportrevenues 39,06827,392 TOTAL OPERATING EXPENSESStock-based compensation (3)Amortization of intangible assets (4)Acquisition related and otherRestructuring 25,1721,5901,58656250 OPERATING INCOME 13,896 OPERATING MARGIN %44Adj.GAAPNon-GAAPGAAPNon-GAAP %)(2%)****(2%)(4%)(6%)29%(42%)(1%)**** 39,50626,707 (3,482)(1,590)(1,586)(56)(250) 21,690- 25,9711,6531,68944443 (3,829)(1,653)(1,689)(44)(443) 22,142-3,486 17,382 13,535 3,849 17,38444%34%INCOME TAX EFFECTS (5) 1,928 939NET INCOME 10,135 2,547DILUTED EARNINGS PER SHARE 3.083,294- 2,86744%3%0%4%1%131 bp.51 bp.143 bp.54 bp.1,185 1,795 2,98063%(4%)66%(2%) 12,682 11,083 2,054 13,137(9%)(3%)(7%)(2%) 3.524%9%6%11%3,732(12%)(12%)(12%)(12%)3.85 20202019Non-GAAP 39,07227,39636%DILUTED WEIGHTED AVERAGE COMMON SHARES OUTSTANDING% Increase (Decrease) % Increase (Decrease) inin US Constant Currency (2)Year Ended May 31,20202019Non-GAAPGAAP3,2942.973,732-(1) This presentation includes non-GAAP measures. Our non-GAAP measures are not meant to be considered in isolation or as a substitute for comparable GAAP measures, and should be read only in conjunction withour consolidated financial statements prepared in accordance with GAAP. For a detailed explanation of the adjustments made to comparable GAAP measures, the reasons why management uses these measures,the usefulness of these measures and the material limitations on the usefulness of these measures, please see Appendix A.(2) We compare the percent change in the results from one period to another period using constant currency disclosure. We present constant currency information to provide a framework for assessing how ourunderlying businesses performed excluding the effect of foreign currency rate fluctuations. To present this information, current and comparative prior period results for entities reporting in currencies other thanUnited States dollars are converted into United States dollars at the exchange rates in effect on May 31, 2019, which was the last day of our prior fiscal year, rather than the actual exchange rates in effect duringthe respective periods.(3) Stock-based compensation was included in the following GAAP operating expense categories:Cloud services and license supportHardwareServicesSales and marketingResearch and developmentGeneral and administrativeTotal stock-based compensationGAAP11011542611,035119 1,590 Year EndedMay 31, 2020Adj. (110)(11)(54)(261)(1,035)(119) (1,590)Non-GAAP -GAAP991049360963172 1,653 Year EndedMay 31, 2019Adj. (99)(10)(49)(360)(963)(172) (1,653)Non-GAAP -(4) Estimated future annual amortization expense related to intangible assets as of May 31, 2020 was as follows:Fiscal 2021Fiscal 2022Fiscal 2023Fiscal 2024Fiscal 2025ThereafterTotal intangible assets, net 1,3511,102679445126353,738(5) Income tax effects were calculated reflecting an effective GAAP tax rate of 16.0% and 9.7% in fiscal 2020 and 2019, respectively, and an effective non-GAAP tax rate of 18.4% and 18.5% in fiscal 2020 and 2019,respectively. The difference between our GAAP and non-GAAP tax rates in fiscal 2020 was primarily due to the net tax effects on stock-based compensation expense and acquisition related items, including the taxeffects of amortization of intangible assets. The difference in our GAAP and non-GAAP tax rates in fiscal 2019 was primarily due to adjustments in our estimates for the one-time effects of the U.S. Tax Cuts and JobsAct of 2017 (refer to Appendix A for additional information); a tax benefit arising from the increase of a deferred tax asset associated with a partial realignment of our legal structure; the net tax effects on stockbased compensation expense; and acquisition related items, including the tax effects of amortization of intangible assets.* Not meaningful4
ORACLE CORPORATIONFISCAL 2020 FINANCIAL RESULTSCONDENSED CONSOLIDATED BALANCE SHEETS( in millions)May 31,2020May 31,2019ASSETSCurrent Assets:Cash and cash equivalentsMarketable securitiesTrade receivables, netPrepaid expenses and other current assets Total Current Assets37,2395,8185,5513,532 20,51417,3135,1343,42552,14046,386Non-Current Assets:Property, plant and equipment, netIntangible assets, netGoodwill, netDeferred tax assetsOther non-current 6964,317Total Non-Current Assets63,29862,323TOTAL ASSETS 115,438 108,709 2,3716371,4538,0024,73717,200 4,4945801,6288,3743,55418,630LIABILITIES AND EQUITYCurrent Liabilities:Notes payable, currentAccounts payableAccrued compensation and related benefitsDeferred revenuesOther current liabilitiesTotal Current LiabilitiesNon-Current Liabilities:Notes payable and other borrowings, non-currentIncome taxes payableOther non-current liabilitiesTotal Non-Current 867,716Equity12,71722,363TOTAL LIABILITIES AND EQUITY 5115,438 108,709
ORACLE CORPORATIONFISCAL 2020 FINANCIAL RESULTSCONDENSED CONSOLIDATED STATEMENTS OF CASH FLOWS( in millions)Year Ended May 31,20202019Cash Flows From Operating Activities:Net income 10,135 11,083Adjustments to reconcile net income to net cash provided by operating activities:Depreciation1,382Amortization of intangible ed income taxesStock-based compensationOther, net1,230Changes in operating assets and liabilities, net of effects from acquisitions:Increase in trade receivables, net(445)(82)665261Decrease in accounts payable and other liabilities(496)(102)Decrease in income taxes payable(444)(453)(Decrease) increase in deferred revenues(222)30613,13914,551Decrease in prepaid expenses and other assetsNet cash provided by operating activitiesCash Flows From Investing Activities:Purchases of marketable securities and other investmentsProceeds from maturities of marketable securities and other investmentsProceeds from sales of marketable securitiesAcquisitions, net of cash (363)(1,564)(1,660)9,84326,557Payments for repurchases of common stock(19,240)(36,140)Proceeds from issuances of common stock1,5882,155Capital expendituresNet cash provided by investing activitiesCash Flows From Financing Activities:Shares repurchased for tax withholdings upon vesting of restricted stock-based awards(665)(503)Payments of dividends to stockholders(3,070)(2,932)Proceeds from borrowings, net of issuance costs19,888-Repayments of borrowingsOther, 8)16,725(1,106)Net cash used for financing activitiesEffect of exchange rate changes on cash and cash equivalentsNet increase (decrease) in cash and cash equivalentsCash and cash equivalents at beginning of period20,514 Cash and cash equivalents at end of period637,23921,620 20,514
ORACLE CORPORATIONFISCAL 2020 FINANCIAL RESULTSFREE CASH FLOW - TRAILING 4-QUARTERS (1)( in millions)Fiscal 2019Q1GAAP Operating Cash Flow Capital ExpendituresFree Cash Flow % Growth over prior yearGAAP Net IncomeFree Cash Flow as a % of Net Income Q2Fiscal 2020Q3Q415,542 15,238 14,789(1,646)(1,468)(1,625)13,896 13,770 13,16410%10%3,708 3,827 375% (1%)10,619360%124% Q1Q2Q3Q414,551 13,829 13,796 13,947(1,660)(1,663)(1,591)(1,544)12,891 12,166 12,205 12,403(6%)(12%)(11%)11,083 10,955 10,933 116%111%112% (1,564) (6%)10,759115%13,13911,575(10%) 10,135114%(1) To supplement our statements of cash flows presented on a GAAP basis, we use non-GAAP measures of cash flows on a trailing 4-quarter basis to analyze cash flow generated from operations.We believe free cash flow is also useful as one of the bases for comparing our performance with our competitors. The presentation of non-GAAP free cash flow is not meant to be considered inisolation or as an alternative to net income as an indicator of our performance, or as an alternative to cash flows from operating activities as a measure of liquidity.7
ORACLE CORPORATIONFISCAL 2020 FINANCIAL RESULTSSUPPLEMENTAL ANALYSIS OF GAAP REVENUES (1)( in millions)Q1REVENUES BY OFFERINGSCloud services and license supportCloud license and on-premise licenseHardwareServicesFiscal 2019Q3Q2Q4Q1TOTALFiscal 2020Q3Q2Q4TOTAL 6,609 8679048136,637 1,2178918176,662 1,2519157866,7992,520994823 26,7075,8553,7043,240 6,805 8128157866,811 1,1268718066,930 1,231857778 9,193 9,562 9,614 11,136 39,506 9,218 9,614 9,796 )2%2%3%4%3%2%1%3%(4%)0%2,580 4,0296,609 2,621 4,0166,637 2,637 4,0256,662 2,7164,0836,799 10,55316,154 26,7072,704 4,1016,805 2,753 4,0586,811 2,809 4,1216,930 AS REPORTED REVENUE GROWTH RATESApplications cloud services and license supportInfrastructure cloud services and license supportTotal cloud services and license %3%6%2%4%1%0%1%4%1%3%CONSTANT CURRENCY GROWTH RATES (2)Applications cloud services and license supportInfrastructure cloud services and license supportTotal cloud services and license %4%5%3%3%3%5%3%4%5,161 2,5761,4569,193 5,243 2,7821,5379,562 5,266 6,1842,7813,1321,5671,8209,614 11,136 21,85611,2706,380 39,5065,150 2,5531,5159,218 5,304 2,6951,6159,614 Total revenuesAS REPORTED REVENUE GROWTH RATESCloud services and license supportCloud license and on-premise licenseHardwareServicesTotal revenuesCONSTANT CURRENCY GROWTH RATES (2)Cloud services and license supportCloud license and on-premise licenseHardwareServicesTotal revenuesCLOUD SERVICES AND LICENSE SUPPORT REVENUESBY ECOSYSTEMApplications cloud services and license supportInfrastructure cloud services and license supportTotal cloud services and license supportGEOGRAPHIC REVENUESAmericasEurope/Middle East/AfricaAsia PacificTotal revenues 6,845 27,3921,9595,1279013,4437353,106 39,0682,749 11,0154,09616,3776,845 27,3925,363 5,746 21,5632,8352,95211,0351,5981,7426,4709,796 10,440 39,068(1) The sum of the quarterly information presented may vary from the year-to-date information presented due to rounding.(2) We compare the percent change in the results from one period to another period using constant currency disclosure. We present constant currency information to provide a framework forassessing how our underlying businesses performed excluding the effect of foreign currency rate fluctuations. To present this information, current and comparative prior period results forentities reporting in currencies other than United States dollars are converted into United States dollars at the exchange rates in effect on May 31, 2019 and 2018 for the fiscal 2020 andfiscal 2019 constant currency growth rate calculations presented, respectively, rather than the actual exchange rates in effect during the respective periods.8
APPENDIX AORACLE CORPORATIONQ4 FISCAL 2020 FINANCIAL RESULTSEXPLANATION OF NON-GAAP MEASURESTo supplement our financial results presented on a GAAP basis, we use the non-GAAP measures indicated in the tables, which excludecertain business combination accounting entries and expenses related to acquisitions, as well as other significant expenses includingstock-based compensation, that we believe are helpful in understanding our past financial performance and our future results. Our nonGAAP financial measures are not meant to be considered in isolation or as a substitute for comparable GAAP measures and should beread only in conjunction with our consolidated financial statements prepared in accordance with GAAP. Our management regularly usesour supplemental non-GAAP financial measures internally to understand, manage and evaluate our business and make operatingdecisions. These non-GAAP measures are among the primary factors management uses in planning for and forecasting future periods.Compensation of our executives is based in part on the performance of our business based on these non-GAAP measures. Our non-GAAPfinancial measures reflect adjustments based on the following items, as well as the related income tax effects related to each of thebelow items except for the impact of the U.S. Tax Cuts and Jobs Act of 2017: Cloud services and license support revenues: Business combination accounting rules require us to account for the fair values of cloudservices and license support contracts assumed in connection with our acquisitions. The non-GAAP adjustments to our cloud servicesand license support revenues are intended to include, and thus reflect, the full amount of such revenues. We believe the adjustments tothese revenues are useful to investors as a measure of the ongoing performance of our business as we generally expect to experiencehigh renewal rates for these contracts at their stated values during the post combination periods. Stock-based compensation expenses: We have excluded the effect of stock-based compensation expenses from our non-GAAPoperating expense
Oracle Investor Relations Oracle Corporate Communications 1.650.607.0349 1.212.508.7935 ken.bond@oracle.com deborah.hellinger@oracle.com Oracle Announces Fiscal 2020 Fourth Quarter and Fiscal Full Year Financial Results Q4 FY2020 Fusion ERP cloud revenue, up 32% year-over-year (YoY) .