Transcription
University System of MarylandFiscal 2023 Budget OverviewDepartment of Legislative ServicesOffice of Policy AnalysisAnnapolis, MarylandJanuary 2022For further information contact: Sara J. BakerAnalysis of the FY 2023 Maryland Executive Budget, 20221Phone: (410) 946-5530
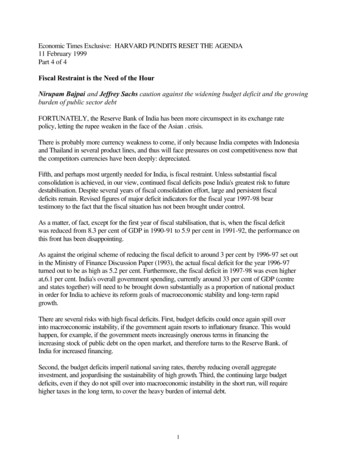
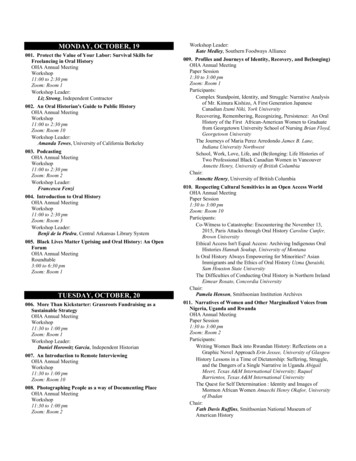
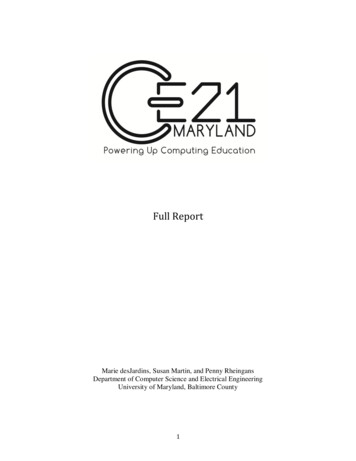
R30B00 – University System of Maryland – Fiscal 2023 Budget OverviewExecutive SummaryThe University System of Maryland (USM) consists of 11 degree granting institutions, aresearch center, and the system office, which operates three regional higher education centers.Operating Budget DataRevenues by Fund TypeFiscal 2021-2023( in Millions) 7,000 6,000 5,000 4,000 3,000 2,000 1,000 02021Current Unrestricted2022 WorkingGeneralCurrent Restricted2023 AllowanceFederal Relief FundsSpecialNote: Special funds totaling 9.4 million in fiscal 2022 and 9.3 million in fiscal 2023 for the Maryland Fire and RescueInstitute are included as restricted funds. Fiscal 2022 general fund appropriation includes deficiencies, general salaryincreases, and 213.2 million in pay-as-you-go (PAYGO). The fiscal 2023 general fund allowance includes general salaryincreases, annualization of fiscal 2022 general salary increases, and 65 million in PAYGO. Of the general funds, 2.5 million are restricted funds.Source: Governor’s Fiscal 2023 Budget Books General funds increase by 302.7 million, or 21.0%, in fiscal 2023 after adjusting fordeficiencies that would replace 43.9 million in general funds with the Higher EducationInvestment Fund (HEIF), a 3% general salary increase effective January 2022, increments, anda bonus. After adjusting for the deficiency, the HEIF decreases 15.1%, or 19.3 million, infiscal 2023.Analysis of the FY 2023 Maryland Executive Budget, 20222
R30B00 – University System of Maryland – Fiscal 2023 Budget Overview A portion of the increase in general funds in fiscal 2023 ( 93.8 million) restores the remainingfiscal 2021 Board of Public Works (BPW) reduction. The fiscal 2023 budget includes two additional proposed deficiency appropriations that wouldprovide 1.0 million in additional general funds: 0.5 million for the University of MarylandBaltimore County (UMBC) to establish the Maryland Institute for Innovative Computing; and 0.5 million for Bowie State University (BSU) to backfill funding. USM institutions received a total of 574.2 million in federal relief funding between fiscal 2020and 2022: 210.8 million was required to be used for student financial aid; and the remainingto cover various COVID-19 related expenses and revenue losses. More than half of the funds( 289.7 million) are to be expended in fiscal 2022.Analysis of the FY 2023 Maryland Executive Budget, 20223
R30B00 – University System of Maryland – Fiscal 2023 Budget OverviewKey Observations Between fall 2019 (prepandemic) and 2021, undergraduate enrollment across USM institutionshas declined 4.3%, or 5,668 students, with only three institutions experiencing an increase infall enrollment. Compared to fall 2020, undergraduate enrollment in fall 2021 declined 3.5%, or 4,579 students,with continuing students falling 5.0%, or 5,008 students. This decline was partly offset by a7.1% (989 students) increase in first-time students. The impact of COVID-19 can be seen in the second-year retention rate of the fiscal 2021 cohort,which declined at all but one institution.Operating Budget Recommended Actions1.Concur with Governor’s allowance.Analysis of the FY 2023 Maryland Executive Budget, 20224
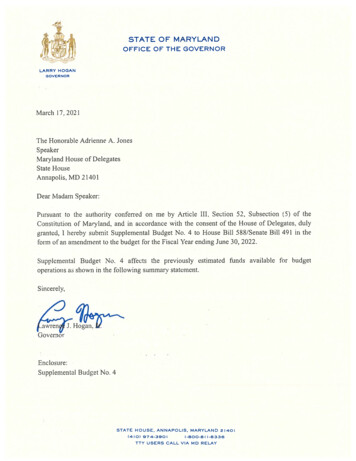
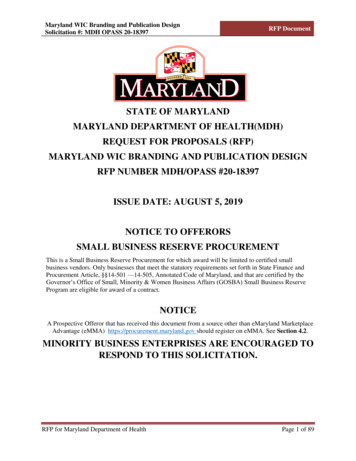
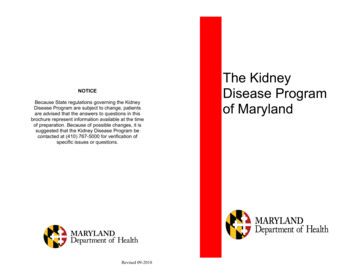
R30B00University System of MarylandFiscal 2023 Budget OverviewOperating Budget AnalysisProgram DescriptionTitle 12 of the Education Article establishes USM to “foster the development of a consolidatedsystem of public higher education, to improve the quality of education, to extend its benefits, and toencourage the economical use of the State’s resources.” USM consists of 11 degree-grantinginstitutions, a research center, and the system office, which operates three regional higher educationcenters. Exhibit 1 illustrates the structure of the system.Exhibit 1University System of MarylandGovernorUniversity Systemof Maryland Boardof RegentsSystem OfficeUM, BaltimoreUM, CollegeParkUM BaltimoreCountyFrostburgStateUM EasternShoreUM Center forEnvironmental ScienceSalisburyBowie StateTowsonUM Global CampusUM: University of MarylandSource: Department of Legislative ServiceAnalysis of the FY 2023 Maryland Executive Budget, 20225RegionalCentersCoppinStateUniversity ofBaltimore
R30B00 – University System of Maryland – Fiscal 2023 Budget OverviewThe Board of Regents (BOR) is the governing body of USM. The board consists of 21 members,including 2 full-time students, the Secretary of Agriculture (ex officio), and the Secretary of Commerce(ex officio). Except for the Secretary of Agriculture and the Secretary of Commerce, 17 members areappointed by the Governor with the advice and consent of the Senate; 1 member is appointed by theSenate President; and 1 member is appointed by the Speaker of the House of Delegates. The boardappoints the Chancellor, who serves as the chief executive officer of the system and the chief of staffto the board. The Chancellor and staff coordinate system planning; advise the board of systemwidepolicy; coordinate and arbitrate among system institutions; and provide technical, legal, and financialassistance.The board reviews, modifies, and approves a systemwide strategic plan developed by theChancellor in consultation with institution presidents. The board is charged with assuring that programsoffered by the institutions are not unproductive or unreasonably duplicative. Other board activitiesinclude reviewing and approving new programs, reviewing existing programs, setting minimumadmission standards, and determining guidelines for tuition and fees. The board monitors the progressof each system institution toward its approved goals and holds each president accountable for theprogress toward the goals. Furthermore, the board may delegate any of its responsibilities to theChancellor.Consistent with the State Plan for Higher Education, USM goals are to: create and maintain a well-educated workforce; promote economic development; increase access for economically disadvantaged and minority students; and achieve and sustain national eminence in providing quality education, research, and publicservice.Performance Analysis1.Undergraduate EnrollmentImpact of COVID-19In fall 2020, USM institutions de-densified campuses with most classes being taught remotelyand reduced resident hall occupancy. In fall 2021, campuses resumed in-person classes with fulloccupancy of resident halls. In order to understand the impact that these actions had on undergraduateenrollment, fall 2019 (prepandemic) enrollment is used as a baseline for comparison. Nationally,undergraduate enrollment at public four-year institutions fell 4.0% between fall 2019 and 2021,compared to a 4.3%, or 5,668 students, decline at USM institutions. When excluding University ofMaryland Global Campus (UMGC), enrollment declined 5.4%, or 4,619 students.Analysis of the FY 2023 Maryland Executive Budget, 20226
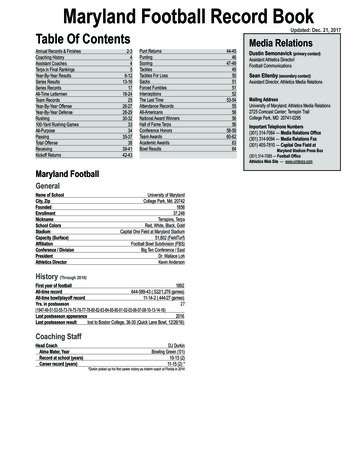
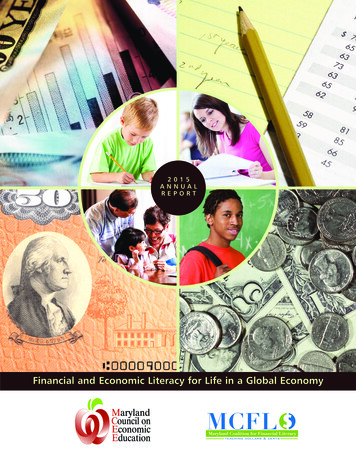
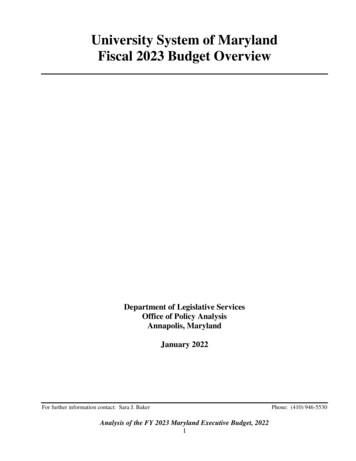
R30B00 – University System of Maryland – Fiscal 2023 Budget OverviewOverall, all but three institutions – University of Maryland, Baltimore Campus (UMB);University of Maryland, College Park (UMCP); and BSU – experienced declines in enrollment fromfall 2019 to 2021, as shown in Exhibit 2. Three institutions – University of Maryland Eastern Shore(UMES), Coppin State University (CSU), and University of Baltimore (UBalt) – saw enrollment dropsof greater than 20% during this time period. In terms of headcount, Towson University (TU)experienced the largest decline of 1,709 students, and Salisbury University (SU) decreased by1,001 students.Exhibit 2Change in Fall Undergraduate EnrollmentFall 2018-202110%5%0%-5%-10%-15%-20%-25%-30%-35%-40%UMB UMCPBSUTUChange 2018-2021UMESFSUCSUUBaltSUUMBC UMGCChange 2019-2021Source: University System of MarylandIt should be noted that enrollment declines started before the pandemic in fall 2018. Betweenfall 2018 and 2021, enrollment at USM institutions fell 6.3%, or 8,554 students, with three institutionsexperiencing enrollment growth – UMB, UMCP, and BSU. Of most concern are the drops in enrollmentexceeding 30% at UBalt and UMES and 20% at CSU and Frostburg State University (FSU). Thesedecreases, particularly those prior to the pandemic, lead to concerns about the financial stability ofthese institutions as they need to find ways to cover the loss of tuition and fee and auxiliary revenues.Analysis of the FY 2023 Maryland Executive Budget, 20227
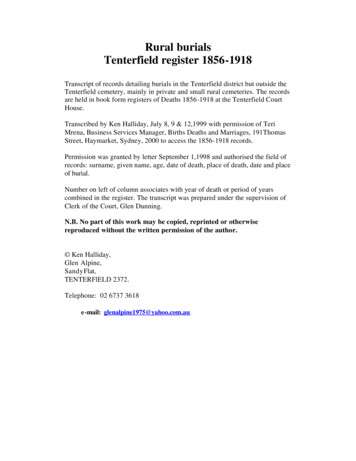
R30B00 – University System of Maryland – Fiscal 2023 Budget OverviewWhen breaking down undergraduate enrollment by student category, transfer students havedecreased by 3,353 students, or 16.9%, since fall 2018 with the largest decline (1,941 students)occurring in fall 2019, as shown in Exhibit 3. The largest total decline of 4,579 student occurred infall 2021, primarily driven by continuing students falling by 5,008 students.Exhibit 3Fall Undergraduate Headcount EnrollmentFall 0,00020,00002018Continuing Students20192020First-time Undergraduate2021TransfersSource: University System of MarylandExhibit 4 shows, by student level, the number of students who did not return to the sameinstitution from fall to fall. According to USM, none of these students have graduated. Some may havetransferred to another institution or participated in a study aboard program (excluding fall 2020 whenthe program was not offered). Students who stopped out may, over time, become dropouts, notreturning to any college to complete their degree. The number of students not reenrolling in fall 2020,when campuses were partially opened with a majority of courses being taught remotely, increased to24,641 students but was fewer than the 26,240 students in fall 2018.Analysis of the FY 2023 Maryland Executive Budget, 20228
R30B00 – University System of Maryland – Fiscal 2023 Budget OverviewExhibit 4Fall-to-fall Undergraduate Attrition by Student LevelFall 523,5836,0265,1107,2746,23124,641Note: These are students who did not return to the same institution from fall to fall.Source: University System of MarylandNotably, the number of freshmen not enrolling decreased by 432 students in fall 2020, whilethe numbers of students at other levels not enrolling increased by 1,490. The trend may indicate remotelearning did not deter freshmen from coming back to college and that the programs and servicesdesigned to help students were successful. Of concern, however, are the increased number of juniorsand seniors from fall 2020 who did not come back after financially investing in their education andpossibly accumulating debt. According to EAB, about half the students who stopped out will returnwithin a year either on their own or in response to an institution’s reenrollment outreach program. Thisshows that there may still be opportunities for institutions to reach out to students who stopped out,whether they initially attended their institution or not, and encourage them to return and earn theirdegree.The Chancellor should comment on efforts institutions are taking to retain students,especially juniors and seniors, and efforts to reach out to those who have stopped out to returnand earn their degree.Fall 2021 EnrollmentIn fall 2021, the second fall semester since the COVID-19 pandemic began, institutions resumedin-person classes and operating residency halls at near capacity (setting aside rooms for students whoneeded to isolate or quarantine). In order to keep students, faculty, and staff safe, USM implementedvarious procedures and policies including a vaccine mandate and an indoor masking requirement.Furthermore, for fall 2021, institutions were allowed to continue test optional admissions.At the start of the fall semester, there were uncertainties: would those potential freshmen whodid enroll in fall 2020 come to campus this fall and would those who stopped out return? Nationally,according to the National Student Clearinghouse, the answer was no: undergraduate enrollment at thepublic four-year institutions declined 3.8% in fall 2021, with a 2.7% decline in freshmen enrollment.Consistent with the national trends, at USM institutions, undergraduate enrollment declined 3.5%, orAnalysis of the FY 2023 Maryland Executive Budget, 20229
R30B00 – University System of Maryland – Fiscal 2023 Budget Overview4,579 students, in fall 2021. As shown in Exhibit 5, enrollment declined at eight institutions withfour experiencing declines of over 10% – UMES, FSU, CSU, and UBalt. When excluding UMGCenrollment decreased 3.1%, or 2,623 students.Exhibit 5Change in Fall 2020 and 2021 Undergraduate Headcount Enrollment1,0005000-500-1,000-1,500-2,000-2,500UMB UMCPBSUContinuing StudentsTUUMESFSUCSUUBaltSUFirst-time UndergraduateUMBC UMGCTransfersSource: University System of MarylandContinuing students declined 5.0%, or 5,008 students, with UMGC and TU accounting for1,757 and 1,120 of the decline, respectively. Five institutions experienced declines exceeding 10% –UMES, FSU, CSU, UBalt, and SU. Enrollment of transfer students continued to decline for a thirdyear, decreasing 3.3%, or 560 students. Seven institutions experienced a decline in transfers, withUMCP experiencing the greatest decrease of 18.8% (496 students) followed by UBalt at16.0% (52 students). Conversely, CSU had the largest increase in transfer of 14.5% (22 students), thefirst increase in transfers since at least fall 2015 at CSU.On the positive side, first-time students at USM institutions increased 7.1%, or 989 students.Increases totaling 1,290 students at four institutions were partly offset by declines at six institutions.UMBC experienced the largest increase at 22.0% (377 students), which resulted in one of their largestincoming classes. First-time enrollments at CSU continued to decline, a decrease of 40.5%, or124 students.The Chancellor should comment on efforts the University System of Maryland Office(USMO) and BOR are taking to assist those institutions experiencing significant drops inundergraduate enrollment to stabilize enrollment and maintain financial sustainability, thebreakeven points for those institutions, and what happens when enrollment drops below thebreakeven level.Analysis of the FY 2023 Maryland Executive Budget, 202210
R30B00 – University System of Maryland – Fiscal 2023 Budget Overview2.Student PerformanceRetention RatesRetention rates are not only an indicator of student progress but also the ability of institutionsto keep students. The second-year rate is an indicator of a number of factors, ranging from studentsbeing prepared for college to institutions providing support to students. Improving the retention ofstudents is one of USM’s strategies to increase enrollment, as it is easier to retain students than torecruit new students. It is also an early measure of any longer-term impacts that COVID-19 may haveon institutions. As shown in Exhibit 4 and Exhibit 5, a substantial number of students did not comeback to USM institutions in fall 2020 and 2021, which will affect the retention and graduation rates inthe out-years, and it could take years for institutions to recover from the lost enrollment.Exhibit 6 shows the impact of COVID-19 on the second-year retention rates, comparing therates of fiscal 2019 cohort (prepandemic) with the fiscal 2020 and 2021 cohorts. The fiscal 2020 cohorthad their first year interrupted by COVID-19 with the closure of campuses and the transition to remotelearning during the spring 2020 semester. The impact on this cohort may have been tempered by thetiming (mid-spring semester), emergency financial aid funding provided in the Coronavirus Aid, Relief,and Economic Security Act, and flexible grading policies such as allowing students to opt for pass/faildesignation in lieu of a letter grade. Overall, three institutions – FSU, CSU, and SU – experienced slightdeclines in the second-year retention of the 2020 cohort.Exhibit 6Undergraduate Second-year Retention RatesFiscal SFSU2020CSUUBaltSUUMGC UMBC2021Source: University System of MarylandAnalysis of the FY 2023 Maryland Executive Budget, 202211
R30B00 – University System of Maryland – Fiscal 2023 Budget OverviewIn fiscal 2021, campuses operated at reduced capacity with a majority of courses still beingtaught remotely, which resulted in a decline in the second-year retention rate of the fiscal 2021 cohortat all institutions except BSU, which remained stable. UMES and CSU experienced the greatestdeclines of 15 and 7 percentage points, respectively. Overall, since the 2019 cohort, the retention ratehas declined at six institutions with a significant decline of 10 percentage points occurring at CSU.These declines erased improvements at some campuses.A unique challenge facing institutions in the current academic year is that the institutionsessentially had two new classes coming to campus in fall 2021 – freshmen and sophomores. While thesophomores have completed a year of college, it was done remotely, and they did not get to have thetypical on-campus experience and may need assistance in adjusting to campus life such as learningwhat academic resources are available, attending in-person classes, and engaging in campus life. Ifinstitutions are not successful in engaging the sophomores, it will impact their third-year retention andgraduation rates.The Chancellor should comment on efforts being taking by institutions to assistsophomores to adjust to campus life to ensure their success in achieving a degree.Graduation RatesIn order to provide a more complete picture of how institutions are performing, USM calculatesits six-year graduation rate for all new degree-seeking students enrolled during the fiscal year. Unlikethe traditional graduation rate used by the Maryland Higher Education Commission, which only tracksthe completions of traditional first-time/full-time students (which only captures the success of about athird of USM students), USM’s method also includes part-time students, transfers, spring enrollments,and those who stopped out or changed enrollment status. The inclusion of these additional studentsprovides a more complete picture of an institution’s performance. Furthermore, the graduation rates offiscal year cohorts tends to be higher than the traditional rate at institutions that have a greater portionof transfers and part-time students, such as CSU and UBalt. In addition, using a fiscal year cohortallows for a calculation of a six-year rate for UMGC, which is excluded from the traditional measuredue to its unique student population of mainly adult nontraditional students.Exhibit 7 compares the six-year graduation rate of the fiscal 2011 and 2016 cohorts. Overall,the graduation rate increased at all institutions except UMES which declined by 3 percentage points.UMBC experienced the greatest increase of 8 percentage points to 73% with the 2016 cohort. WhileUMGC’s six-year rate increased to 29% with the 2016 cohort, it is the lowest of all the institutions andis more comparable to the two-year graduation rates of Maryland community college transfer studentsat other institutions. This is not surprising, given that transfer students comprised 89.8% of UMGC’snew undergraduate enrollment in fiscal 2016. Furthermore, 77.0%, or 28,777, of UMGC’sundergraduate students in fall 2015 were part-time students who take longer to graduate.Analysis of the FY 2023 Maryland Executive Budget, 202212
R30B00 – University System of Maryland – Fiscal 2023 Budget OverviewExhibit 7Fiscal Year New Student Cohort Graduation Rates Six Years from EntryFiscal 2012 and 2016 U2011CSUUBaltSUUMBC UMGC2016Source: University System of MarylandUndergraduate Degree ProductionIn order to produce a well-educated workforce and maintain the State’s 55% degree attainmentgoal, USM will need to increase the number of undergraduate degrees awarded. Exhibit 8 comparesthe number of undergraduate degrees conferred by institution between fiscal 2010 and 2021. Overall,between fiscal 2010 and 2021, degree production grew by 42.1%, to a total of 28,354. During that time,the number of workforce-related degrees (science, technology, engineering, and mathematics (STEM);health; and cybersecurity) increased by 61.3%, or 10,413 degrees, Conversely, the number of otherdegrees conferred fell by 2,009 degrees (15%). When excluding UMGC, BSU and UMBC experiencedthe largest growth rate, of 45.4% (275 degrees) and 38.0% (728 degrees), respectively.Three institutions – CSU, UBalt, and UMES – experienced declines in the number of degrees conferred,ranging from 9.3% at UBalt to 17.1% at UMES, which reflects the continuing enrollment declines atthese institutions.Analysis of the FY 2023 Maryland Executive Budget, 202213
R30B00 – University System of Maryland – Fiscal 2023 Budget OverviewExhibit 8Undergraduate Degrees Awarded by Workforce and OtherFiscal ,0000UMBUMCP BSU2010 WorkforceTUUMES2010 OtherFSUCSUUBalt2021 WorkforceSUUMGC UMBC2021 OtherNote: Workforce degrees include science, technology, engineering, and mathematics; health professionals; andcybersecurity. Degrees awarded by UMGC in 2020 are not comparable to 2010 due a change in the U.S. Department ofEducation reporting requirements; since online courses are now administered stateside, all degrees are included in the total.Source: University System of MarylandFiscal 2022Proposed DeficiencyThe fiscal 2023 budget includes two proposed deficiency appropriations that would provide atotal of 1.0 million in general funds: 0.5 million for UMBC to establish the Maryland Institute forInnovative Computing to expand the Maryland Technology Internship Program; and 0.5 million forBSU to backfill funding. Another proposed deficiency totaling 45.5 million, of which USMinstitutions’ share is 43.9 million, would replace general funds with the HEIF, reflecting the revisedrevenue estimate in fiscal 2022 and use of HEIF fund balance.Federal Stimulus FundsUSM institutions received a total of 574.2 million from three federal relief packages, as shownin Exhibit 9, of which 210.8 million and 97.6 million were designated for financial aid andHistorically Black Colleges and Universities (HBCU), respectively. A majority of the funds, 50%, or 289.7 million, are to be expended in fiscal 2022, of which 249.1 million was brought in through afiscal 2022 budget amendment. The fiscal 2023 allowance includes 31.5 million in Higher EducationEmergency Relief Funds (HEERF) III provided in the American Rescue Plan, of which 31.0 millionis from the funding designated for HBCUs – 20.3 million for UMES and 10.7 million for CSU.Analysis of the FY 2023 Maryland Executive Budget, 202214
Exhibit 9Summary of HEERFFiscal 2020-2023( in Thousands)20212022Analysis of the FY 2023 Maryland Executive Budget, 202215HEERF IHEERF IHEERF IIHEERF IIIHEERF IFinancial AidInstitutional AidSIPHBCUTotal 29,12720,056381,003 50,225 10,17424,28027119,011 53,737 36,81479,1023283,142 119,386 8,79920,75800 29,557 01051002,500 2,705Total by TypeHEERF I*HEERF IIHEERF IIIGrand Total 106,666169,539297,984 574,190HEERF I: Coronavirus Aid, Relief, and Economic Security ActHEERF II: Coronavirus Response and Relief Supplemental Appropriations Act of 2021HEERF III: American Rescue PlanSIP: Strengthening Institution Programs*UMGC did not use 5,281Source: University System of MarylandHEERF II 7,17821,0847,85714,035 50,1532023HEERF IIIHEERF III 118,73790,73059026,832 236,889 0048031,059 31,539Total 210,828256,1159,66497,583 574,190R30B00 – University System of Maryland – Fiscal 2023 Budget Overview2020
R30B00 – University System of Maryland – Fiscal 2023 Budget OverviewAs shown in Exhibit 10, of the funds not required to be used for financial aid, in fiscal 2021,the majority of funds were used to cover revenue losses. In fiscal 2022, 63.6% of the funds designatedfor institutional aid were used to cover revenue loses. However, in fiscal 2022, a greater portion is beingused for other areas than occurred in fiscal 2021, including COVID-19-related expenses (18.9%) andfinancial aid (12.3%). Of the HBCU-specific funds, 41.4% and 26.3% are being used for technologyand COVID-19-related costs, respectively.Exhibit 10Spending of HEERF Flexible FundingFiscal 2021-20222021InstitutionalAidRevenue LossTesting, PPE,COVID-19and lFinancial AidTotal 11.5%6.7%5.2%41.4%51.5%1.4%9.2%12.3%25.1% 124,140,488 22,153,249 599,070 111,918,339 43,367,415 8,546,721HBCU: Historically Black Colleges and UniversitiesHEERF: Higher Education Emergency Relief FundsPPE: personal protective equipmentSIP: Strengthening Institution ProgramsSource: University System of Maryland; Department of Legislative ServiceProposed BudgetAs shown in Exhibit 11, the adjusted fiscal 2023 State funds for USM increase 299.3 million,or 19.1%, compared to the adjusted fiscal 2022 budget. Restricted funds decline 222.0 million, or12.9%, reflecting the expending of a majority of the federal relief funds in fiscal 2022. Overall, totalfunds decrease 63.1 million, or 1.0%, reflecting a decrease of 148.2 of pay-as-you-go funds. Whenexcluding these funds, total funds increase 85.1 million, or 1.4%, over fiscal 2022.Analysis of the FY 2023 Maryland Executive Budget, 202216
R30B00 – University System of Maryland – Fiscal 2023 Budget OverviewExhibit 11Proposed BudgetUniversity System of MarylandFiscal 2021-2023( in Millions)2021Actual2022Adjusted2023AdjustedGeneral FundsDeficiency – HEIF SwapDeficiency – BSU/UMBCGeneral Salary IncreaseHBCU Settlement FundsTotal General FundsSpecial FundsHEIFDeficiency – HEIF SwapTotal HEIFCRF – HBCU Settlement FundsTotal State Operating FundsTotal State PAYGOOther Unrestricted FundsCARES/CRRSSA/ARP –Direct Federal SupportCARES Act – IndirectTransfer (to)/from Fund BalanceNet Unrestricted Funds(excluding PAYGO)Restricted FundsCARES/CRRSSA/ARP –Direct Federal SupportCARES Act – IndirectState Special Funds (Restricted)Total Restricted FundsTotal Funds 1,427,526 1,411,426-43,9271,00069,8780 1,438,377 1,536,454 108,938 77,903 0 1,505,430 0 2,696,176 84,35343,927 128,280 0 1,566,658 213,203 3,019,102 108,938 16,000 1,865,988 65,000 1-20,049 4,243,656 1,431,093 4,578,391 1,445,635 4,885,556 1,461,062 307,165 15,427140,2126,45230,773 1,608,530 5,852,186269,25809,605 1,724,498 6,516,09231,53909,873 1,502,473 6,453,029-237,719268- 222,024- 63,063-12.9%-1.0%Total Funds Excluding PAYGO 5,852,186 6,302,889 6,388,029 85,1401.4%0 1,427,526 77,903198,2556,342 1,741,0512022-2023Change 125,02843,927-1,000128,3776,432 302,673 24,584-43,927- 19,343 16.000 299,331-148,203 32,227% ChangePrior Year8.9%21.0%29.1%-15.1%19.1%1.1%-3,904ARP: American Rescue PlanCARES: Coronavirus Aid, Relief, and Economic SecurityCRF: Cigarette Restitution FundCRRSSA: Coronavirus Response and Relief Supplemental Appropriations ActHBCU: Historically Black Colleges and UniversitiesHEIF: Higher Education Investment FundPAYGO: pay-as-you-goAnalysis of the FY 2023 Maryland Executive Budget, 2022176.7%1.1%
R30B00 – University System of Maryland – Fiscal 2023 Budget OverviewNote: The fiscal 2022 working appropriation is adjusted to reflect general salary increases, increments, one-time bonus,and deficiency. The fiscal 2023 allowance is adjusted to reflect the annualization of fiscal 2022 general salary increases andincrements and fiscal 2023 3% general salary increase and increments. These actions are budgeted within the Departmentof Budget and Management Statewide Expenses. The fiscal 2023 general funds include 2.5 million are restricted funds forUMB. The 65.0 million in PAGYO in fiscal 2023 is budgeted within the Dedicated Purpose Account.Source: Governor’s Fiscal 2023 Budget Books; Department of Legislative ServicesAs shown in Exhibit 12, State funds increase 299.3 million, with salary enhancements forgeneral salary increases effective July 2023 and annualization of the fiscal 2022 general salary increaseand increments accounting for 42.9%, or 128.4 million of the growth. The allowance also provides: 93.8 million to restore the remaining portion of the fiscal 2021 BPW reduction, of which 20.0 million is to be used to expand and enhance student mental health services. The remainingfunds will be used to restore base cuts to various areas including financial aid, facilities renewal,student services, and technology. In fiscal 2022, USM received 23.5 million as a partialrestoration, to fund public health and health care programs at various institutions. Combined,these additions fully restore the 117.3 million of reduction actions for USM approved by BPWin fiscal 2021; 25.3 million related to statewide cost allocations with a majority of the increase related tohealth insurance; and 6.1 million for other purposes, including 3.7 million for the opening of new facilities atUMCP, UMES, FSU, and CSU; 2.5 million in restricted one-time general funds provided toUMB for an endowment for the new Miller Center for Democracy and the law school; and 0.4 million to UBalt to expand the operations at the Schaefer Center.Analysis of the FY 2023 Maryland Executive Budget, 202218
R30B00 – University System of Maryland – Fiscal 2023 Budget OverviewExhibit 12Use of State Funding IncreaseFiscal 2023( in Thousands)HBCU: Historically Black Colleges and UniversitiesSource: Department of Budget and ManagementThe allowance also includes 45.7 million in State funds for several mandates: 22.3
R30B00 - University System of Maryland - Fiscal 2023 Budget Overview Analysis of the FY 2023 Maryland Executive Budget, 2022 3 A portion of the increase in general funds in fiscal 2023 ( 93.8 million) restores the remaining fiscal 2021 Board of Public Works (BPW) reduction. The fiscal 2023 budget includes two additional proposed deficiency appropriations that would