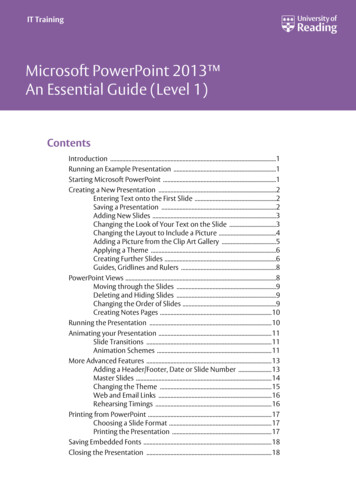
Transcription
Average Directional Movement (ADX) ADX is a Wells Wilder study ADX is a derivative of Directional Movement Indicator (DMI) ADX is a volatility indicator.– ADX measures strength of trend, independent of direction.– DMI provides the direction when used in conjunction.
ADX TradingThere are 4 basic methods of using the study: The first is as a break out by stating that the ADX has risenthrough 20 or 25. The second is for trend exhaustion. The ADX is above 45and now turns downwards. The third is for acceleration. The ADX rises in value bymore than 3 between the previous bar and the current bar. The fourth is in conjunction with the DMI and is when theADX crosses above the higher valued DMI line.
ADX Trading 2 For system creation, remember that a sharp change to anew trend from a previous trend will not be picked by theindicator and that a falling ADX can be a good filter forcreating sideways systems, especially if you create upwardlimits on its value. The calculation is:ADX -MA[ABS(( DI-(-DI))/( DI (-DI))), Smo, N]where n the number of periods used in the calculationi.e. ADX is smoothed average of absolute value of ( DI-(DI))/( DI (-DI))
Directional Movement IndexThe best application of DMI is present when used with another indicator. DMI should either confirm orcontradict the indicator being used. It is also best to use DMI in long-term trade situations. Because thestudy is not as sensitive as other indicators it is appropriate to use it as a confirmation tool. When the DMIis advancing, the average is higher on the 0 to 100 scale, trend following systems are best employed.Likewise with a decreasing DMI average, the line is lower on the scale closer to 0, a counter trend systemmight be best. These traits represent the fact that as the average line goes higher in the scale the strengthof the trend is gaining, and as the ADX goes lower the trend is loosing strength. It is also important to lookat the individual lines for changes in price movement.The other application for DMI is to look at the D and D- lines themselves. When the D line crossesabove the D- line a buy signal is initiated. This indicates that the positive price direction is greater than thenegative. Conversely, once the D line crosses below the D- line, a sell trigger is present. The negativeprice movement is overtaking the positive.Welles Wilder himself said that he was not comfortable using these two lines by themselves. So whenlooking at reversals the ADX should be above both lines and once it turns lower we should see a change inmarket direction. One should also look to ADX for confirmation. For a good sell signal, the D should begreater than D- and both should be greater than ADX ( D D- ADX ). For a good buy signal, D shouldbe lower than D- and both should be lower than ADX ( D D- ADX ).This application is much the same as momentum showing a change in the market sentiment. Wilder alsosays that a trend following system should not be used when the ADX line is below both D lines, as thismeans that the market has no discernable direction.When using the D and D- crossover method, Wilder stresses the use of an extreme point. On the day thecrossover occurs, the extreme point is the high or low of the day, (high for a buy, and low for a sell). Themarket should be able to take out that price and stay beyond it for several days before the trade is initiatedor exited. This use of extreme points should keep the trader from getting into whipsaws or false breakouts.
Directional Movement Index There are 4 basic methods of using the study: ·The first is as a break out by stating that the ADX has risen through 20 or 25.·The second is for trend exhaustion. The ADX is above 45 and now turns downwards.·The third is for acceleration. The ADX rises in value by more than 3 between the previous barand the current bar.·The fourth is in conjunction with the DMI and is when the ADX crosses above the higher valuedDMI line. For system creation, remember that a sharp change to a new trend from a previous trend will not bepicked by the indicator and that a falling ADX can be a good filter for creating sideways systems,especially if you create upward limits on its value. The calculation is: ADX -MA[ABS(( DI-(-DI))/( DI (-DI))), Smo, N]- where n the number of periods used in the calculation i.e. ADX is smoothed average of absolute value of ( DI-(-DI))/( DI (-DI))
Bollinger Bands (BBnds) Bollinger Bands are a 20 bar moving average and two bands whichrepresents 2 standard deviation above and below the moving average. The market will trade most of the time between the bands. The price at the lower band represents lower price and usually tradesto the moving average or the higher band. The price at the higher band represents a high price and usually tradeslower to the moving average or the lower band. Difference between the bands represents volatility. Low volatility, narrow band difference, represents an agreement by thetraders that the price is at a level it ought to be at. Trader agreement. High volatility, wide band difference, represents a varied opinion oftraders where the price should be at. Trader discord.
Bollinger and Bollinger Band Difference
Directional Movement Index (DMI) Directional Movement Index is a Wells Wilder indicator. In a DMI study, two lines are generated: DMIu and DMId. The first linemeasures positive (upward) movement or buying pressure and thesecond number measures negative (downward) movement, reflectingselling pressure. The DMIu line crossing over the DMId line isinterpreted as a buy signal, and the DMIu line crossing below the DMIdline is considered a sell signal. Wilder also suggests that when a crossover occurs, the extreme price(the high or low made during the trading interval of the crossover) canbe interpreted as a reversal point. This study is best used in any trending markets.
DMI with ADX
Volume and Open Interest Volume is the number of future contracts or shares ofstocks which are sold in a trading session. We refer to sales because on the trading floor it was theseller who had to report the transaction to the exchange fottrade matching. Open Interest is the number of futures contracts held openovernight. In futures there is not a finite number of contract like thereis in the equities market. If you have a willing buyer and awilling seller, you create a new contract and increase openinterest.
1 800-525-7082 www.cqg.com
Bollinger Bands (BBnds) Bollinger Bands are a 20 bar moving average and two bands which represents 2 standard deviation above and below the moving average. The market will trade most of the time between the bands. The price at the lower band represents lower price and usually trades to the moving average or the higher band. The price at the higher band represents a high price .