Transcription
Q3 FY2021
VISIONTRANSFORMATIVEPARTNER FOR OUR CUSTOMERS, APOSITIVE FORCE IN OURTO BE THECOMMUNITIES AND EARNEXCEPTIONAL RETURNS2
Domestic leader in flat rolled steel processing Global leader in pressure cylinders Domestic leader in suspension ceiling solutions(WAVE) Market-leading joint ventures serving buildingproduct & automotive end-markets Consumer Products Industrial ProductsNET SALES OF 2.8 BILLIONLTM 02/28/2021LTM Financial Metrics (Q3 FY2021): Sales: 2,805 million Adj. EBITDA: 364 million Corporate Credit Ratings: BBB / Baa3 8,000 employees & 4,500 customers; 50 facilities in 7 countries Primarily non-union facilities Employee, customer, supplier and investor-centered philosophy3
CORPORATE CITIZENSHIP & SUSTAINABILITYLong history of keeping employees safe, practicing good citizenship and protecting the environmentFiscal Year 2020 HighlightsFor more information on our Corporate Citizenship & Sustainability efforts, please see our first annual CorporateCitizenship & Sustainability Report located on the “Governance” page of our Investor Relations website atir.WorthingtonIndustries.com4
MANUFACTURED 83MMCYLINDERS &ACCESSORIES(FY20) SOLD IN 90 COUNTRIES LARGEST PURCHASER OF FLATROLL STEEL BEHIND AUTOMAKERS 5
BROAD MANUFACTURING FOOTPRINT50 OPERATING LOCATIONS AS OF 03/15/21STEEL PROCESSINGPRESSURE CYLINDERSJOINT VENTURES (50%)UPDATED MARCH 20216
2.8B TRAILING 12 MONTH NET SALES02/28/2021NET SALES BY END-MARKETSOPERATING/EQUITY INCOME BY SEGMENT TTM* 282.0 strialAgricultureOil & Gas EquipmentConstructionConsumer ProductsHeavy TruckOtherSteelCylindersWAVE / Other / JVs* Excludes restructuring, non-recurring, and impairment.7
759M Q3 SALES02/28/2021NET SALES BY END-MARKETSOPERATING/EQUITY INCOME BY SEGMENT QTD* 108.9 rialAgricultureOil & Gas Equipment38%ConstructionConsumer ProductsHeavy TruckOtherSteelCylindersWAVE / Other / JVs* Excludes restructuring, non-recurring, and impairment.8
PROFILESTEEL PROCESSINGAUTOSALES BY END MARKETTTM 02/28/2021 1.7BWholly-OwnedConsolidated JVsTTU IROENCAOGNRSI TCRUUL CUnconsolidated JVsAutomotive53%25 FACILITIESin North America(8 wholly owned / 17 JV Owned)Other14%CORE PRODUCTSAGRICULTURECarbon flat rolled steel processing - Broad range of metalproducts in sheet, coil and strip configurations, as well as anumber of processing capabilities from specialty coatingsand annealing, to pickling, slitting and blanking.Tailor welded products – Offering tailored products forlightweight and safety critical components through 55%owned JV (TWB). Capability to process multiple types ofmaterials offering tailored blanks, tailor welded coils,aluminum tailor welded blanks, and hot formed tailor weldedblanks.Construction21%Heavy Truck4%Agriculture8%HEAVY TRUCK9
PROFILEPRESSURE CYLINDERSSALES BY SBUTTM 02/28/2021 1.1BIndustrial Products50%14 FACILITIESin North America and EuropeOil & GasEquipment*3%CORE PRODUCTSConsumer Products47%Industrial Products - Broad line of pressure cylindersand tanks for industrial gas storage and transportationincluding the growing sustainable mobility markets forhydrogen and compressed natural gas.Consumer Products – Market-leading brands withproducts for outdoor living, niche tools, and watersystem solutions.*Oil & Gas Equipment business divested 01/29/211 0
PROFILEWAVE(50% JV)CORE PRODUCTSCONTRIBUTION TO WI EQUITY INCOME ( M) 78 71 54 336 facilitiesin North AmericaFY05ProductFY15FY20* FY20 excludes the 23.1M gain related to the sale of WAVE’sforeign assetsMARKETSSustainable revenue and EBITDAgrowth with creative fabricatedarchitectural metal components,focusing on superior customer value,industry leading manufacturing, andtalent development resulting in low costconstruction and enterprise efficienciesFY10PriceOVER 850Min dividends paidOperationsServiceto Worthington in past 10 yearssince start of FY 20111 1
SUCCESSFULJOINT VENTURESServing building product and automotive end marketsOVER 1.0Bin dividendsreceivedfrom JVs in past 10 years sincestart of FY 2011 Successful JV portfolio built with trusted partners who help make abusiness better versus the alternative of going solo JVs managed to produce regular cash dividends that closelyapproximate sOwnershipCreatedArchitectural and acoustical gridceilings50%1992Steel processing in Mexico50%2007Automotive tooling and stamping50%2011Metal framing for commercialconstruction25%20111 2
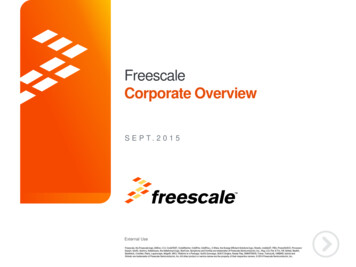
MEANINGFUL JV EARNINGSUnconsolidated JVs managed to produce regular cash dividends that closely approximate earnings MILLIONSDIVIDEND to WII(CASH FLOW) 160EQUITY EARNINGS* 140 120 113 110 103 100 101 96 101 102 80*ExcludesRestructuring andImpairment Charges 81 79 90 78 60 66 40 20 0Equity Earnings MILLIONS20172018201920209M FY209M FY21WAVE (50%) 78.3 77.5 82.3 78.0 62.6 54.4ClarkDietrich (25%) 17.3 9.8 8.6 17.2 13.9 16.2Servicero (50%) 7.2 8.8 8.1 1.3 2.4 7.4Artiflex (50%) 7.0 4.9 2.0 2.7 3.0 2.9Other 0.2 2.1 0.1( 3.2)( 3.1) 0.0 110.0 103.1 101.1 96.0 78.8 80.9Total Equity EarningsNote: FY19 dividends shown above exclude 60M received from WAVE related to a special dividend and cash proceeds from the sale of international operations. FY20 excludes 10M received from WAVE international proceeds.FY19 Equity Earnings excludes a 4.0M impairment for CR Steel China JV and FY20 excludes a 4.3M impairment for CR Steel China JV and a 23.1M gain for the sale of WAVE’s foreign assets.1 3
GROWTHSTRATEGYWorking together using technology, analyticsand automation enables us to deliver Successful innovation, transformation,and acquisitions that drive valuefor customers and earn exceptional returns forour shareholders.All with Our Philosophy at the center.1 4
COMPLEMENTARY VALUEDRIVERS ARE WELL ad based business systemfocused on:Innovation as a discipline:Focus on the core: New product development Consolidate higher value add markets Product design & engineering Build out product offerings withadjacencies Data-driven decision making Optimizing value streams andeliminating waste Discovering new capabilities throughagile teams One system, driven by everyone, notjust a central tiger team Voice of customer & market research Target industries/sectors we know Incorporating advanced technologies Focus on higher margin / high cashflow businesses Strong target evaluation process, duediligence and integration to achievesynergies1 5
VALUE DRIVERS IN ACTION: TRANSFORMATIONData driven LEAN events to improve our businessesExample of Transformation project at cylinder facilityconducted during pandemicIssue: Strong demand for Coleman and Bernzomatic camping gastanks required transformation efforts to increase production in order tomeet customer demandWhat we did to drive improvements: Utilized data analytics from smart factory software to identifygreatest opportunity for production improvements Identified coil change over time at presses as best opportunity Improved collaboration and implemented standard work acrossall 3 shifts Employed special safety measures including physical distancingand virtual participants demonstrating the power oftransformation even during the pandemic Instilled transformational culture with local team empoweringthem to drive future productivity improvementsWHAT WE ACHIEVED:47%Reduction in average coilchangeover time500KAnnual increase incylinder ost-Event1 6
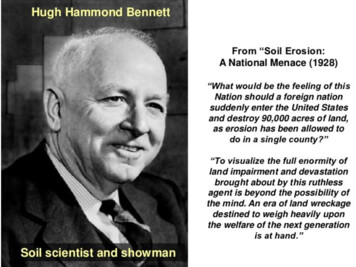
VALUE DRIVERS IN ACTION: INNOVATIONFocused effort has resulted in a growing pipeline of new productsFUEL GAUGESMARTLID COMFORT CARRY FOR CAMPING CYLINDERSINTEGRATED MONITORING SOLUTIONPROPANE TANKCheck propane levels remotelyfor home & industrial heatingEasier to handle, more attractive tankAvailable at U-HaulCheck fuel levels to avoid running outAvailable at Walmart
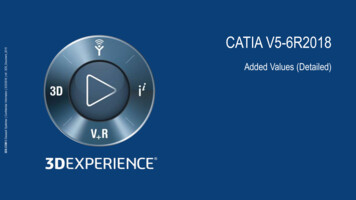
VALUE DRIVERS IN ACTION: INNOVATIONFocused effort has resulted in a growing pipeline of new productsCLEAN CANNABISEXTRACTION CYLINDERMeets need for a cleaneralternative to carbon steelMAX9 BUNDLE Holds 25% more industrial gasthan traditional bundleFOURTIS TYPE IVPROPANE CYLINDERHeating & cooking indoors globallyLightweight & fully recyclable
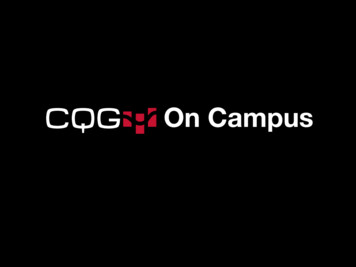
VALUE DRIVERS IN ACTION: INNOVATIONFocused effort has resulted in a growing pipeline of new productsARMSTRONG VIDASHIELDUV24 AIR PURIFICATION SYSTEM
VALUE DRIVERS IN ACTION: M&AAcquired General Tools & Instruments on January 29, 2021 which complements our existing strong brands inconsumer products and expands our reach in niche tools and outdoor living Attractive financial returnsMarket leader for feature-rich, specialized tools – Over 1,200 products Complementsexistingconsumer brands; Expands product offering in niche tools and outdoor livingInvestmentThesis 115 million purchase price Deepens relationships with long-term blue chip customers including big box retailers and online sales Proven new product development process with demonstrated agility and speed to market 68.2 million in revenue, 15.2 millionAdjusted EBITDA (CY20) Management team with expertise in managing a global supply chain will continue to run the business Financed with existing cash Solid platform ripe for growth through innovation, new product development and bolt-on acquisitionsEnvironmentalHeath & SafetyOutdoor LivingNiche ToolsCelebrationsHome Repair &RemodelingPrecision Measurement& LayoutWater ProductsLawn & GardenSpecific Purpose Tools2 0
RECENT TRANSACTIONS THAT WILL IMPROVE OURFINANCIAL PERFORMANCE AND STRENGTHEN LIQUIDITY Divested Oil & Gas Equipment business Exited non-core, loss-making operations in January 2021 Received nominal consideration at closing with the opportunity for additionalconsideration in the future Retained real-estate assets in Bremen, OH and Tulsa, OK PTEC Pressure Technology Acquisition Acquired German valve and component company in January 2021 for 10.8 million Adds products adjacent to core pressure cylinders business, providing morecomprehensive systems for the storage, transport and use of alternative fuels likehydrogen and compressed natural gas Monetized Nikola Corp (NKLA) Investment Exited NKLA investment in January 2021 generating pre-tax cash proceeds of 146.6million on remaining shares Cumulative pre-tax cash proceeds of 634.4 million realized in fiscal 2021 Divested Structural Composites Industries business Divested loss-making operations in March 2021 for cash proceeds of approximately 20.0 million2 1
F IN A N CIA L G O A L S GROW EBITDA & FREE CASH FLOW EVERY YEAR 10% RETURN ON CAPITAL RAISE MARGINS REDUCE EARNINGS VOLATILITY BALANCED CAPITAL ALLOCATION MODEST LEVERAGE / AMPLE LIQUIDITY(INVESTMENT GRADE) RIGOROUS CAPITAL DISCIPLINE2 2
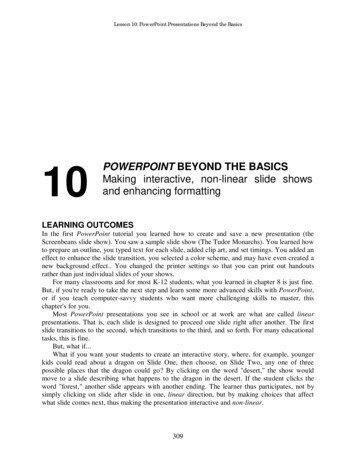
STRONG CAPITAL STRUCTURE & LIQUIDITYStrong balance sheet with investment grade credit ratings and significant liquidity available enables financialflexibility and shareholder returns600500 Millions400300 500200 250100 200 150Debt 282029 38 36 36020302031203220332034Revolver*L 1.25%FIXEDRATEPrivatePlacement4.60%Public Bond4.55% PrivatePlacement1.56% PrivatePlacement1.82%Public Bond4.30% PrivatePlacement1.90%*Revolving Credit facility undrawn as of 02/28/212 3
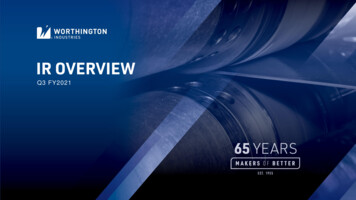
BALANCEDCAPITAL ALLOCATION STRATEGYStrong cash flows and significant liquidity support balanced approach to capitalallocation focused on growth and rewarding shareholdersCAPITALEXPENDITURES Reinvest in the business to create value and supportgrowthOVER 3 BILLION OF CAPITALDEPLOYED SINCE FY2011( millions) FY2021 nine months CapEx of 65.3 million 1,161 1,054ACQUISITIONSDIVIDENDS Focus on core businesses and selectively grow intonew markets Focus on higher margin / high cash flow businesses 753 479 Dividend paid quarterly since becoming a publiccompany in 1968 Eleven consecutive years of dividend increasesSHAREREPURCHASES Opportunistic approach has reduced share count 35%since start of FY epurchases 10.0 million shares remaining on on based on financials from FY 2011 to FY 2021 Q32 4
CONSOLIDATED RESULTSFY2019FY20209M FY20209M FY2021 3,760 3,059 2,447 2,193Adjusted EBITDA* 330 300 233 297% of sales8.8%9.8%9.5%13.5%Operating Income* 142 115 93 162% of sales3.8%3.8%3.8%7.4%EPS* 2.60 2.39 1.90 2.94Avg Invested Capital 1,628 1,532 1,536 1,527ROIC (Adj. EBIT/Avg. Inv. Cap.)14.4%13.6%14.2%20.2%( 4)( 20)( 21) 25( 0.06)( 0.27)( 0.28) 0.34 millions, except EPSSalesInventory Holding Gains / (Losses)ImpactEPS Impact*Adjusted for restructuring and non-recurring items. See supplemental data schedules in appendix for reconciliation of adjustments.2 5
KEY INVESTMENT HIGHLIGHTSWorthington offers an attractive investment opportunity Growth strategy focused on value drivers of innovation,transformation and acquisition to enhance margins Solid free cash flow and ample liquidity to execute onstrategy Rigorous capital discipline focused on high cash flowinvestments Balanced approach to capital allocation focused oninvesting for growth and rewarding shareholders2 6
SUPPLEMENTAL DATA2 7
SUPPLEMENTAL DATACONSOLIDATED ADJUSTED EBITDA / FREE CASH FLOWFY 19A nnualNet IncomeInterest ExpenseT axesEBITD&A EBITDARestructuring and non recurring EBITDA A djusted Stock based compensationUndistributed JV earningsInterest ExpenseIncome taxesNet (gain) loss on sale of assetsMinority interestChange in working capitalO therCash Flow from O perationsCapital spendingFree Cash Flow 153.538.143.2234.795.6FY 20A nnual FY 209M78.831.626.3136.892.7 330.3 (0.8)229.470.8329.5300.3 FY 219M62.624.220.5107.369.6 176.856.1 847.4(550.3) 232.9 297.1 11.77.3(38.1)(25.7)(7.1)9.8(98.9)9.3197.9 (84.5)11.98.1(31.6)(27.7)(5.1)5.658.716.5336.7
28.02.2021 · Lawn & Garden Specific Purpose Tools . FINANCIAL PERFORMANCE AND STRENGTHEN LIQUIDITY Divested Oil & Gas Equipment business Exited non-core, loss-making operations in January 2021 Received nominal consideration at closing with the opportunity for additional consideration in the future Retained real-estate assets in Bremen, OH and Tulsa, OK PTEC Pressure