Transcription
August 2022Voya Global PerspectivesMarket. Insights. Opportunities. CN1483104 0122Voya Global Perspectives 20220112-1985590-6113950
2022 Forecast20220112-1985590-6113950Voya Global Perspectives 2
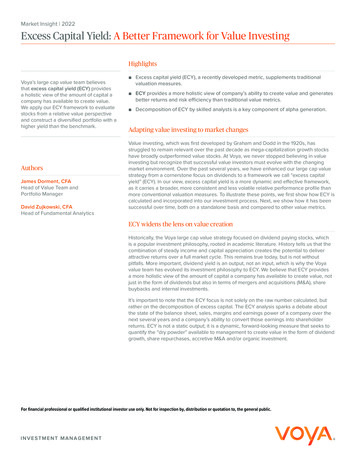
Advancing Earnings Drive the MarketCorporate earnings growth is a barometer for the health of the global economy.Source: Refinitiv – Thomson Reuters and FactSet, Voya Investment Management. Earnings per share (EPS) is the portion of a company’s profit allocated to each outstanding share of common stock. The S&P 500 index is a gaugeof the U.S. stock market that includes 500 leading companies in major industries of the U.S. economy. Past performance is no guarantee of future results. Indices are unmanaged and not available for direct investment.Please review important disclosures in the back of this book.20220112-1985590-6113950Voya Global Perspectives 3
Broadening ManufacturingGlobal Manufacturing PMIsU.S. Industrial Production6611062Index Level5452.80 U.S.49.79 Euro49.00 China504642Index LevelExpansionary ( 50)58Contractionary ( rce: Institute of Supply Management, FactSet. The Purchasing Managers' Index (PMI) is an indicator of economic activity in the manufacturing sector. Measures above50 indicate economic expansion, measures below 50 indicate economic contraction. PMI’s as of 7/29/22, Industrial Production as of 6/30/22.20220112-1985590-6113950Voya Global Perspectives 4
Consumer as Game ChangerAt about 70% of gross domestic product (GDP), the U.S. consumer is a game changer.700680.59 Billionsper month6506005505004504003502012U.S. Retail Sales2015201720202022Source: FactSet. U.S. retail sales as of 6/30/2022.20220112-1985590-6113950Voya Global Perspectives 5
DiversificationGlobal effective diversification has beaten the S&P 500 over a long period of timeData as of 6/30/22.Source: FactSet, FTSE NAREIT, Voya Investment Management. The Overall Average model allocation includes 10 asset classes, equally weighted: S&P 500, S&P 400 Midcap, S&P 600 Smallcap, MSCI U.S. REITIndex/FTSE EPRA REIT Index, MSCI EAFE Index, MSCI BRIC Index, Bloomberg Barclays U.S. Corporate Bonds, Bloomberg Barclays U.S. Treasury Bonds, Bloomberg Barclays Global Aggregate Bonds, Bloomberg BarclaysU.S. High Yield Bonds. Returns are annualized for periods longer than one year. Past performance is no guarantee of future results. An investment cannot be made in an index.Please review important disclosures in the back of this book.20220112-1985590-6113950Voya Global Perspectives 6
A Plan for the Inevitable Bear Market beats “Stay the Course”Strategic and tactical allocation over 20 years shows that active management may add value especially in market downturns.TacticalGrowthStrategicS&P 500 Index 1Market FundamentalsS&P 500 Earnings GrowthTactical SignalPositive Earnings GrowthNegative Earnings GrowthSource: FactSet, Voya Investment Management. As of 12/31/21. Strategic allocation includes 10 asset classes, equally weighted: S&P 500, S&P 400 Midcap, S&P600 Smallcap, MSCI U.S. REIT Index/FTSE EPRA REIT Index,MSCI EAFE Index, MSCI BRIC Index, Bloomberg Barclays U.S. Corporate Bonds, Bloomberg Barclays U.S. Treasury Bonds, Bloomberg Barclays Global Aggregate Bonds, Bloomberg Barclays U.S. High Yield Bonds. Strategicallocation consists of the 10 asset classes above in a 60% equity/40% fixed income portfolio. Tactical allocation consists of the same 60% equity/40% fixed income portfolio, but reduces equity exposure from 60% to 30% onlywhen S&P 500 quarterly earnings growth is negative. Past performance is no guarantee of future results.An investment cannot be made in an index. Indices are unmanageable and not available for direct investment.20220112-1985590-6113950Voya Global Perspectives 7
Europe20 Years Europe Lags U.S. Markets4.5Growth of 4.03.5S&P 500MSCI EAFEBloomberg Global AggregateBloomberg US AggregateS&P 500 Index3.02.5MSCI EAFE index2.01.5Barclays U.S.Aggregate1.0Barclays Global Aggregate0.5'13'14'15'16'17'18'19'20'21'22Data as of 8/3/22. The S&P 500 Index covers 500 industrial, utility, transportation and financial companies of the U.S. markets (mostly NYSE issues). The Index represents about 75% of NYSE market capitalization and 30% ofNYSE issues. It is a capitalization-weighted index calculated on a total return basis with dividends reinvested. It is widely considered the benchmark for large-cap funds. The Bloomberg Barclays U.S. Aggregate Bond Index is awidely recognized, unmanaged index of publicly issued investment grade U.S. government, mortgage-backed, asset-backed and corporate debt securities. Index returns do not reflect fees, brokerage commissions, taxes or otherexpenses of investing. Indexes are unmanaged and not available for direct investment. The Bloomberg Barclays Global Aggregate Index is an unmanaged index that provides a broad-based measure of the global investmentgrade fixed-rate debt markets. Index returns do not reflect fees, brokerage commissions, taxes or other expenses of investing. Indexes are unmanaged and not available for direct investment. The MSCI Europe, Australasia andFar East (EAFE) Index is an unmanaged index that measures the performance of securities listed on exchanges in markets in Europe, Australasia and the Far East. Index returns do not reflect fees, brokerage commissions, taxesor other expenses of investing. Indexes are unmanaged and not available for direct investment.Source: FactSet, Russell Investments. Past performance is no guarantee of future results. An investment cannot be made in an index.Source: Trading Economics Dec 2, 201920220112-1985590-6113950Voya Global Perspectives 8
The FedThe U.S. Federal Reserve and other Central Banks are again expanding their balance sheets.Fed Balance Sheet ( )ECB Balance Sheet ( )Assets in Local Currency - Millions10,000BoJ Balance Sheet ( 19202020212022Source: FactSet, Voya Investment Management, as of 7/29/22. ECB European Central Bank; BoJ Bank of Japan, as of 7/29/22.20220112-1985590-6113950Voya Global Perspectives 9
U.S. Export, Import Growth (YoY % Change)U.S. trade is highly dependent on global economic 0092011(% 1YR) Exports20132015201820202022(% 1YR) ImportsSource: FactSet. Data as of 5/31/22.20220112-1985590-6113950Voya Global Perspectives 10
Housing25350S&P Case Shiller Housing Index2031630010Case-Shiller% (LHS)52500-5200Case-ShillerLevel (RHS)Index Level1-Year Case-Shiller % 3Source: FactSet, S&/P Case-Shiller as of 950Voya Global Perspectives 11
Inflation99.10 Headline CPI Y/Y8Percent (%)765.90 Core CPI Y/Y54.79 Core PCE Y/Y4321020182019202020212022Source: FactSet, Inflation as of 6/30/202220220112-1985590-6113950Voya Global Perspectives 12
JobsThe unemployment rate has slowly improved in line with economic nemploymentRate 0020016%InitialUnemploymentClaims (LH)200420062008201120134%201520172020Unemployment RateNew Weekly Claims16%Initial claims5 million2%2022Source: Bureau of Labor Statistics, FactSet. Initial unemployment claims as of 6/30/22 and unemployment rate as of 6/30/22.20220112-1985590-6113950Voya Global Perspectives 13
Dow Jones Industrials (price only — 100 years)It is not unusual for stocks to have prolonged periods of flat returns.40,00030,00020,000Log10,000Q1 2020GlobalPandemic4,0003,0002,000Tech Wreck Great2000-2002 Recession2007-20091,000400300200OPEC Oil Crisis100Pearl ta as of 7/29/22Source: Dow Jon5s, FactSet. Past performance is no guarantee of future results. Indices are unmanaged and not available for direct investment.Please review important disclosures in the back of this book.20220112-1985590-6113950Voya Global Perspectives 14
Index Total ReturnsData as of 6/30/22.Large-cap companies are typically firms with a market value of 10 billion or more. Investments in large-cap stocks may be considered more conservative than investments in small-cap or mid-cap stocks, potentially posing lessrisk in exchange for less aggressive growth potential. Mid-cap companies are typically businesses with a market value between 2 billion and 10 billion. Mid-caps offer more growth potential than large caps, and possibly lessrisk than small caps. Small-cap companies are typically those with a market value of 300 million to 2 billion. Small-cap stocks may be vulnerable to uncertainties characteristic of untried, burgeoning markets but may also offersignificant growth potential to long-term investors who can tolerate volatile price swings in the short term.Source: Dow Jones, Standard & Poor’s, NASDAQ, Russell Investments, FactSet. Note: All returns are total returns including dividends expressed as percentages. Returns for 3-, 5-, and 10-year periods are annualized. Pastperformance is no guarantee of future results. An investment cannot be made in an index. Please see index definitions and other important disclosures in the back of this book.20220112-1985590-6113950Voya Global Perspectives 15
The Fed ModelStock and Bond comparison translated into comparable valuations16Earnings Yield (solid forward, dotted trailing)14U.S. Treasury Yield (10 year)Percent (%)12Equivalent toP/E* of 17.410EPS Yield 5.74%864Equivalent toP/E* of 37.82T-Yield 2025Data as of 7/29/22.* P/E is Price/EarningsNote: Earnings yield is the inverse of the price to earnings (P/E) ratio and is calculated as the sum of the reported next 12 months’ earnings estimates divided by market capitalization. The price-earnings ratio (P/E ratio) is the ratiofor valuing a company that measures its current share price relative to its per-share earnings. The 10-year U.S. Treasury yield is used for bonds.Past performance is no guarantee of future results. An investment cannot be made in an index.Source: Standard & Poor’s, First Call, Reuters, Bloomberg, FactSet. Please review important disclosures in the back of this book.20220112-1985590-6113950Voya Global Perspectives 16
U.S. Consumer Confidence200180Index Level160140Present120100Total Index80U.S. 0-6113950Source: Factset. Consumer Confidence as of 7/29/2022Voya Global Perspectives 17
Performance by Market CapitalizationMid-cap stocks generally have grown faster than large caps since 2005 and growth over value.4.54.0(INDEX) Russell Mid Cap - Price(INDEX) Russell 1000 - Price(INDEX) Russell 2000 - PriceMid Cap2,000Large 0.02005Russell 1000 Growth Index1,800Small CapIndex PriceGrowth of 2,200Russell 1000 Value 5201720192021Data as of 8/3/22.Large-cap companies are typically firms with a market value of 10 billion or more. Investments in large-cap stocks may be considered more conservative than investments in small-cap or mid-cap stocks, potentially posing lessrisk in exchange for less aggressive growth potential. Mid-cap companies are typically businesses with a market value between 2 billion and 10 billion. Mid-caps offer more growth potential than large caps, and possibly lessrisk than small caps. Small-cap companies are typically those with a market value of 300 million to 2 billion. Small-cap stocks may be vulnerable to uncertainties characteristic of untried, burgeoning markets but may also offersignificant growth potential to long-term investors who can tolerate volatile price swings in the short term.Source: FactSet, Russell Investments. Note: growth of 1 and annualized 10-year returns are based on the Russell 1000 Index for large cap, the Russell Midcap Index for mid cap and the Russell 2000 Index for small cap. Pastperformance is no guarantee of future results. An investment cannot be made in an index. Please review important disclosures in the back of this book.20220112-1985590-6113950Voya Global Perspectives 18
The FedFed Funds Target Rate10Percent 2Source: FactSet, Fed Funds Target Rate, data as of 7/29/2022. Average Fed Funds Rate is average since 1988.20220112-1985590-6113950Voya Global Perspectives 19
Equity Volatility (VIX)Volatility tends to spike when investors get complacent after long periods of low vol87Index Level4012/31/07 22.511/20/08 80.912/31/08 40.08/2/22 23.93Lehman CrisisEuro CrisisU.S. Brexit353025Historical 2022Data as of 8/2/2022.Note: The VIX is the ticker symbol for the Chicago Board Options Exchange (CBOE) Volatility index, which shows the market’s expectation of 30-day volatility. It is constructed using the implied volatilities of a wide range of S&P500 index options. Investors cannot invest directly in an index. Past performance is no guarantee of future results.Source: Standard & Poor’s, Chicago Board Option Exchange, FactSet.20220112-1985590-6113950Voya Global Perspectives 20
Bond and Loan ReturnsLong-term U.S. Treasurys have been winners in periods of uncertainty.Data as of 6/30/22.Investment Grade bonds are bonds that have an investment grade rating of Baa or higher from Moody's Investors Service, a rating of BBB or higher from Standard & Poor's or both and typically have a lower risk of credit default.High Yield bonds are higher paying bonds with a lower credit rating than investment grade corporate bonds, Treasury bonds and municipal bonds. They have a higher yield due to their higher risk of default. Global bonds areissued and traded outside the country where a currency is denominated. Like U.S. bonds, global bonds come with interest-rate risk.Source: FactSet. Note: All spreads are option-adjusted spreads except for emerging markets and senior loans. Emerging markets spread is the spread over the U.S. Treasury curve. Senior loans spread is the average three-yearcall secondary spread. All returns are total returns including dividends expressed as percentages. Returns for 3-, 5-, and 10-year periods are annualized. All other returns are cumulative. Past performance is no guarantee offuture results. An investment cannot be made in an index. Please review important disclosures in the back of this book.20220112-1985590-6113950Voya Global Perspectives 21
Global YieldsInvestors seeking income may benefit from the higher yield available from global bonds.Current 10-Year Sovereign Bond Yields as of 7/29/2022Source: FactSet. Past performance is no guarantee of future results. An investment cannot be made in an index. Please review important disclosures in the back of this book.20220112-1985590-6113950Voya Global Perspectives 22
Growth & ReflationGrowth and InflationGrowth and ReflationThe 10-year U.S. Treasury yield historically tracks real U.S. GDP and inflation.403020Percent (%)105.902.64-0.900-1010-Year Treasury YieldReal U.S. GDPInflation – Core CPI Y/Y-20-30-401975 1977 1979 1981 1983 1985 1987 1989 1991 1993 1995 1997 1999 2001 2003 2005 2007 2009 2011 2013 2015 2017 2019 2021Source: FactSet. Nominal U.S. GDP growth as of 6/30/22, 10-Year Treasury yield as of 7/29/22.20220112-1985590-6113950Voya Global Perspectives 23
Credit Spreads and TED SpreadCredit spreads indicative of risk : low or narrow is good; high or wide is badTED Spread (Libor – 3-month Treasury)High Yield Spreads41,000Lehman crisis9003700Percent (%)Basis 2-11990 1995 1999 2004 2008 2013 2017 2022Source: Moody’s, Reuters, Federal Reserve, FactSet, as of 8/2/22. Note: The TED spread is the difference between the interest rates on interbank loans and on short-term U.S. government debt ("T-bills"). TED is an acronymformed from T-Bill and ED, the ticker symbol for the eurodollar futures contract. HY spreads are Bloomberg Barclays U.S. Aggregate Corp HY option-adjusted benchmark average rates in excess of 10-year U.S. Treasury yields.“Libor” is the London Inter-bank Offer Rate, the interest rate banks charge each other for loans, data as of 7/29/22. Past performance is no guarantee of future results. An investment cannot be made in an index. Pleasereview important disclosures in the back of this book.20220112-1985590-6113950Voya Global Perspectives 24
International EconomicsThe “Big 3” dominate the global economy while the U.S. and China is putting distance on EuropeSource: FactSet. Data are most recent available as of 7/29/22.20220112-1985590-6113950Voya Global Perspectives 25
Savings Rates and Household Net WorthHousehold net worth and savings rate remains high.Household Net Worth302520 trillions3 month average, % of disposable incomeSavings Rate15105.235Since a low of 2.6% in 2005, the savings rate has moved unevenlyhigher, reversed course and has now 01101009080706050403020101988149.28Household wealth hasrebounded since thefinancial crisis19942001200820152022Source: Bureau of Economic Analysis, Federal Reserve, FactSet. Savings rate data as of 6/30/22; household net worth data as of 3/31/22.Note: BEA implemented a metrics revision regarding savings rate on 07/31/13.20220112-1985590-6113950Voya Global Perspectives 26
Commodities PricesGold actually sells for less today in real — inflation-adjusted — terms than in 1980. 2,400 /oz. 12,000 /ton 1804.00 2,000700COPPER /ton650 10,000CRB Index 1,600550 8,000500 1,200 800GOLDNominal Price/oz.GOLD RealPrice/oz. 01976450 6,000400 4,000 400198419911999200720142022600 2,00020123503002015201720202022Source: FactSet. Note Gold’s “real price/oz.” is equal to the indexed nominal gold price divided by the CPI U.S. City as of 6/30/22. Nominal gold price is as of 7/29/22 and CRB is as of 8/2/22. Past performance is no guaranteeof future results. An investment cannot be made in an index.20220112-1985590-6113950Voya Global Perspectives 27
Oil Price and IntensityCrude oil prices are a good indicator of global demand with too high and too low both ominous2001,000150Oil Intensity600400200Price per Barrel94.42100500-50199030 year average 43.4/barrel19941998200160% less oil isrequired toproduce eachunit of GDP20052008201220162019Crude Oil (NYM /billion)800Barrels per 1 Millionof GDP2023Source: U.S. Dept. of Energy, FactSet. Oil intensity as of 12/31/15, crude oil as of 8/2/22. Note: Oil prices are represented by West Texas Intermediate light crude spot prices (NYMEX).20220112-1985590-6113950Voya Global Perspectives 28
U.S. Government Debt and DeficitU.S. Government Debt30,000,000Debt Levels 30.6 Trillion123.0820,000,00015,000,000Debt% of GDP Trillions25,000,00010,000,0005,000,0002005 2009 2012 2015 2019 2022'95 '97 '99 '01 '03 '05 '07 '09 '11 '13 '15 '17 '19 '21Source: FactSet. U.S. government debt data as of 6/30/22, debt level data as of 6/30/22.20220112-1985590-6113950Voya Global Perspectives 29
Corporate Income Tax RatesPercent (%)U.S. corporate income taxes were slashed in 2017 improving its competitive advantage.Source: Organization for Economic Cooperation and Development. Data as of 2021.20220112-1985590-6113950Voya Global Perspectives 30
The Folly of Gaming DiversificationSource: FactSet, Voya Investment Management. Note: “Global AA” includes 10 asset classes, equally weighted: S&P 500, S&P 400 Midcap, S&P 600 Smallcap, MSCI U.S. REIT Index/FTSE EPRA REIT Index, MSCI EAFEIndex, MSCI EM Index, Bloomberg Barclays U.S. Corporate Bonds, Bloomberg Barclays U.S. Treasury Bonds, Bloomberg Barclays Global Aggregate Bonds, Bloomberg Barclays U.S. High Yield Bonds. For illustration only.Past performance is not a guarantee of future results. Investors cannot invest directly in an index. Please review important disclosures in the back of this book.20220112-1985590-6113950Voya Global Perspectives 31
Sequence of Returns MattersIt is crucial to de-risk once retirement begins due to possible adverse “Sequence of Returns”DateStarting Nest Egg ValueYear 1Year 2Year 3Year 4Year 5Year 6Year 7Year 8Year 9Year 10Year 11Year 12Year 13Year 14Year 15Year 16Year 17Year 18Year 19Year 20Average ReturnAnnual IncomeAnnual ReturnsPortfolio Value 852272,380267,237261,322254,521Annual ReturnsPortfolio Value 2Source: Voya Investment Management. This chart is for illustrative purposes only. The information presented is hypothetical, and not indicative of any particular investment.20220112-1985590-6113950Voya Global Perspectives 32
Index DefinitionsBloomberg Barclays U.S. Aggregate Bond Index is composed of U.S.securities in Treasury, Government-Related, Corporate and Securitized sectorsthat are of investment-grade quality or better, have at least one year tomaturity, and have an outstanding par value of at least 250 million.Bloomberg Barclays U.S. Corporate Bond Index is a component of theBloomberg Barclays U.S. Aggregate Index.Bloomberg Barclays U.S. Corporate High-Yield Bond Index tracks theperformance of non-investment grade U.S. dollar-denominated, fixed rate,taxable corporate bonds including those for which the middle rating of Moody’s,Fitch, and S&P is Ba1/BB /BB or below, and excluding EmergingMarkets debt.Bloomberg Barclays U.S. Treasury Bond Index is a component of theBloomberg Barclays U.S. Aggregate Index.Bloomberg Barclays Global Aggregate Bond Index measures a widespectrum of global government, government-related, agencies, corporate andsecuritized fixed-income investments, all with maturities greater thanone year.Bloomberg Barclays Emerging Market Bond Index includes fixed andfloating rate USD-denominated debt from emerging markets in the followingregions: Americas, Europe, Middle East, Africa and Asia.The Chicago Board Options Exchange Volatility Index (CBOE VIX) is ameasure of the implied volatility of S&P 500 index options. It is one measure ofthe market’s expectation of volatility over the next 30-day period.The Credit Suisse/Tremont Hedge Fund Index is an asset-weighted hedgefund index covering over 5,000 funds with at least US 50 million undermanagement, a 12-month track record and audited financial statementscalculated net of performance fees and expenses. CS/Tremont sub-indexestrack hedge fund strategies by methodology, asset class and/or use ofleverage.FTSE NAREIT U.S. Real Estate Index presents comprehensive REITperformance across the U.S. economy, including all commercial investmentand property sectors.FTSE EPRA/NAREIT Global Real Estate Index is designed to representgeneral trends in eligible real estate equities worldwide.JPMorgan Emerging Markets Bond Index Plus (EMBI ) tracks total returnsfor actively traded emerging markets debt instruments including U.S. dollardenominated Brady bonds, Eurobonds, and traded loans issued by sovereignentities.Merrill Lynch Municipal Bond Index is an unmanaged index that includestax-exempt fixed rate bonds across a broad range of quality and maturitysegments.MSCI BRIC Equity Index is a market capitalization weighted index of about320 companies located in Brazil, Russia, India and China.MSCI EAFE Index is a free float-adjusted market capitalization weighted indexdesigned to measure the developed markets’ equity performance, excludingthe U.S. and Canada, for 21 countries.MSCI Europe Index is a free float-adjusted market capitalization weightedindex designed to measure equity performance of the developed markets inEurope, consisting of 16 country indexes.MSCI Pacific Index is a free float-adjusted market capitalization weightedindex designed to measure developed markets’ equity performance in thePacific region, consisting of 5 countries.MSCI Emerging Markets Index is a free float-adjusted market capitalizationindex that measures emerging market equity performance of 23 countries.Dow Jones Industrial Average is a price-weighted average computed fromthe stock prices of 30 large, widely held public companies in the U.S., adjustedto reflect stock splits and dividends.20220112-1985590-6113950Voya Global Perspectives 33
Index DefinitionsAsset classes are represented by the following indexes:S&P SmallCap 600 Index covers approximately 3% of the domestic equitiesmarket and is designed to represent a portfolio of small companies that areinvestable and financially viable.Bloomberg Barclays U.S. Corporate Bond Index is a component of theBloomberg Barclays U.S. Aggregate Index.S&P 500 Index is a gauge of the U.S. stock market, which includes 500leading companies in major industries of the U.S. economy.Bloomberg Barclays U.S. Corporate High-Yield Bond Index tracks theperformance of non-investment grade U.S. dollar-denominated, fixed rate,taxable corporate bonds including those for which the middle rating of Moody’s,Fitch, and S&P is Ba1/BB /BB or below, and excluding Emerging Marketsdebt.Investment RisksDomestic Equity: exposure to financial and market risks that accompanyinvestments in equities. Markets are volatile and can decline significantly inresponse to adverse issuer, political, regulatory, market or economicdevelopments. Small-cap stocks may be more volatile and less liquid thanstocks of larger, more established companies.Bloomberg Barclays U.S. Treasury Bond Index is a component of theBloomberg Barclays U.S. Aggregate Index.Bloomberg Barclays Global Aggregate Bond Index measures a widespectrum of global government, government-related, agencies, corporate andsecuritized fixed-income investments, all with maturities greater thanone year.Fixed Income: exposure to financial, market, prepayment, credit and interestrate risks. The value of an investment in a fund is not guaranteed and willfluctuate. Higher yielding bonds are subject to greater volatility and credit risks.A fund may invest in securities guaranteed by the U.S. government as to timelypayment of interest and principal, but a fund’s shares are not insured orguaranteed. Bonds have fixed principal and return if held to maturity, but mayfluctuate in the interim. Generally, when interest rates rise, bond prices fall.Bonds with longer maturities tend to be more sensitive to changes in interestrates.FTSE EPRA/NAREIT Global Real Estate Index is designed to representgeneral trends in eligible real estate equities worldwide.MSCI BRIC Equity Index is a market capitalization weighted index of about320 companies located in Brazil, Russia, India and China.MSCI EAFE Index is a free float-adjusted market capitalization weighted indexdesigned to measure the developed markets’ equity performance, excludingthe U.S. and Canada, for 21 countries.International: in addition to the general risks of investing in equities and fixedincome securities, investing in foreign securities poses special risks, includingcurrency fluctuation, economic and political risks not found in investments thatare solely domestic. Risks of foreign investing are generally intensified forinvestments in emerging markets.S&P MidCap 400 Index is a benchmark for mid-sized companies, whichcovers over 7% of the U.S. equity market and reflects the risk and returncharacteristics of the broad mid-cap universe.REITs: real estate investment trusts may be sensitive to factors such aschanges in real estate values and property taxes, interest rates, cash flow ofunderlying real estate assets, supply and demand, and the management skilland credit-worthiness of the issuer. REITs may also be affected by tax andregulatory requirements.20220112-1985590-6113950Voya Global Perspectives 34
Index DefinitionsMSCI U.S. REIT Index is a free float-adjusted market capitalization weightedindex comprised of equity REITs that generate a majority of their revenue andincome from real estate rental and leasing operations.Russell Midcap Value Index measures the performance of the mid-cap valuesegment of the U.S. equity market including Russell Midcap Index companieswith lower price-to-book ratios and forecasted growth.NASDAQ Composite Index is a market capitalization weighted index of theperformance of domestic and international common stocks listed on theNASDAQ Stock Market including over 2,800 securities.Russell 2000 Index measures the performance of the small-cap segment ofthe U.S. equity market including approximately 2,000 of the smallest securitiesbased on market capitalization.The NCREIF (National Council of Real Estate Investment Fiduciaries) PropertyIndex (NPI) is a market value-weighted index of total rates of return for a largepool of commercial real estate properties acquired in the private market forinvestment purposes.Russell 2000 Growth Index measures the performance of small-cap growthstocks in the U.S. equity market including Russell 2000 companies with higherprice-to-value ratios and forecasted growth.Russell 3000 Index measures the performance of the largest 3,000 U.S.companies, representing approximately 98% of the investible U.S. equitymarket.Russell 1000 Index measures the performance of the large-cap segment ofthe U.S. equity market and includes approximately 1,000 of the largestsecurities based on market capitalization and representing approximately 92%of the U.S. market.Russell 1000 Growth Index measures the large-
Source: FactSet, FTSE NAREIT, Voya Investment Management. The Overall Average model allocation includes 10 asset classes, equally weighted: S&P 500, S&P 400 Midcap, S&P 600 Smallcap , MSCI U.S. REIT Index/FTSE EPRA REIT Index, MSCI EAFE Index, MSCI BRIC Index, Bloomberg Barclays U.S. Corporate Bonds, Bloomberg Barclays U.S .


![The DaVita Retirement Savings Plan [401(k)]](/img/16/enrollment-guide.jpg)
