Transcription
Remote Sensing Applications at theState and Local LevelReport of a User WorkshopFebruary 23, 2001Lamont Doherty Earth ObservatoryPalisades, NYSponsored by the Socioeconomic Data and Application Center (SEDAC)Center for International Earth Science Information Network (CIESIN)Columbia University
Report of the Workshop on Remote Sensing Applications at the State and Local LevelThe User Workshop on Remote Sensing Applications at the State and Local Level wassponsored by the Socioeconomic Data and Application Center (SEDAC) of the Center forInternational Earth Science Information Network (CIESIN) at Columbia University.The Workshop home page can be found athttp://sedac.ciesin.columbia.edu/remote sens/The Center for International Earth Science Information Network (CIESIN) wasestablished in 1989 as an independent non-governmental organization to provideinformation that would help scientists, decision-makers, and the public better understandtheir changing world. In 1998, CIESIN relocated from its original home in Michigan tobecome part of Columbia University’s Earth Institute.CIESIN focuses on applying state-of-the-art information technology (e.g., computerscience, data archiving, geographic information systems, and remote sensing) tointerdisciplinary problems at the intersection of human and environmental systems.CIESIN at Columbia UniversityP.O. Box 100061 Route 9WPalisades, NY 10964 USATel. 1-845-365-8988Fax: 1-845-365-8922Web: http://www.ciesin.columbia.eduReport edited by Francesca Pozzi, CIESIN. Work supported by the U.S. NationalAeronautics and Space Administration, Goddard Space Flight Center under contractNAS5-98162. The opinions expressed here are those of the participants and editor and arenot necessarily those of CIESIN or NASA.Copyright 2001 The Trustees of Columbia University in the City of New Yorkii
Report of the Workshop on Remote Sensing Applications at the State and Local LevelExecutive SummaryThe Workshop on Remote Sensing Applications at the State and Local Level wasorganized by CIESIN’s Socioeconomic Data and Application Center (SEDAC) to addressissues of availability and the needs for remotely sensed data products by local users. Theworkshop took place at Columbia’s Lamont-Doherty Earth Observatory, in Palisades, NYand was attended by about twenty representatives from local and state governments andnon-governmental organizations in New York and New Jersey.The objective was to solicit input from potential users of geo-referenced data productsderived from remotely sensed imagery, in terms of specific products needed for on-goingactivities and the exploration of new applications.The increasing availability and accessibility of new technology and data for localgovernments and agencies are proving helpful for day-to-day decision-making processes.In particular, remotely sensed data and Geographic Information Systems have beenincreasingly used together for a vast range of applications, ranging from land use/landcover mapping to emergency management to characterization and monitoring ofenvironmental and human health conditions.SEDAC has been working with five sets of Landsat 7 ETM images covering parts ofNew York, New Jersey and Connecticut, acquired during the fall 1999 and the winter2000. Using the above images, SEDAC’s staff have explored ways to develop new andinnovative products that might be useful for a wide range of applications within local andstate governments. Some of these prototype products were presented at the workshop inorder to get feedback from potential users about general usefulness, specific applicationsof remote sensing products for local governments, and specific issues users would like tosee addressed by these products.The two prototype data products presented were (i) a tailored land cover/land useclassification and (ii) a greenness map. The discussion focused on usefulness of suchproducts for a variety of applications, such as landscape assessment, environmental andhealth conditions monitoring, urban sprawl and urban/vegetation change studies. This ledto discussions of specific applications that local governments and agency are currentlyinvolved with and interested in using, with particular emphasis on different sensors andtheir resolutions.Using an evaluation form distributed the same day, participants provided helpfulcomments in terms of specialized classifications they would like to have, time frames forimage acquisition, and data processing and integration with other data sets. Althoughthere was an agenda item on mechanisms for data sharing and models for collaborativework between governments and organizations, those topics were not discussed in depth,given the differences in interests that emerged during the workshop and the possibledifficulties in coordinating such different activities. Such discussions seemed more likelyto develop in the future through individual collaborations rather than through a broadergroup or ‘consortium’.iii
Report of the Workshop on Remote Sensing Applications at the State and Local LevelTABLE OF CONTENTS1 Introduction . 12 Prototype Data Products Discussion . 22.1Tailored land cover/land use classification. . 2Background . 2Comments. 72.2Vegetation Fraction Index and Urban/Vegetation Change Detection. 8Background . 8Comments. 123 Other Applications and Integration with Relevant Data sets . 133.1Applications. 13Landscape Assessment. 13Air Quality. 14Water quality. 14Floodplains mapping and Emergency Management . 14Health Applications. 153.2Integration with Relevant Data sets . 16Annex 1. Workshop Agenda. 17Annex 2. List of Participants. 18Annex 3. Background Information. 20References . 26iv
1 IntroductionThe Workshop on Remote Sensing Applications at the State and Local Level wasorganized by CIESIN’s Socioeconomic Data and Application Center (SEDAC) to addressissues of availability and needs for remotely sensed data products among local users.Specifically about twenty representatives from local and state governments and nongovernmental organizations in New York and New Jersey attended the workshop todiscuss the development of tailored applications using remotely sensed imagery. SEDACdeveloped prototype data products using Landsat 7 ETM imagery, such as a tailoredland use classification and a greenness map (the latter being a simpler version of theVegetation Fraction Index calculated for New York City by Chris Small).The objective was to solicit input from potential users of geo-referenced data productsderived from remotely sensed imagery, in terms of specific products needed for on-goingactivities and exploration of new applications. The possibility of forming local andregional collaborations to purchase and share imagery and other data resources was alsoon the agenda (see Annex 1 for the Agenda and Annex 2 for the Participants list).The increasing availability and accessibility of new technology and data for localgovernments and agencies is proving helpful in day-to-day decision-making processes. Inparticular remotely sensed data and Geographic Information Systems have increasinglybeen used together for a vast range of applications, spanning from land use/land covermapping to emergency management to characterization and monitoring of environmentaland human health conditions.The higher spatial and spectral resolutions, more frequent coverage and increasedavailability of new sensors will bring remote sensing to a more accessible level withinlocal and state governments and help them deal with several issues in regional planning,resource management, public health and environmental protection.The workshop’s objectives were: To examine the prototype data products and discuss the possible uses for localapplication in terms of Land Cover/Land Use and Vegetation change detection; To discuss other potential applications, such as emergency management, floodmapping, air and water quality monitoring and related issues of scale and timing; To discuss other relevant data sets and their integration with remotely sensed data; To discuss other satellite data products and possible mechanisms for data sharing.This reports provides a summary of the workshop presentations and discussions. Section2 describes the discussion on prototype data products, including background material andcomments from workshop participants. Section 3 summarizes the discussion on specificapplications and integration with other data sets. Finally, Annex 3 provides backgroundinformation on Landsat 7 ETM and other remote sensing satellite and sensors.1
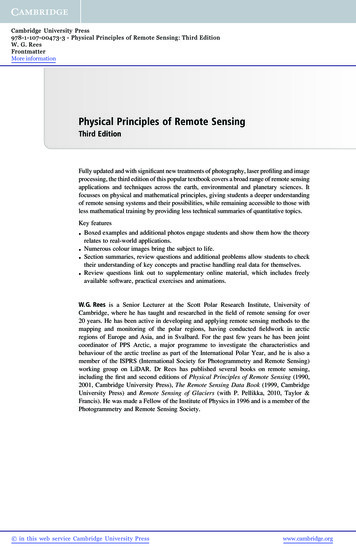
Report of the Workshop on Remote Sensing Applications at the State and Local Level2 Prototype Data Products DiscussionSEDAC has been working with five sets of images covering parts of New York, NewJersey, and Connecticut, acquired during the fall of 1999 and the winter of 2000. Theimages were collected by Landsat 7 using the Enhanced Thematic Mapper Plus (ETM )sensor (see Annex 3 for more information on Landsat and other satellites and sensors).The spatial resolution (ground cell or pixel size) varies between 15 and 60 meters andallows detection and mapping of quantities such as vegetation abundance and health,presence of standing water, forest clearing, agricultural usage and other land coverchanges.Using the above images we explored several ways of making use of the high-resolutionpanchromatic band and the improved thermal band, and of developing new products.Some of these prototype products were presented at the workshop, in order to getfeedback from potential users about general usefulness, specific applications of remotesensing products for local governments, and specific issues users would like to seeaddressed by these products.The advantage of having such user-specific products is that they will be developedaccording to local government needs, they will be compatible with higher resolution datasets already collected and available at the local level, and they will allow a betterunderstanding of dynamics and features that can be integrated in decision-makingprocesses.A classic example of such integration would be a land cover/land use change study: theresolution of the Landsat 7 data does not allow for detailed discrimination betweenfeatures in the way that aerial photography or field surveys do. However, the availabilityof multispectral data can help better identify certain features and their condition (i.e.,vegetation health monitoring). The availability of repeat coverage over a certain area willthen permit the production of land cover maps for different periods and thus aid changedetection studies. Changes that might be of interest can range from short-termphenomena like flooding or snow cover to long-term phenomena like urban sprawl ordeforestation. Vegetation health monitoring can also be performed using images fromdifferent seasons. This could be useful in urban vegetation studies or to relate airpollution and vegetation health.At the workshop we mainly discussed two prototype products potentially useful for localgovernments: (i) a tailored land cover/land use classification and (ii) a greenness map.2.1 Tailored land cover/land use classification.BackgroundUsing the Landsat 7 ETM scene from September 1999 (Figure 1, showing Paterson, NJand surrounding areas in visible/infrared false color), a maximum-likelihoodclassification was performed to produce the classified image in Figure 2.2
Report of the Workshop on Remote Sensing Applications at the State and Local LevelThe maximum-likelihood approach is one of the methods used in supervisedclassification. This type of classification is used to cluster pixels into classescorresponding to user-defined “training areas” or “region of interest” (groups of pixelsthat represent areas or materials that the user wants to have mapped in the final product).The first step in the supervised classification is to identify representative training areasand to develop a numerical description of the spectral attribute for each land cover typeof interest. This is followed by the classification process in which each pixel is assignedto the land cover class it is most likely to belong to. The maximum likelihood methodrequires a large number of computations to classify each pixel, making it time andmemory consuming, but it is considered one of the most accurate classificationalgorithms.The classification of the Landsat scene was performed using only 6 classes of landuse/land cover to show the possibility of using a very simple classification scheme thatcan be used for many different applications, in particular in the urban/suburban context.Such applications might include mapping and monitoring of new developments (housing,roads, commercial development, etc.), golf courses or changes in density of vegetationand urban areas.3
Report of Workshop on Remote Sensing Applications at the State and Local LevelFigure 1. Landsat 7 ETM (9/23/99). The image is shown in visible/infrared false color (Red Band 7,Green Band 4, Blue Band 2).4
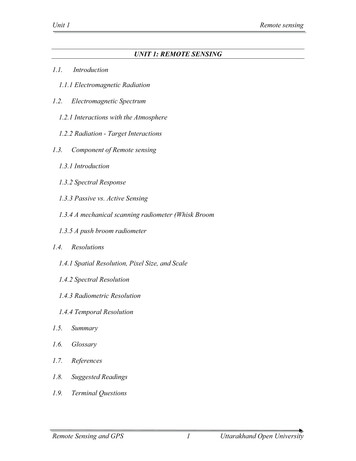
Report of Workshop on Remote Sensing Applications at the State and Local LevelFigure 2. Maximum Likelihood Classification. Legend:Red: Infrastructure (high intensity residential, commercial, transportation)Yellow: Low Intensity ResidentialLight Green: Urban and Recreational GrassesGreen: ForestsBlue: WaterCoral: Bare Soil, RockThe correspondence between the unclassified image and the classified one is relativelygood. Given the exploratory nature of this product, no ground truthing was performedand, consequently, no statistical accuracy tests were conducted based on control areas onthe ground. This was meant to be a first attempt at establishing whether such ‘tailored’products can be developed and to show an example of simplified classifications.Looking at the “Regions of Interest” statistical distribution, it is possible to get a sense oftheir separability (i.e., how well the classes can be distinguished from each other). Theclasses that are best distinguished are Water and Grass, Water and Soil, Water and LowIntensity Residential, and Grass and Soil. The two most poorly separated are:Infrastructure and Low Intensity Residential, as expected.5
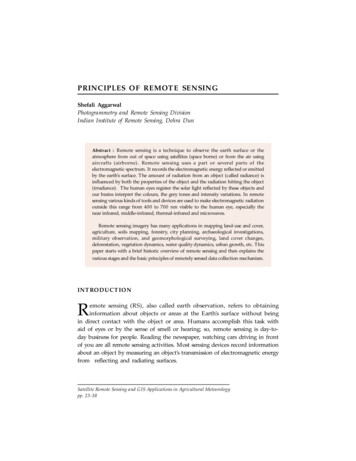
Report of Workshop on Remote Sensing Applications at the State and Local LevelIt is important to remember that this simply gives an idea of which classes are easier toseparate based only on their spectral responses in the different bands and does not ensurea good result during the classification process.The advantage of a user-specific classification, compared with other available products,such as the recently released USGS National Land Cover Data set (see Figure 3), lieswithin the word “tailored”: such classification will be produced based on inputs fromlocal governments, according to their needs and potential uses of the product. The classescan be identified and selected based on specific applications and by integrating relativelycoarse-resolution data, such as Landsat data, with high-resolution data, such as aerialphotography—data already available in many counties. The major advantage would bethe possibility of having a regular updating of the product thanks to the availability ofrepeat coverage, leading to appropriate land cover and land use change products.Figure 3. USGS National Land Cover Data Set. (USGS, National Land Cover CharacterizationProgram, National Land Cover Data (NLCD) Set, 1999).6
Report of Workshop on Remote Sensing Applications at the State and Local LevelCommentsWorkshop attendees expressed considerable interest in the ideas of developing tailoredclassification schemes and updating land use/land cover maps.The need for user-tailored classifications was emphasized both by local governments(county level) and by regional and state groups. In the case of county governments, wheredetailed land use maps may already be available, we discussed the idea of integratingtheir high-resolution data with satellite-derived products in order to refine existing mapsand to get more diverse information. Such information might be related to vegetation orthe possibility of aggregating multiple classes (based on the classification results) intofewer classes according to specific uses and applications. Producing an accurate, usefulclassification scheme for local governments using Landsat 7 data would undoubtedlyrequire a large amount of work, but once the methodology and the final products are inplace it could represent a significant improvement for data acquisition and integration indecision-making processes.As for the regional and state level, given the difference in scale, the development of atailored classification scheme will require less ancillary data and could be more easilyautomated. In this case, participants expressed the need for having a comparable set ofland use/land cover classes for assessing landscape change, in particular between forest,agriculture, and development.These ideas led the discussion to ‘change detection’ studies and to the possibility ofhaving regular updates of the classified images. Although limitations in the spatialresolution of the classified image were recognized, the possibility of having regularupdates of such products was particularly appealing. Even county governments alreadyprovided with detailed maps liked the idea of finding a way to get their data and mapsupdated more regularly, such as through aggregation of data from different sources(satellite, aerial photography, ground survey, etc.). An example of a way to improve theresolution and make use of the repeat coverage is to calibrate the classification derivedfrom satellite imagery with information from aerial photography and ground data, andthen use that calibrated image to perform the classification on other images, looking bothback and forward in time. This procedure minimizes the costs of collecting ancillary datato validate the classification in the future and therefore reduces both the costs and thetime for the classification process itself.Other applications that emerged during the discussion were related to integration of landuse classification maps with other socioeconomic and demographic data, as furtherdiscussed in Section 3.7
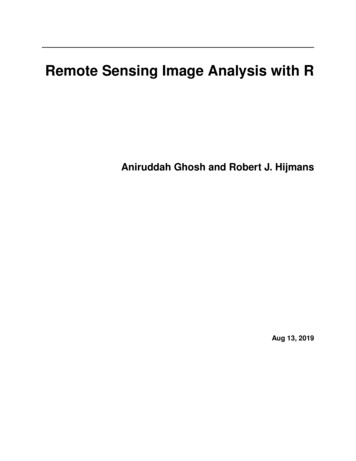
Report of Workshop on Remote Sensing Applications at the State and Local Level2.2 Vegetation Fraction Index and Urban/Vegetation Change DetectionBackgroundMost major metropolitan areas and neighboring suburban settlements are facing problemsof urban sprawl, loss of natural vegetation and open space, and drastic change in landcover and land use. For years, land mapping at the county level has relied on aerialphotography and field surveys because of the high spatial resolution required and thehigh level of details that can be obtained. However, satellite imagery may becomeincreasingly important in identifying and monitoring soil conditions and various relatedland characteristics, such as vegetation and crops. Monitoring is one of the key uses ofremote sensing, due to the availability of repeat coverage and associated high spatial andspectral resolution. Remote sensing is extensively used in monitoring changes in naturaland semi-natural areas and, to a lesser extent, the effects of pollution on trees, soil, andwater.In areas such as the New York City metropolitan area, where the effects of urban sprawlare of particular concern, remote sensing can be used to monitor urban/vegetationchanges and be integrated with higher resolution data available at the county level. Also,new products and methodologies, such as the ones presented at the workshop, can bedeveloped for a vast range of applications and could potentially be updated regularly(annually or seasonally) according to user needs.SEDAC has been exploring possible products that might help local governments displayand monitor such changes and that can be used as basic tools in day-to-day decisionmaking processes. These products were presented in the morning session.One such product, potentially very useful in studying urban sprawl and urban andsuburban dynamics, is the Vegetation Fraction Index.During his overview, Chris Small briefly described the results of his study on New YorkCity vegetation (shown in Figure 4). Estimates of vegetation fractions have been obtainedthrough a linear spectral mixing model. The model is based on the assumption that thereflectance of each pixel of the image is a linear combination of the reflectance of each‘material’ present within the pixel. This allow one to determine the relative abundance ofthe ‘materials’ based on their spectral characteristics. In the case of New York City, threemain components have been recognized to describe the spectral variance in the scene:low albedo (water, shadow, and roofing), high albedo (cloud and roofing), andvegetation. The model has proven to be very accurate: a quantitative validation ofLandsat-derived vegetation estimates with vegetation measurements from aerialphotography showed an agreement to within 10% for vegetation fractions greater than20%, across the full range of vegetation abundance (Small, 2001).Such a product allows one to identify the green areas and quantify the proportions ofvegetation versus urban land in an immediate and easily interpretable way.8
Report of Workshop on Remote Sensing Applications at the State and Local LevelFigure 4. New York Urban Vegetation, estimated from Landsat 7 imagery, 9/23/99. Vegetationfraction showed above range from sparse (blue 10%) to dense (red 90%). Black areas containnegligible vegetation or are in shadow (Small, 2001).9
Report of Workshop on Remote Sensing Applications at the State and Local LevelAn even simpler model is a Greenness map, obtained by performing a Tasseled CapTransformation on the original Landsat data.The Tasseled Cap Transformation on Landsat TM data performs an orthogonaltransformation of the original data into a new three-dimensional space, consisting of a“Brightness” index, a “Greenness” index, and a third component related to soil features.In the case of Landsat MSS data, the Tasseled Cap Transformation generates fourindices: a Soil Brightness Index, a Green Vegetation Index, a Yellow Stuff Index, and aNon-such Index, related to atmospheric effects (ENVI, 2000).In order to visualize the differences between vegetation and non-vegetated areas, such asurban and water, only the Greenness Index has been displayed using a logarithmic greenand white scale, where the deeper green corresponds to more vegetation. Figure 5 andFigure 6 show the Greenness Index for a portion of southern New York, obtained usingLandsat MSS data from 1987 and 1991, respectively.Performing the transformation on data obtained in two different periods permits showingchanges in the proportion of urban and forested areas. Some of the most visibledifferences are indicated by the red arrows in the 1991 image. Note that the spatialresolution for these images (Landsat MSS) is 80 x 80 meters; therefore, many minorchanges cannot be detected.Figure 5. Greenness map obtained from Landsat MSS imagery, 06/10/87.10
Report of Workshop on Remote Sensing Applications at the State and Local LevelFigure 6. Greenness map obtained from Landsat MSS imagery, 06/21/91.The most striking change is the road in the lower left corner, not visible in the 1987scene, but clearly identifiable in the 1991 scene. That road is the last section of InterstateI-287 to have been built, between I-80 and I-87. The whole Interstate was completed in1993. The area in the top left corner (Sugar Loaf, NY) shows a slight reduction in theamount of vegetation, which cannot be uniquely attributed to anything without furtherstudy. Another area showing change is the one in the bottom right corner (in WestchesterCounty), where a minor urban enlargement is clearly recognizable.It must be said that the previous two greenness maps show vegetation and urban areasmainly in a qualitative way. Looking at the greenness histograms reported in Figure 7 cangive an idea of the distribution of pixels according to the greenness values, althoughproperly quantifying such changes requires a quantitative method, like the VegetationFraction model above described.11
Report of Workshop on Remote Sensing Applications at the State and Local LevelFigure 7. Greenness histograms for the 1987 and 1991 scenes, respectively.The peak in the negative values corresponds to water, while the peak in the positivevalues (around 60) corresponds to vegetation. The broad range of numbers in betweencorresponds to a variety of combinations of vegetation and urban land cover. The shapeof the curve is not dramatically different for the two scenes; only the vegetation peakappears to be lower (fewer pixels for ‘pure’ vegetation) in 1991, and there seems to be alarger ‘mixed’ area for values between 30 and 50. However, as already mentioned, thisshould not be interpreted as a quantitative representation of vegetation change.CommentsGreenness maps and the consequent vegetation/urban change detection studies arestraightforward to understand and interpret. For this reason, these products did notgenerate the same level of comment and feedback as the land use/land cover maps,although they might find applications in a variety of fields, such as the study of urbansprawl.The resolution of the Landsat data limits their use to tracking vegetation changes at abroader scale (regional, rather than county level) and therefore did not elicit too muchinterest among the local government representatives. Participants from countygovernments seemed more interested in changes between different land cover classesthan just vegetation vs. urban land cover.Nevertheless, the potential importance of such tools and products in monitoringvegetation health should be noted, given the availability of repeat coverage and of datacollected at different wavelengths. This type of information could be integrated withhigher resolution data, such as from IKONOS (increased spatial resolution: 4 m in themultispectral, 1 m in the panchromatic band) or AVIRIS (images collected in 224contiguous bands, with ground resolution of 20 meters (high altitude)or 4 meters (lowaltitude)) in order to be more useful for local and county level applications (see theSatellites/Sensors section in Annex 3).12
Report of Workshop on Remote Sensing Applications at the State and Local Level3 Other Applications and Integration with Relevant Data SetsDuring the workshop, only the above prototype data products were presented. However, anumber of other possible applications that might benefit from the use of remotely senseddata were discussed.Specifically, we reviewed the feasibility of using remote sensing for a variety ofapplications (like air and water quality issues, floodplains mapping, etc.) and thepossibility of integrating satellite data with other relevant data sets, in particularsocioeconomic and population data.3.1 ApplicationsWorkshop attendees were interested in re-examining projects in which they have beeninvolved to see whether the use of remote sensing data could have helped to improve dataacquisition and facilitate the process of building a powerful information system for theirorganizations.As mentioned in the Introduction, the purpose of getting more and better data is to allowa better understanding of environmental and human conditions that will, in turn, lead tobetter management of natural resources and improve not only quality of life for localcommunities, but also ease the entire decision-making process at the government level.By looking at specific applications and interests, the needs and use of remotely senseddata can be more easily outlined.Presented here are some of the key areas discussed, in addition to the obvious benefit thatstate and local governments may gain from having regular updates on urbanized areas,infrastructure, and new developments. Urban and suburban applications will be furtherdiscussed in the “Integration with Relevant Data” discussion.Landscape AssessmentOne of the key applications that can greatly benefit from satellite data, including mediumresolution sensors such as Landsat ETM , is regional landscape assessment andlandscape change. Such studies can be pursued using the tailored land cover
become part of Columbia University's Earth Institute. CIESIN focuses on applying state-of-the-art information technology (e.g., computer science, data archiving, geographic information systems, and remote sensing) to interdisciplinary problems at the intersection of human and environmental systems. CIESIN at Columbia University P.O. Box 1000 61 Route 9W Palisades, NY 10964 USA Tel. 1-845 .