Transcription
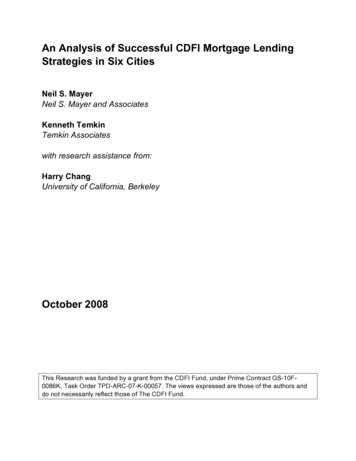
An Analysis of Successful CDFI Mortgage LendingStrategies in Six CitiesNeil S. MayerNeil S. Mayer and AssociatesKenneth TemkinTemkin Associateswith research assistance from:Harry ChangUniversity of California, BerkeleyOctober 2008This Research was funded by a grant from the CDFI Fund, under Prime Contract GS-10F0086K, Task Order TPD-ARC-07-K-00057. The views expressed are those of the authors anddo not necessarily reflect those of The CDFI Fund.
An Analysis of Successful CDFI Mortgage Lending Strategies in Six CitiesiTable of ContentsAcknowledgements .vAbstract.1Executive Summary .1Introduction.10Data Sources.19Case Studies .22Case Study Lenders: Who Are They and What Home Purchase Lending and Related Assistance DoThey Provide? .23Homebuyer education, counseling, and credit repair .28First mortgages .31Subordinate debt (downpayment assistance and closing costs) .33Flexibility in underwriting.45Development of affordable housing .46Comparative Analysis of CDFI Lending to All Mortgage Lending .48Overview of comparison of home purchase borrowers from the case study lenders with those fromlenders overall .48Comparison of neighborhoods served by the case study lenders with those from lenders overall .56Comparison of borrowers served by case study lenders in low-income neighborhoods to allborrowers in those locations.59Other measures of the case study lenders’ assistance to underserved households and communitiesin home purchase.61Relationships with other lenders .69Analysis of all CDFIs reporting into CIIS.72Summary and Conclusions .76References.79Appendix A: Discussion Guides.82Appendix B: Detailed Data Tables .94U.S. Department of the Treasury, CDFI Fund – Research Initiative
An Analysis of Successful CDFI Mortgage Lending Strategies in Six CitiesiiList of TablesTABLE ES-1: SUMMARY OF CHARACTERISTICS OF BORROWERS WHO RECEIVED LOANS FROM CDFIS . 4TABLE ES-2: DISPARITY RATIOS OF BORROWER CHARACTERISTICS BETWEEN CDFIS AND ALL LENDERS . 5TABLE ES-3: SUMMARY OF SHARE OF LOANS MADE BY CDFIS IN LOWER-INCOME CENSUS TRACTS . 5TABLE ES-4: DISPARITY RATIOS OF CENSUS TRACTS SERVED BY CDFIS AND ALL LENDERS . 6TABLE 1: ISSUES ADDRESSED IN HOMEOWNERSHIP PROGRAMS . 13TABLE 2: SUMMARY OF HOMEOWNERSHIP ACTIVITIES FOR CASE STUDY LENDERS . 26TABLE 2 (CONT.): SUMMARY OF HOMEOWNERSHIP ACTIVITIES FOR CASE STUDY LENDERS . 27TABLE 3: SUMMARY OF SOURCES OF FUNDING FOR SUBORDINATE MORTGAGES ORIGINATED BY CDFI LENDERS. 34TABLE 3 (CONT.): SUMMARY OF SOURCES OF FUNDING FOR SUBORDINATE MORTGAGES ORIGINATED BY CDFILENDERS . 35TABLE 4: HOMEOWNERSHIP ASSISTANCE OPTIONS OFFERED BY NHSSV. 36TABLE 5: SUMMARY OF MORTGAGES OFFERED BY HOMESIGHT . 38TABLE 6: SUMMARY OF LOAN PRODUCTS OFFERED BY NHSOC . 40TABLE 7: SUMMARY OF BORROWER CHARACTERISTICS SERVED BY CDFI LENDERS IN THE STUDY . 49TABLE 8: SUMMARY OF DISPARITIES BETWEEN SHARES OF MORTGAGE LOANS TO CATEGORIES OF BORROWERS FORCDFI LENDERS IN THE STUDY AND ALL LENDERS ORIGINATING MORTGAGES IN THEIR CITY BETWEEN 2004 AND2006. 51TABLE 9: DISPARITY RATIOS FOR BORROWER CHARACTERISTIC FOR ALL PURCHASE LOANS MADE TO VERY-LOWINCOME AND LOW-INCOME BORROWERS . 53TABLE 10: SUMMARY OF DISPARITIES BETWEEN SHARES OF MORTGAGE LOANS TO CATEGORIES OF BORROWERS FORCDFI LENDERS IN THE STUDY AND ALL LENDERS ORIGINATING HIGH-COST MORTGAGES IN THEIR CITY BETWEEN2004 AND 2006 . 55TABLE 11: SUMMARY OF SHARE OF LOANS MADE BY CDFIS IN LOWER-INCOME CENSUS TRACTS . 57TABLE 12: SUMMARY OF DISPARITIES BETWEEN TYPES OF NEIGHBORHOOD SERVED BY CDFIS . 58INCLUDED IN THIS STUDY AND ALL PURCHASE LOANS IN THEIR CITIES . 58TABLE 13: SUMMARY OF DISPARITIES BETWEEN TYPES OF NEIGHBORHOOD SERVED BY CDFIS . 59INCLUDED IN THIS STUDY AND ALL HIGH-COST LOANS IN THEIR CITIES . 59TABLE 14: SUMMARY OF DISPARITY RATIOS FOR TYPES OF BORROWERS SERVED BY CASE STUDY CDFIS AND ALLLENDERS IN THE LOW-INCOME AREAS OF THEIR CITIES, FOR ALL HOME PURCHASE LOANS. 60TABLE 15: COMPARISON OF VOLUME OF LOANS ORIGINATED TO LOWER-INCOME BORROWERS BY HOMESIGHT ANDTHF TO LOANS MADE BY ALL LENDERS IN SEATTLE AND NASHVILLE BETWEEN 2004 AND 2006. . 63TABLE 16: COMPARISON OF THF AND HOMESIGHT LENDING VOLUME TO LARGEST LENDER IN DAVIDSON AND KINGCOUNTIES BETWEEN 2004 AND 2006. 64TABLE 17: CMHP’S VOLUME OF SECOND-LIEN MORTGAGE ACTIVITY . 65TABLE 18: NUMBER OF CLIENTS COUNSELED BY CMHP BY ACTIVITY: FY 2002-FY 2007 . 65TABLE 19: AVERAGE INCOMES FOR HOMEBUYERS SERVED BY CMHP: FY 2002-FY 2007 . 66TABLE 20: RACIAL CHARACTERISTICS OF CLIENTS RECEIVING COUNSELING SERVICES FROM . 66CMHP: FY 2002-FY2007. 66TABLE 21: INCOME CHARACTERISTICS OF CLIENTS RECEIVING COUNSELING FROM CMHP: FY 2003-FY200767TABLE 22: NHSSV HOMEBUYER EDUCATION AND COUNSELING ACTIVITIES, BUYERS, AND SOURCE OF FIRST-LIENMORTGAGE . 68TABLE 23: CHARACTERISTICS OF CLIENTS SERVED BY NHSSV AND OF CLIENTS BUYING HOMES: 2003-200769U.S. Department of the Treasury, CDFI Fund – Research Initiative
An Analysis of Successful CDFI Mortgage Lending Strategies in Six CitiesiiiTABLE 24: COMPARATIVE ANALYSIS OF CDFI LENDING TO FIRST-TIME HOMEBUYERS . 73TABLE 25: COMPARATIVE ANALYSIS OF ARM SHARE OF LOANS ORIGINATED BY CDFIS . 74TABLE B-1: COMPARATIVE ANALYSIS OF BORROWERS SERVED BY CMHP AND ALL LENDERS IN CHARLOTTE BETWEEN2004 AND 2006 . 95TABLE B-2: COMPARISON OF NEIGHBORHOODS SERVED BY CMHP AND ALL LENDERS IN CHARLOTTE BETWEEN 2004AND 2006. 96TABLE B-3: COMPARATIVE ANALYSIS OF BORROWERS SERVED IN VERY-LOW- AND LOW-INCOME TRACTS BY CMHPAND ALL LENDERS IN CHARLOTTE . 97BETWEEN 2004 AND 2006. 97TABLE B-4: RATIO OF DISPARITY RATIOS BETWEEN ALL BORROWERS SERVED IN CHARLOTTE BY CMHP ANDBORROWERS SERVED IN VERY-LOW- AND LOW-INCOME TRACTS IN CHARLOTTE BY ALL LENDERS BETWEEN 2004AND 2006. 98TABLE B-5: COMPARATIVE ANALYSIS OF BORROWERS SERVED BY NHSOC AND ALL LENDERS IN LA HABRA BETWEEN2004 AND 2006 . 99TABLE B-6: COMPARISON OF NEIGHBORHOODS SERVED BY NHSOC AND ALL LENDERS IN LA HABRA BETWEEN 2004AND 2006. 100TABLE B-7: COMPARATIVE ANALYSIS OF BORROWERS SERVED IN VERY-LOW- AND LOW-INCOME TRACTS BY NHSOCAND ALL LENDERS IN LA HABRA . 101BETWEEN 2004 AND 2006. 101TABLE B-8: RATIO OF DISPARITY RATIOS BETWEEN ALL BORROWERS SERVED IN LA HABRA BY NHSOC ANDBORROWERS SERVED IN VERY-LOW- AND LOW-INCOME TRACTS IN LA HABRA BY ALL LENDERS BETWEEN 2004AND 2006. 102TABLE B-9: COMPARATIVE ANALYSIS OF BORROWERS SERVED BY THE HOUSING FUND AND ALL LENDERS INNASHVILLE BETWEEN 2004 AND 2006. 103TABLE B-10: COMPARATIVE ANALYSIS OF NEIGHBORHOODS SERVED BY THF AND ALL LENDERS IN NASHVILLEBETWEEN 2004 AND 2006 . 104TABLE B-11: COMPARATIVE ANALYSIS OF BORROWERS SERVED IN LOWER-INCOME TRACTS BY THF AND ALLLENDERS IN NASHVILLE BETWEEN 2004 AND 2006 . 105TABLE B-12: RATIO OF DISPARITY RATIOS BETWEEN ALL BORROWERS SERVED IN NASHVILLE BY THF ANDBORROWERS SERVED IN LOWER-INCOME TRACTS IN NASHVILLE BY ALL LENDERS BETWEEN 2004 AND 2006. 106TABLE B-13: COMPARATIVE ANALYSIS OF BORROWERS SERVED BY NHSSV AND ALL LENDERS IN SAN JOSE BETWEEN2004 AND 2006 . 107TABLE B-14: COMPARATIVE ANALYSIS OF NEIGHBORHOODS SERVED BY NHSSV AND ALL LENDERS IN SAN JOSEBETWEEN 2004 AND 2006 . 108TABLE B-15: COMPARATIVE ANALYSIS OF BORROWERS SERVED IN VERY-LOW- AND LOW-INCOME TRACTS BY NHSSVAND ALL LENDERS IN SAN JOSE BETWEEN 2004 AND 2006. 109TABLE B-16: RATIO OF DISPARITY RATIOS BETWEEN ALL BORROWERS SERVED IN SAN JOSE BY NHSSV ANDBORROWERS SERVED IN VERY-LOW- AND LOW-INCOME TRACTS IN SAN JOSE BY ALL LENDERS BETWEEN 2004AND 2006. 110TABLE B-17: COMPARATIVE ANALYSIS OF BORROWERS SERVED BY HOMESIGHT AND ALL LENDERS IN SEATTLEBETWEEN 2004 AND 2006 . 111TABLE B-18: COMPARATIVE ANALYSIS OF NEIGHBORHOODS SERVED BY HOMESIGHT AND ALL LENDERS IN SEATTLEBETWEEN 2004 AND 2006 . 112TABLE B-19: COMPARATIVE ANALYSIS OF BORROWERS SERVED IN LOWER-INCOME TRACTS BY HOMESIGHT AND ALLLENDERS IN SEATTLE BETWEEN . 113U.S. Department of the Treasury, CDFI Fund – Research Initiative
An Analysis of Successful CDFI Mortgage Lending Strategies in Six Citiesiv2004 AND 2006. 113TABLE B-20: RATIO OF DISPARITY RATIOS BETWEEN ALL BORROWERS SERVED IN SEATTLE BY HOMESIGHT ANDBORROWERS SERVED IN LOWER-INCOME TRACTS IN SEATTLE BY ALL LENDERS BETWEEN 2004 AND 2006. 113TABLE B-21: COMPARATIVE ANALYSIS OF BORROWERS SERVED BY HOMEHQ IN SYRACUSE BETWEEN 2004 AND 2006. 115TABLE B-22: COMPARATIVE ANALYSIS OF NEIGHBORHOODS SERVED BY HOMEHQ AND ALL LENDERS IN SYRACUSEBETWEEN 2004 AND 2006 . 116TABLE B-23: COMPARATIVE ANALYSIS OF BORROWERS SERVED IN VERY-LOW- AND LOW-INCOME TRACTS BYHOMEHQ AND ALL LENDERS IN SYRACUSE BETWEEN 2004 AND 2006 . 117TABLE B-24: RATIO OF DISPARITY RATIOS BETWEEN ALL BORROWERS SERVED IN SYRACUSE BY HOMEHQ ANDBORROWERS SERVED IN VERY-LOW- AND LOW-INCOME TRACTS IN SYRACUSE BY ALL LENDERS BETWEEN 2004AND 2006. 118TABLE B-25: COMPARATIVE ANALYSIS OF BORROWERS SERVED BY SFCU IN SYRACUSE BETWEEN 2004 AND 2006. 119TABLE B-26: COMPARATIVE ANALYSIS OF NEIGHBORHOODS SERVED BY SFCU AND ALL LENDERS IN SYRACUSEBETWEEN 2004 AND 2006 . 120LIST OF FIGURESFIGURE 1: COMPARISON OF DELINQUENCY RATES FOR CDFI LOANS TO OTHER TYPES OF MORTGAGES . 75U.S. Department of the Treasury, CDFI Fund – Research Initiative
An Analysis of Successful CDFI Mortgage Lending Strategies in Six CitiesvAcknowledgementsThis study could not have been completed without the cooperation of the seven CDFIs includedin the analysis. In particular, we would like to thank Pat Garret, Pat Adair, and RalpheneCaldwell of the Charlotte Mecklenburg Housing Partnership; Trish Greer of The Housing Fundin Nashville; Ken Mutter of Neighborhood Housing Services of Orange County; Kim McIlroy,Kerry Quaglia, and Sharon Owens of HomeHQ in Syracuse; Ron Ehrenrich of the SyracuseCooperative Federal Credit Union; Tony To, Tom Jacobi, Kristin Pula, and Alice Cody ofHomeSight in Seattle; and Ed Moncrief, Sonia Pereira, and J.R. Wheelwright of NeighborhoodHousing Services Silicon Valley. We also met with representatives of lenders who partneredwith these CDFIs. We would like to thank Doug Jackson of Region’s Bank, Gus Bidert ofCitibank, John Harris of M&T Bank, Faithel Dubois and Michael Dotson of the Bank ofAmerica, Jayson Hartman of Santa Clara Valley National Bank, Deborah Champion of HarrisBank, and Leslye Krutko, City of San Jose.Jim Greer and Pol Siris provided us with the central study data about CDFI lending from CDFI’sCIIS files, and helped us understand its specifics.We received invaluable assistance from our team of senior reviewers—George Galster, AnneSchnare, and Lee Higgins—in addition to advice from Chris Herbert, Meryl Finkel, and JillKhadduri of Abt Associates. Their contributions helped us sharpen the research approach andour subsequent analyses. Eliza Kean of Abt Associates smoothly handled the tasks of grantadministration and product submission.Harry Chang of the University of California, Berkeley provided us with superb research assistance,which included (1) merging information from HMDA, CIIS, and data provided by several of theCDFIs in the study, and (2) producing reports in a format that could be easily analyzed. These werenot easy tasks. Nonetheless, Harry was able to complete them under very tight time constraints.While we could not have produced this report without the assistance of those mentioned above, anyerrors, omissions, and other mistakes in this report are entirely our own.Neil S. Mayer and Kenneth TemkinJuly, 2008U.S. Department of the Treasury, CDFI Fund – Research Initiative
An Analysis of Successful CDFI Mortgage Lending Strategies in Six Cities1AbstractCommunity Development Financial Institutions (CDFIs) are mission-oriented organizations thathelp provide credit to historically underserved markets. In particular, many CDFIs work topromote homeownership for lower-income and minority families and neighborhoods. Using acombination of quantitative and qualitative data, this report examines the extent to which sevenCDFIs operating in six cities provide loans to borrowers and neighborhoods historicallyunderserved by traditional mortgage lenders. It also examines the strategies that these CDFIs useto promote homeownership opportunities for such borrowers and neighborhoods.Our results indicate that CDFI homeownership activities reach lower-income households andneighborhoods, consistent with these organizations’ missions. The share of loans made by theCDFIs in the study is greater than the share of loans made to lower-income households andneighborhoods by other lenders in their respective cities. The loans made by CDFIs performmuch better than FHA and subprime loans, suggesting that CDFIs make loans that promotesustainable homeownership. CDFIs are able to create sustainable homeownership opportunitiesmost often by providing (1) soft second mortgages that help borrowers with closing costs anddownpayments and (2) pre-purchase counseling for homebuyers.Executive SummaryDespite a wide range of government policies and mortgage lender activities to promotehomeownership, large gaps in U.S. homeownership rates exist between lower-income andhigher- income households, and between minorities and non-minorities. This study examines thecontribution of community development financial institutions to narrowing those gaps.Across income groups, 45 percent of households in the lowest income quintile were homeownersin 2000, barely half of the 87 percent of households in the highest income quintile. Thesehomeownership rates were nearly unchanged from 1990. In 2007 about 75 percent of nonHispanic white households were homeowners, compared to only 46 percent of black householdsand 50 percent of Hispanic households. These differences too are largely unchanged since 2000.U.S. Department of the Treasury, CDFI Fund – Research Initiative
An Analysis of Successful CDFI Mortgage Lending Strategies in Six Cities2Some of the homeownership gaps by income and race/ethnicity result from differences indemand for owner-occupied housing. This demand is lower for households with a highlikelihood of moving, with low wealth relative to risk in a particular asset, and who may not beable to perform or pay for home maintenance tasks. On the supply side, the lack of owneroccupied units affordable to lower-income households contributes to gaps in homeownershiprates, despite recent slowdowns in the appreciation of house prices.But not all of the gaps in homeownership rates for lower-income and minority households can beexplained by supply and demand factors. One important additional factor is the role of adequateaccess to mortgage financing on suitable terms. Research continues to show discriminationespecially in mortgage lending to people of color, often low-income—in the form of loan denialsat elevated rates, or offer only of subprime loans on disadvantageous terms.Mortgage market institutions have established a number of initiatives to promote homeownershipamong traditionally underserved households. These programs generally address three issues: Affordability: the inability of such households to afford homes, either because ofinadequate savings for a downpayment or due to inadequate income to qualify for asufficiently large mortgage. Bankability: a credit history that does not meet requirements, either because it is toolimited or because it shows late payments that lenders use to determine an applicant’screditworthiness. Unfamiliarity: a limited understanding of the homebuying process.The institutions address these issues with lower cost or deferred first- and second-mortgageloans, flexible loan underwriting, downpayment assistance, and homeownership and creditcounseling and education.Community Development Financial Institutions (CDFIs) are lenders whose stated mission is topromote lending, and provide related assistance, to households and in neighborhoodstraditionally underserved by credit markets. The four types of CDFIs—community developmentbanks, community development credit unions, community development loan funds, andcommunity development venture capital funds—provide a variety of financial and non-financialservices. Financial services include making mortgage loans, providing equity investments,taking deposits, and offering consumer and small business financial products. Non-financialservices are entrepreneurial education, organizational development, homeownership counseling,savings programs (such as individual development accounts), and training in financial literacy.U.S. Department of the Treasury, CDFI Fund – Research Initiative
An Analysis of Successful CDFI Mortgage Lending Strategies in Six Cities3Given the importance of homeownership to households as consumers and investors, many CDFIsparticipate in the household mortgage lending arena. This study examines their success indelivering loans and otherwise providing for home purchase to buyers often left out in the past.The purposes of the study are: To determine if CDFIs’ methods for expanding homeownership are successful in meetingtheir goals. These goals are to increase the focus of lending and other aid for homepurchase toward types of households that are historically less likely to become owners,and into neighborhoods with lower overall income, compared to the past pattern amongtraditional lenders. To explain the reasons for the CDFIs’ success or failure.To accomplish these purposes, we undertook research: Analyzing the extent to which a specific set of CDFIs have provided heightened levels ofmortgage lending for home purchase to low-income, minority, and female borrowers andin low-income neighborhoods, compared to traditional patterns. Assessing how substantially, if at all, these CDFIs’ activities encouraged traditionalcommercial lenders to increase their lending to such borrowers and neighborhoods. Identifying some of the strategies that were most useful in reaching those ends.We used a combination of quantitative and qualitative data sources and methods, principally to: Identify the types of homeownership activities used by a sample of seven CDFI lenders(visited and interviewed in case studies) in six cities.1. Compare the types of borrowers and neighborhoods they serve in their respective marketcities (measured using CDFI Fund data) to those served by traditional commercial lenders1Charlotte Mecklenburg Housing Partnership (CMHP) in Charlotte, NC; HomeSight, in Seattle, WA; The HousingFund (THF) in Nashville, TN; Neighborhood Housing Services of Orange County (NHSOC), in La Habra, CA;Neighborhood Housing Services Silicon Valley (NHSSV), in San Jose, CA; HomeHQ, in Syracuse, NY; andSyracuse Federal Credit Union (SFCU), in Syracuse, NY.U.S. Department of the Treasury, CDFI Fund – Research Initiative
An Analysis of Successful CDFI Mortgage Lending Strategies in Six Cities4in the same markets (measured using Home Mortgage Disclosure Act [HMDA] data), andidentify any differences consistent with CDFIs’ missions. Highlight why differences appear.Overall, we find that CDFIs are achieving their missions of making home purchase loans to, andenabling homeownership for, the types of households they are deliberately targeting and in theneighborhoods they seek to serve—those with historically lower rates of homeownership.Among the CDFIs examined in detail in this study, varying combinations of services provideroutes to homeownership for households of types that are often otherwise unable to buy. Theseinclude homebuying education and counseling, first mortgages, subordinate debt, underwritingflexibility, and access to affordable homes. The shares of their home purchase loans that CDFIsmake to lower-income and minority borrowers are high in absolute terms. Overall, the sevenCDFIs studied in this report originated nearly 87 percent of their loans to borrowers with anincome below 80 percent of their area median income; and about two-thirds of their loans wentto minorities (Table ES-1).Table ES-1: Summary of characteristics of borrowers who received loans from CDFIsHouseholdNumberincome belowRacialCDFICityHispanic Female of CDFI80% of harlotte77.6%26.5%66.7%25.1%174NHSOCLa 32.3%n/a251NHSSVSan Jose99.0%32.8%3.5%61.7%201HomeSight cuse86.6%66.5%Weighted average* Reflects loans originated between 2004 and 2006.2.8%5.3%13.1%66.7%57.9%55.0%7276Source: Authors’ tabulation of CIIS data and loan level information provided by HomeSight, SFCU, and THF.These percentages consistently exceed the shares of loans made to such borrowers by traditionallenders, often by a wide margin. On average, these CDFIs make 3.3 times as high a share ofloans to low- and very-low-income people as do traditional lenders in the CDFIs’ own cities.And they make on average 2.7 times as high a share of their loans to minorities as do those otherlenders (Table ES-2).U.S. Department of the Treasury, CDFI Fund – Research Initiative
An Analysis of Successful CDFI Mortgage Lending Strategies in Six Cities5Table ES-2: Disparity ratios of borrower characteristics between CDFIs and all lendersHouseholdincome belowRacialCDFICityHispanicFemale80% of .20.7NHSOCLa Habra1.92.51.51.2THFNashville7.51.70.9n/aNHSSVSan Jose4.72.00.81.7HomeSight yracuse3.32.70.91.4Weighted averageSource: Authors’ tabulation of HMDA, CIIS data, and loan level information provided by HomeSight and THF.The majority of CDFI home purchase loans (an average of 56 percent of all loans originated byall seven CDFIs) go to buyers in lower-income neighborhoods (Table ES-3), despite the fact thatin general our study CDFIs allow clients to choose their homes throughout cities or counties(though in some cases with incentives to buy in certain neighborhoods).Table ES-3: Summary of share of loans made by CDFIs in lower-income census tractsCDFICityCMHPCharlotteNHSOCLa HabraTHFNashvilleNHSSVSan hted averageVery-low-incometractsLow-incometractsTotal of very-lowincome and lowincome 31.7%30.3%18.6%33.3%33.3
An Analysis of Successful CDFI Mortgage Lending Strategies in Six Cities Neil S. Mayer Neil S. Mayer and Associates . Kenneth Temkin . Temkin Associates . with research assistance from: Harry Chang . University of California, Berkeley . October 2008 . This Research was funded by a grant from the CDFI Fund, under Prime Contract GS-10F-
