Transcription
TEXAS OPTIMIZATION PROGRAM (TOP)DIRECTED ASSISTANCE MODULE (DAM) 2BJAR TESTING:HOW TO DESIGN AND PERFORM REPRESENTATIVEJAR TESTS FOR A SURFACE WATER TREATMENTPLANT (SWTP)STUDENT GUIDEMost recent revision date: September 8, 2019
Notes
Table of ContentsFigures . vTables. vDefinition of Terms, Acronyms, and Symbols . viiBottom Line: (Revise to be Intro, learning goals) . Error! Bookmark not defined.Purpose of surface water treatment, role of coagulation . 2SWTP barriers . 2Removal and inactivation . 2Turbidity monitoring . 4What makes coagulation necessary? . 5Factors Influencing Coagulation: . 10Velocity Gradient . 11Definition of Velocity Gradient: .11Calculation of Mean Velocity Gradient “G” Using Power Input:.11Calculation of Mean Velocity Gradient “G” Using Head Loss: .11Calculation of Mean Velocity Gradient “G” for Air Diffusers: .12Time Considerations: .13Temperature and Viscosity: .14Types of Mixers: .15Hydraulic Mixers . 16Mechanical Mixers . 21Sedimentation Basins . 26Definition of Surface Overflow Rate: .26Relation of SOR to Settling Rate: .28Definition of Hydraulic Detention Time (HDT): .29Bottom Line: . 29Square versus Round Jars: . 30Table of Conversion Factors: . 32Attachment 1 to the Student Guide . 36Chemical Feed Rate and Dosage Calculations Form. 36Directed Assistance Module 2-B . 36Establishing Appropriate Chemical Feed Rates. 36Using Representative Jar Testing . 36Chemical Feed Rate Measurement and Dosage Calculations . 1Chemical Feed Rate Measurements and Dosage Calculations . 1i
Chemical Feed Rate Measurement and Dosage Calculations (continued) . 3II. Chemical Feeder Calibration Data(1, 2). 3Attachment 2 to the Student Guide . 4Chemical Dosage Calculation . 4Directed Assistance Module 2-B . 4Establishing Appropriate Chemical Feed Rates. 4Using Representative Jar Testing . 4Chemical Dosage Calculations . 1Chemical Dosage Calculations (continued) . 2Summary of Methods for Calculating the Dose of Liquid Chemicals. 2Chemical Dosage Calculations (continued) . 4Volume Based Dosage Calculations for Liquid Aluminum Sulfate (Alum) . 6(and other liquid chemicals) . 6Feed Rate to Dosage Calculation for Volume Based Doses . 6Dosage to Feed Rate Calculation for Volume Based Doses . 6Stock Solution Calculations for Volume Based Doses . 7Liquid Weight Based Dosage Calculations for Liquid Aluminum Sulfate (Alum). 9(and other liquid chemicals) . 9Feed Rate to Dosage Calculation for Liquid Weight Doses . 9Feed Rate to Dosage Calculation for Liquid Weight Doses (Continued) . Error!Bookmark not defined.Dosage to Feed Rate Calculation for Liquid Weight Doses . 10Stock Solution Calculation for Liquid Weight Based Doses . 11Dry Weight Based Dosage Calculations for Liquid Aluminum Sulfate (Alum) and OtherLiquid Chemicals . 13Feed Rate to Dosage Calculation for Dry Weight Based Doses of LiquidAlum . 13Feed Rate to Dosage Calculation for Dry Weight Based Doses of LiquidAlum (continued) . Error! Bookmark not defined.Dosage to Feed Rate Calculations for Dry Weight Based Doses of LiquidAlum or Other Chemicals Mixed with Water . 15Stock Solution Calculations for Dry Weight Based Doses of Liquid Alum . 16or Other Chemicals Mixed with Water . 16Dosage Calculations for Gaseous Chemicals and Dry Chemicals. 17ii
Feed Rate to Dosage Calculations for Gas Chemicals . 17Feed Rate to Dosage Calculations for Solid Dry Chemicals . 17Dosage to Feed Rate Calculations for Gas Chemicals . 18Dosage to Feed Rate Calculations for Solid Dry Chemicals . 19Stock Solution Calculations for Dry Weight Based Doses of Liquid Alum . 19or Other Chemicals Mixed with Water). 19Attachment 3 to the Student Guide . 20Preparing Stock Solutions . 20Directed Assistance Module 2-B . 20Establishing Appropriate Chemical Feed Rates. 20Using Representative Jar Testing . 20Definitions . 1Preparing Stock Solutions . 2Preparing Stock Solutions (continued) . 3Attachment 4 to the Student Guide . 2Jar Testing Form . 2Directed Assistance Module 2-B . 2Establishing Appropriate Chemical Feed Rates. 2Using Representative Jar Testing . 2Jar Testing Form . 1More Than One Type of Jar Test . 2Jar Testing (continued) . 4Conventional Jar Tests . 4Initial rapid mix conditions . 4Dynamic Jar Tests . 5Attachment 5 to the Student Guide . 7Jar Test Comparison Form . 7Directed Assistance Module 2-B . 7Establishing Appropriate Chemical Feed Rates. 7Using Representative Jar Testing . 7JAR TEST COMPARISON FORM . 1Conventions in this Module . 5iii
Multiplied by: . 5Divided by: . 5Concentration (Conc.): . 5Residual (Res.) . 5Flow Rates versus Feed Rates:. 6Milligrams per Liter (mg/L) and parts per million (ppm): . 6Use of Exponents: . 6Order of Execution in Equations: . 6Attachment 6 to the Student Guide . 7Calculating Chemical Feed Rates . 7Directed Assistance Module 2-B . 7Establishing Appropriate Chemical Feed Rates. 7Using Representative Jar Testing . 7Calculating Chemical Feed Rates . 1Calculating Chemical Feed Rates (continued) . 2iv
FiguresFigure 1: Multi-barrier Approach to Producing Safe Drinking Water . 3Figure 2: Good Coagulation is Key to Effective Sedimentation. 4Figure 3: Size Ranges for Particles Found in Untreated Surface Water . 6Figure 4: Natural State of Small Particles in Water . 7Figure 5: Reactions Between Particles and Polymers . 9Figure 6: Types of Mixing Devices . 15Figure 7: Head Losses in Pipe Flow Hydraulic Mixing . 17Figure 8: Head Loss in a Baffled Basin . 18Figure 9: Venturi Section Mixer . 18Figure 10: Hydraulic Jump Mixer . 19Figure 11: Weir Mixer . 20Figure 12: In-line Static Mixer . 20Figure 14: Mechanical Mixers. 22Figure 15: In-line Mechanical Mixer . 23Figure 16: Horizontal Paddle Flocculator . 24Figure 17: Comparison of Turbulence in Round and Square Jars . 30Figure 18: Square 2-Liter Jars . 32TablesTable 1: Definition of Terms, Acronyms, and Symbols .viiTable 2: Relative Sizes and Characteristics of Particles (with a SpecificGravity of 2.65) in Water . 6Table 3: Typical Detention Times, Velocity Gradients and Gt Factors for RapidMix Units . 13Table 4: Water Temperature and Viscosity . 14Table 5: Detention Time Factors . 14Table 6: Impeller Power Number (Np) . 22Table 7: Typical Velocity Gradients in Tapered Mixing . 24Table 8: General Design Criteria for Flocculation Basins(a). 25Table 9: Configuration for Common Sedimentation Basins. 27Table 10: EPA Criteria for Process Evaluation: Sedimentation . 28v
Table 11: Settling Velocity of Selected Flocs . 28Table 12: Recommended Sedimentation/Clarification . 29Table 13: Conversion Factors . 33vi
Definition of Terms, Acronyms, and SymbolsTerm, Acronym,SymbolDefinitionAArea (square feet)AnionicNegatively chargedBbblCationicCryptoEPABend head losses in a pipeBarrelsPositively chargedCryptosporidiumEnvironmental Protection AgencyFFriction head losses in a pipeftfoot (feet)ft2Square foot (Square feet)ft3Cubic foot (Cubic feet)GVelocity gradient (sec-1)gAcceleration due to gravity (32.2 ft/sec2)gpgGrains-per-gallongpmGallons per minutegrGrainsGtGt Factor: Velocity gradient times thetime of contacthHead (feet of water)HDTHydraulic detention timeHLHead loss (feet of water)hrsHoursinInchesin2Square inch(es)KgKilogramsLlb (lbs.)mLitersPound (Pounds)Meter(s)vii
Term, Acronym,SymbolDefinitionm2Square meter(s)mCubic meter(s)mgMilligram(s)MGMillions of gallonsmg/LMilligrams per literMGDMillions of gallons per eter(s)With no ionic chargePropeller numberNephalometric Turbidity UnitCDegrees CentigradeFDegrees FahrenheitoopHppmQA measure of the acidity or basicity of acompoundParts-per-millionFlow rate (gpm, MGD, etc.)SecSecondsSORSurface overflow rateStds.StandardsT (t)TimeTSCTechnical Support CenterVVolume (cubic feet, gallons, MG, etc.)WtWeight of one cubic foot of water (62.4pounds)YrsYearsµViscosity [pound-seconds/square foot]viii
Learning goalsIn this DAM, we expect you to learn: How to mix stock solutions for jar testing,How to perform a jar test,Pros and cons of different jar testing methodsA successful jar testing procedure must successfully incorporate all themixing factors for flash mixing and flocculation and settling in order to be aneffective predictor of the performance of the plant.Historically, operators attend a surface water class or a laboratory classwhere a jar test is demonstrated and they come away with the idea that theway they were shown is exactly how it is always done. This is not, in fact, theway this training should be interpreted. Classroom demonstrations are fine,excepting that they are rarely adapted to a plant where water is beingtreated. In other words, they are not representative of what is going on inyour particular plant.In the following pages, we discuss 16 different mixing devices, and this doesnot include all the mixing units commonly found in Texas. We also discusselements of floc formation and settling. Representative jar testing meansthat the jar test procedure will imitate the coagulation, flocculation, andsettling conducted in the water plant. There is no single jar test procedurewill duplicate all of these processes for all plants, however, experience showsthat jar test procedures can be individually tailored to accurately predictperformance for almost every plant.DAM 2B: Jar TestingStudent GuidePage 1
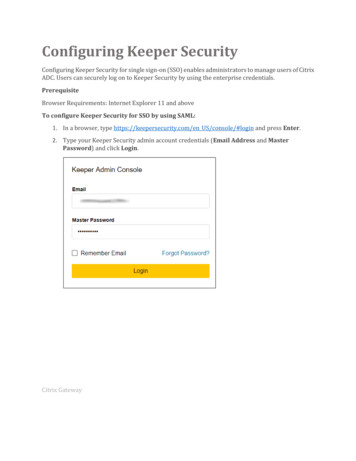
Purpose of surface water treatment,role of coagulationThe purpose of surface water treatment is to eliminate pathogens, which aremicrobes that can make people sick. Lakes and rivers are subject tocontamination by numerous sources of pathogens, from septic fields toanimal waste. Because of the potential to transmit pathogens or otherharmful constituents in surface water to the customers, surface watertreatment plants (SWTPs) use a multi-barrier approach to remove andinactivate bacteria, viruses, and protozoa and protect public health.SWTP barriersRemoval and inactivationSome pathogens are easily killed by a disinfectant. For example, almost allknown waterborne viruses are killed by chlorine after four minutes of contactwith 1 mg/L of free chlorine. However, other pathogens are very resistant todisinfectants. For example, a Cryptosporidium oocyst remains infective afterhalf-an-hour of contact with 25 mg/L of free chlorine. Therefore, somepathogens must be physically removed from the water.Therefore, SWTPs use a series of treatment “barriers” to inactivate (kill)and/or physically remove pathogens, as shown in Figure 1.DAM 2B: Jar TestingStudent GuidePage 2
Figure 1: Multi-barrier treatment units for removing and inactivatingpathogensThe barriers applicable to SWTPs include actual treatment processes andequipment, and also programs—like monitoring, maintenance, etc.Generally, the treatment barriers present in a SWTP include: Source water protection—elimination of potential sources ofpathogens,Coagulation, flocculation, and sedimentation—removal ofpotential pathogens,Filtration—removal, andDisinfection for inactivation (kill).The programmatic barriers in a SWTP include: Disinfectant monitoring (CT study, etc.),Turbidity monitoring, andStandards for operation, maintenance, and safety.There are also multiple barriers to the regrowth and persistence of pathogensin the distribution system, but those are outside the scope of this DAM.Each barrier has a role, and the topic of this DAM is the role of coagulation,flocculation, and sedimentation, and how to make sure that they are doingthe job they are intended for, using jar tests.DAM 2B: Jar TestingStudent GuidePage 3
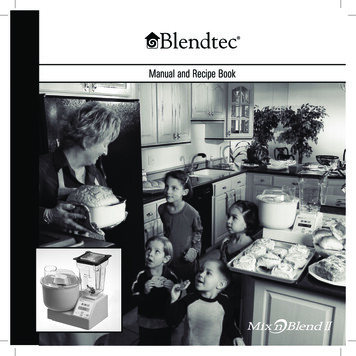
Turbidity monitoringBy monitoring turbidity, we can tell how successful pathogen removal is at aSWTP.Role of coagulationPathogens are tiny, they can be very hard to remove.Very generally, as shown in Figure 1, these barriers include source waterprotection, coagulation-flocculation, sedimentation, filtration, disinfection,and distribution.This may make you wonder “If these pathogens are so hard to remove, howcan it be done?”This is a reasonable question.Figure 2: Good Coagulation is Key to Effective SedimentationA generally accepted rule of thumb for designing drinking water treatmentDAM 2B: Jar TestingStudent GuidePage 4
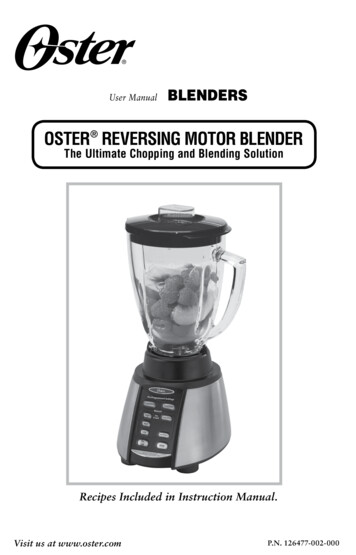
processes is that an efficient treatment unit should remove 90 to 95% of theparticles entering the unit. The same is true of sedimentation processes.However, when coagulant doses and mixing energy are not appliedeffectively, we can create too little floc to settle particles effectively, or wecan create a floc that is so light weight that it will not to settle out while it isstill in the settling basins.Figure 2 provides yet another reason why we would want to make thecoagulation, flocculation and sedimentation process as effective as possible.The filters are normally the last treatment unit where particles are physicallyremoved from the water. An EPA study devised to evaluate the effectivenessof filters showed that when they received water from basins where thecoagulation process was optimized, the filters removed Cryptosporidium 150times more effectively than when they received water from a coagulationprocess that was not optimized. Effective coagulation not only improvespathogen removal in the sedimentation basin, but in the filters, as well. Andthe degree of improvement demonstrated in Dugan’s study is huge. Whenthe coagulant dose is optimized, there will, most likely, be less subsequentpH adjustment required to stabilize the finished water pH at an acceptablelevel. Further, with fewer particles in the filtered water, one may reasonablyexpect that the oxidant demand of the water would be less, so smallerdisinfectant doses may be required. Therefore, efficient coagulation,flocculation, and sedimentation can also make multiple treatment processesmore cost effective.What makes coagulation necessary?Table 1 shows the relative diameters, total surface areas and settling timesrequired for particles with a specific gravity of 2.65 (representative ofgravel). Note that with each 10-fold reduction in diameter, there is a 10-foldincrease in the total surface area of the particles. The greater the surfacearea, the greater the effect of the viscosity of the water on the settlingparticles. Consequently, there is also an exponentially increasing amount oftime it takes for the particles to settle.Figure 3, shows the relative size of many of the particles found in raw surfacewater. Typically, these particles have a specific gravity much lower than2.65 and the settling time would be much longer than the times shown forthe particles of similar size in Table 2.DAM 2B: Jar TestingStudent GuidePage 5
Table 1: Relative Sizes and Characteristics of Particles (with a SpecificGravity of 2.65) in WaterNumber ofParticlesWeight ofAll Particles(mg)*Diameter ofParticle (inmm)For exampleTotal SurfaceAreaTimeRequired toSettle 1 ft11,38810Gravel0.487 in20.3 sec101,3881Coarse Sand4.87 in23 sec1001,3880.1Fine Sand48.7 in38 sec1,0001,3880.01Silt3.38 ft233 min10,0001,3880.001Bacteria33.8 ft55 hrs100,0001,3880.0001ColloidalParticles3.8 yd2230 days1,000,0001,3880.00001ColloidalParticles0.7 acres6.3 yrs10,000,0001,3880.000001ColloidalParticles7.0 acres63 yrs (min)22* Assumes all the particles are produced from a single spherical particle with a specificgravity of 2.65(Source: Faust and Aly, Principles of Water Treatment, Lewis Publishers, 1998, page 219)Figure 3: Size Ranges for Particles Found inUntreated Surface WaterThe particles in raw water include pathogens, sources of taste and odor, andsources of cloudiness, which most people find unacceptable. However, it isobvious that these particles will not settled out of the raw water in a timelyway unless we apply some treatment that will cause the particles to settlemore quickly.From Table 1, we see that the larger particles settle faster than smallerparticles of the same density. To remove the undesirable particles shown inFigure 3, we have to apply some kind of treatment that will make themDAM 2B: Jar TestingStudent GuidePage 6
larger with enough density to make them settle faster. It’s obvious that oneway to do this would be to make the particles “stickier” so that the increasedsize of the groups of particles sticking together would help them settle.What do we have to do to make the particles stickier? Figure 4 shows twoparticles suspended in water. Solid particles that have been in water a longtime normally reach a state of electro-chemical equilibrium. The surface areaof these particles, on balance, becomes negatively charged, and the particlesbecome surrounded by a layer of water populated by positively charged ionsheld in place by the negative charges on the particle surface.Figure 4: Natural State of SmallParticles in WaterBecause the layers of positively charged ions repel each other, if we want tocause the particles to bond together so that they will settle faster, we have todo something to reduce the impact of these positive charges. There aremany ways to treat the particles to make them attract rather than repel, andthere are a lot of scientific terms to describe the nature of the chemicalinteraction that these treatments employ. The names and descriptions of theprocesses are not as important as the fact that we understand thatsomething must be done to create larger particles. The most elementary partof the processes we use to cause particles to be attracted to each other andsettle out is that we must “destabilize” them so that they will no longer repeleach other. Above that, we want to create bridges between the particles tohelp build even larger, settleable floc.DAM 2B: Jar TestingStudent GuidePage 7
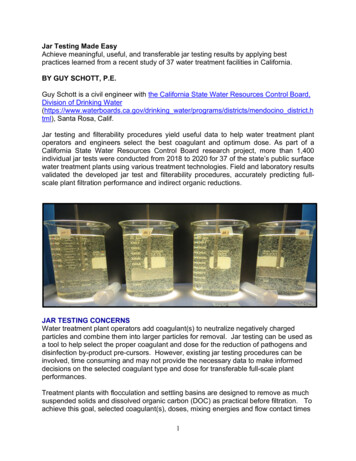
The most common treatments are with chemicals such as alum, ferricchloride, etc. In the right doses and with the right mixing, these chemicalsdestabilize suspended particles and create the bridges necessary to settleparticles. There are also many polymers that are used as a primary coagulantor coagulant aid. Figure 5 shows some of the ways that polymers interactwith particles. 1The first interaction, shown in the first panel of Figure 5, is to destabilize theparticles.The second interaction, shown in the second panel, if we use the right doseof polymer, and if we apply the correct amount of energy, creates floc.If we have used too much polymer, the second interaction will be torestabilize the particles without creating floc, as shown in the third panel.The polymer interactions are shown simply because they easier to depict than theinteractions with metal salts. However, the impact of the interactions are essentiallythe same.1DAM 2B: Jar TestingStudent GuidePage 8
Figure 5: Reactions BetweenParticles and PolymersThe fourth panel shows that if we create a floc and then apply an excess ofenergy, any floc formed will then be torn apart.While the interactions of chemicals like alum and ferric chloride are differentthan the chemical reactions with polymers, the same principles of ensuringthe coagulant doses and mixing energy are applied correctly are essential toforming settleable floc. Three very important question are:1. How do we determine which coagulant will produce the best mostsettleable floc?2. How do we determine the best dose?3. How do we know how much mixing energy to apply?The answer to the first question is: 1) we most often determine the bestcoagulant (or combination of coagulants) by past experience and byexperimentation. 2) The second most common way is that, when acoagulant that has been effective in the past stops working, we may want toDAM 2B: Jar TestingStudent GuidePage 9
try a coagulant with a different charge. For example if we have been using acationic coagulant and it stops working following an extreme rain event, wemay want to try an anionic polymer or non-ionic polymer to restore effectivecoagulation.The answer to the second question should be: “by representative jar testing”.The answer to the third question should be: “by representative jar testing”.Factors Influencing Coagulation:One of the most common complaints we hear about jar testing is that itdoesn’t help find the most effective coagulant or the most effective coagulantdose. A more accurate description of the issue would be, “The way that jartesting is most often conducted, the test doesn’t help find the most effectivecoagulant or coagulant dose.” With a jar test, we are attempting to predictthe performance of our flash mixing, flocculation, and sedimentationprocesses by duplicating the plant performance in a small volume test. Inorder to devise a successful jar test, we have to control as many of thefactors influencing coagulation as we can. The following factors are the keyones that we can account for during jar testing: pH: pH is a very important variable. Some coagulants perform well in lowpH ranges and others in higher ranges. When using a coagulant chemicalthat is acidic and the raw water alkalinity is low, alkalinity may have to beadded, as well. Our jar test should be conducted at the same pH andalkalinity that we have in the flash mixing units, the flocculation units, andthe settling units. Further, if a pH adjustment or alkalinity adjustmentchemical takes a long time to reach a complete reaction (for example, limetakes 45 to 60 minutes to fully react), the jar test must take this elementof the coagulation process into account. Temperature: The colder the water, the slower the chemical reaction withthe coagulant. Also, the colder the water, the more viscous it is, and theslower the floc will settle. For this reason, jar test should be conductedwith waters that are at about the same temperature as the units in thetreatment plant. Dosage: The jar tests should be dosed with the same coagulants andcoagulant aids in the same range of doses we expect to use in the plant. Time: The formation of an initial
Sep 08, 2019 · DAM 2B: Jar Testing Student Guide Page 2 Purpose of surface water treatment, role of coagulation The purpose of surface water treatment is to eliminate pathogens, which are microbes that can make people sick. Lakes and rivers are subject to contamination by numerous