Transcription
Unit 1Remote sensingUNIT 1: REMOTE SENSING1.1.Introduction1.1.1 Electromagnetic Radiation1.2.Electromagnetic Spectrum1.2.1 Interactions with the Atmosphere1.2.2 Radiation - Target Interactions1.3.Component of Remote sensing1.3.1 Introduction1.3.2 Spectral Response1.3.3 Passive vs. Active Sensing1.3.4 A mechanical scanning radiometer (Whisk Broom1.3.5 A push broom radiometer1.4.Resolutions1.4.1 Spatial Resolution, Pixel Size, and Scale1.4.2 Spectral Resolution1.4.3 Radiometric Resolution1.4.4 Temporal .Suggested Readings1.9.Terminal QuestionsRemote Sensing and GPS1Uttarakhand Open University
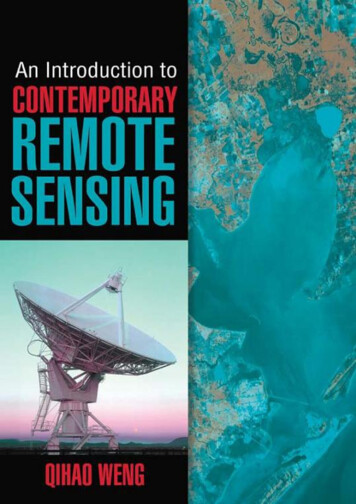
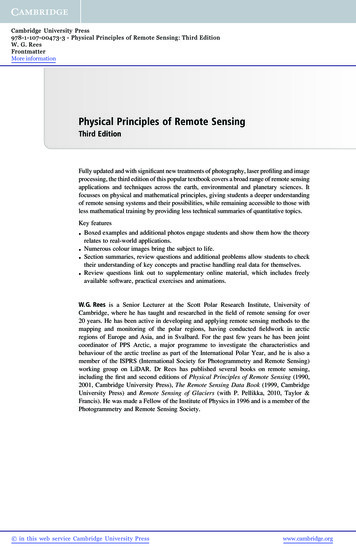
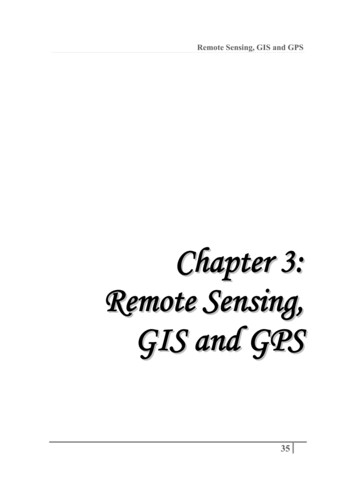
Unit 1Remote sensing1.1 Introduction"Remote sensing is the science (and to some extent, art) of acquiring information aboutthe Earth's surface without actually being in contact with it. This is done by sensing andrecording reflected or emitted energy and processing, analyzing, and applying thatinformation." In much of remote sensing, the process involves an interaction betweenincident radiation and the targets of interest. This is exemplified by the use of imagingsystems where the following seven elements are involved. Note, however that remotesensing also involves the sensing of emitted energy and the use of non-imaging sensors.Fig 1.1: Remote sensing1. Energy Source or Illumination (A) – the first requirement for remote sensingis to have an energy source which illuminates or provides electromagnetic energyto the target of interest.2. Radiation and the Atmosphere (B) – as the energy travels from its source tothe target, it will come in contact with and interact with the atmosphere it passesthrough. This interaction may take place a second time as the energy travels fromthe target to the sensor.3. Interaction with the Target (C) - once the energy makes its way to the targetthrough the atmosphere, it interacts with the target depending on the properties ofboth the target and the radiation.Remote Sensing and GPS2Uttarakhand Open University
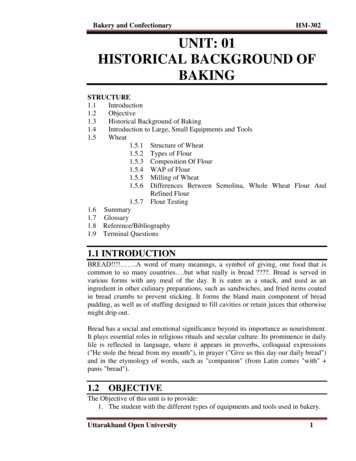
Unit 1Remote sensing4. Recording of Energy by the Sensor (D) - after the energy has been scatteredby, or emitted from the target, we require a sensor (remote - not in contact withthe target) to collect and record the electromagnetic radiation.5. Transmission, Reception, and Processing (E) - the energy recorded by thesensor has to be transmitted, often in electronic form, to a receiving andprocessing station where the data are processed into an image (hardcopy and/ordigital).6. Interpretation and Analysis (F) - the processed image is interpreted, visuallyand/or digitally or electronically, to extract information about the target whichwas illuminated.7. Application (G) - the final element of the remote sensing process is achievedwhen we apply the information we have been able to extract from the imageryabout the target in order to better understand it, reveal some new information, orassist in solving a particular problem.These seven elements comprise the remote sensing process from beginning to end. Wewill be covering all of these in sequential order throughout the five chapters of thistutorial, building upon the information learned as we go. Enjoy the journey!1.1.1 Electromagnetic RadiationAs was noted in the previous section, the first requirement for remote sensing is tohave an energy source to illuminate the target (unless the sensed energy is beingemitted by the target). This energy is in the form of electromagnetic radiation.Remote Sensing and GPS3Uttarakhand Open University
Unit 1Remote sensingFig 1.2: Electromagnetic radiationAll electromagnetic radiation has fundamental properties and behaves inpredictable ways according to the basics of wave theory. Electromagneticradiation consists of an electrical field(E) which varies in magnitude in adirection perpendicular to the direction in which the radiation is traveling, and amagnetic field (M) oriented at right angles to the electrical field. Both these fieldstravel at the speed of light (c). Two characteristics of electromagnetic radiationare particularly important for understanding remote sensing. These are thewavelength and frequency.Fig 1.3: wavelength and frequencyRemote Sensing and GPS4Uttarakhand Open University
Unit 1Remote sensingThe wavelength is the length of one wave cycle, which can be measured as thedistance between successive wave crests. Wavelength is usually represented bythe Greek letter lambda (λ). Wavelength is measured in metres (m) or some factorof metres such as nanometres (nm, 10-9 metres), micrometres (µm, 10-6 metres)(µm, 10-6 metres) or centimetres (cm, 10-2 metres). Frequency refers to thenumber of cycles of a wave passing a fixed point per unit of time. Frequency isnormally measured in hertz (Hz), equivalent to one cycle per second, and variousmultiples of hertz. Wavelength and frequency are related by the followingformula:Therefore, the two are inversely related to each other. The shorter thewavelength, the higher the frequency. The longer the wavelength, the lower thefrequency. Understanding the characteristics of electromagnetic radiation interms of their wavelength and frequency is crucial to understanding theinformation to be extracted from remote sensing data. Next we will be examiningthe way in which we categorize electromagnetic radiation for just that purpose.1.2 Electromagnetic SpectrumThe electromagnetic spectrum ranges from the shorter wavelengths (including gammaand x-rays) to the longer wavelengths (including microwaves and broadcast radiowaves). There are several regions of the electromagnetic spectrum which are useful forremote sensing.Remote Sensing and GPS5Uttarakhand Open University
Unit 1Remote sensingFig 1.4: Electromagnetic spectrumFor most purposes, the ultraviolet or UV portion of the spectrum has the shortestwavelengths which are practical for remote sensing. This radiation is just beyond theviolet portion of the visible wavelengths, hence its name. Some Earth surface materials,primarily rocks and minerals, fluoresce or emit visible light when illuminated by UVradiation.Fig. 1.5: Electromagnetic spectrumRemote Sensing and GPS6Uttarakhand Open University
Unit 1Remote sensingThe light which our eyes - our "remote sensors" - can detect is part of the visiblespectrum. It is important to recognize how small the visible portion is relative to the restof the spectrum. There is a lot of radiation around us which is "invisible" to our eyes, butcan be detected by other remote sensing instruments and used to our advantage. Thevisible wavelengths cover a range from approximately 0.4 to 0.7 µm. The longest visiblewavelength is red and the shortest is violet. Common wavelengths of what we perceive asparticular colours from the visible portion of the spectrum are listed below. It isimportant to note that this is the only portion of the spectrum we can associate with theconcept of colours.Violet: 0.4 - 0.446 µmBlue: 0.446 - 0.500 µmGreen: 0.500 - 0.578 µmYellow: 0.578 - 0.592 µmOrange: 0.592 - 0.620 µmRed: 0.620 - 0.7 µmFig. 1.6: Visible spectrumBlue, green, and red are the primary colours or wavelengths of the visible spectrum.They are defined as such because no single primary colour can be created from the othertwo, but all other colours can be formed by combining blue, green, and red in variousRemote Sensing and GPS7Uttarakhand Open University
Unit 1Remote sensingproportions. Although we see sunlight as a uniform or homogeneous colour, it is actuallycomposed of various wavelengths of radiation in primarily the ultraviolet, visible andinfrared portions of the spectrum. The visible portion of this radiation can be shown in itscomponent colours when sunlight is passed through a prism, which bends the light indiffering amounts according to wavelength.The next portion of the spectrum of interest is the infrared (IR) region which covers thewavelength range from approximately 0.7 µm to 100 µm - more than 100 times as wide asthe visible portion! The infrared region can be divided into two categories based on theirradiation properties - the reflected IR, and the emitted or thermal IR.Fig. 1.7: InfraredRadiation in the reflected IR region is used for remote sensing purposes in ways verysimilar to radiation in the visible portion. The reflected IR covers wavelengths fromapproximately 0.7 µm to 3.0 µm. The thermal IR region is quite different than the visibleand reflected IR portions, as this energy is essentially the radiation that is emitted fromthe Earth's surface in the form of heat. The thermal IR covers wavelengths fromapproximately 3.0 µm to 100 µm.Remote Sensing and GPS8Uttarakhand Open University
Unit 1Remote sensingFig. 1.8: MicrowaveThe portion of the spectrum of more recent interest to remote sensing is the microwaveregion from about 1 mm to 1 m. This covers the longest wavelengths used for remotesensing. The shorter wavelengths have properties similar to the thermal infrared regionwhile the longer wavelengths approach the wavelengths used for radio broadcasts.Because of the special nature of this region and its importance to remote sensing inCanada, an entire chapter (Chapter 3) of the tutorial is dedicated to microwave sensing.1.2.1 Interactions with the AtmosphereBefore radiation used for remote sensing reaches the Earth's surface it has totravel through some distance of the Earth's atmosphere. Particles and gases inthe atmosphere can affect the incoming light and radiation. These effects arecaused by the mechanisms of scattering and absorption.Remote Sensing and GPS9Uttarakhand Open University
Unit 1Remote sensingFig. 1.9: Interactions with the AtmosphereScattering occurs when particles or large gas molecules present in theatmosphere interact with and cause the electromagnetic radiation to be redirectedfrom its original path. How much scattering takes place depends on severalfactors including the wavelength of the radiation, the abundance of particles orgases, and the distance the radiation travels through the atmosphere. There arethree (3) types of scattering which take place.Fig. 1.10: ScatteringRayleigh scattering occurs when particles are very small compared to thewavelength of the radiation.Remote Sensing and GPS10Uttarakhand Open University
Unit 1Remote sensingFig. 1.11: Rayleigh scatteringThese could be particles such as small specks of dust or nitrogen and oxygenmolecules. Rayleigh scattering causes shorter wavelengths of energy to bescattered much more than longer wavelengths. Rayleigh scattering is thedominant scattering mechanism in the upper atmosphere. The fact that the skyappears "blue" during the day is because of this phenomenon. As sunlight passesthrough the atmosphere, the shorter wavelengths (i.e. blue) of the visible spectrumare scattered more than the other (longer) visible wavelengths. At sunrise andsunset the light has to travel farther through the atmosphere than at midday andthe scattering of the shorter wavelengths is more complete; this leaves a greaterproportion of the longer wavelengths to penetrate the atmosphere.Mie scattering occurs when the particles are just about the same size as thewavelength of the radiation.Fig. 1.12: Mie scatteringRemote Sensing and GPS11Uttarakhand Open University
Unit 1Remote sensingDust, pollen, smoke and water vapour are common causes of Mie scatteringwhich tends to affect longer wavelengths than those affected by Rayleighscattering. Mie scattering occurs mostly in the lower portions of the atmospherewhere larger particles are more abundant, and dominates when cloud conditionsare overcast. The final scattering mechanism of importance is called nonselectivescattering. This occurs when the particles are much larger than the wavelength ofthe radiation. Water droplets and large dust particles can cause this type ofscattering. Nonselective scattering gets its name from the fact that all wavelengthsare scattered about equally. This type of scattering causes fog and clouds toappear white to our eyes because blue, green, and red light are all scattered inapproximately equal quantities (blue green red light white light).Absorption is the other main mechanism at work when electromagnetic radiationinteracts with the atmosphere. In contrast to scattering, this phenomenon causesmolecules in the atmosphere to absorb energy at various wavelengths.Fig. 1.13: AbsorptionOzone, carbon dioxide, and water vapour are the three main atmosphericconstituents which absorb radiation. Ozone serves to absorb the harmful (to mostliving things) ultraviolet radiation from the sun. Without this protective layer inthe atmosphere our skin would burn when exposed to sunlight. You may haveheard carbon dioxide referred to as a greenhouse gas. This is because it tends toRemote Sensing and GPS12Uttarakhand Open University
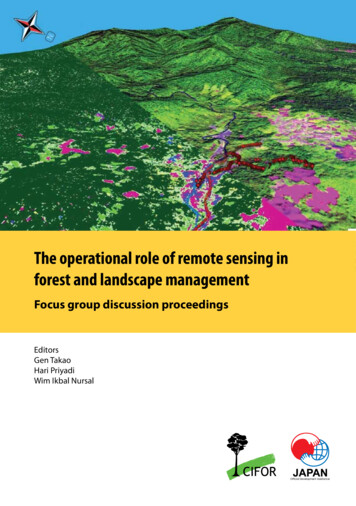
Unit 1Remote sensingabsorb radiation strongly in the far infrared portion of the spectrum - that areaassociated with thermal heating - which serves to trap this heat inside theatmosphere. Water vapour in the atmosphere absorbs much of the incominglongwave infrared and shortwave microwave radiation (between 22µm and 1m).The presence of water vapour in the lower atmosphere varies greatly fromlocation to location and at different times of the year. For example, the air massabove a desert would have very little water vapour to absorb energy, while thetropics would have high concentrations of water vapour (i.e. high humidity).Because these gases absorb electromagnetic energy in very specific regions of thespectrum, they influence where (in the spectrum) we can "look" for remotesensing purposes.Those areas of the spectrum which are not severely influenced by atmosphericabsorption and thus, are useful to remote sensors, are called atmosphericwindows. By comparing the characteristics of the two most commonenergy/radiation sources (the sun and the earth) with the atmospheric windowsavailable to us, we can define those wavelengths that we can use most effectivelyfor remote sensing.Fig. 1.14: Atmospheric windowsRemote Sensing and GPS13Uttarakhand Open University
Unit 1Remote sensingAtmospheric windows (unshaded). Vertical axis is atmospheric transmission (%).Horizontal axis is the logarithm of the wavelength in micrometres1.2.2 Radiation - Target InteractionsRadiation that is not absorbed or scattered in the atmosphere can reach andinteract with the Earth's surface. There are three (3) forms of interaction that cantake place when energy strikes, or is incident (I) upon the surface. These are:absorption (A); transmission (T); and reflection (R). The total incident energywill interact with the surface in one or more of these three ways. The proportionsof each will depend on the wavelength of the energy and the material andcondition of the feature.Fig. 1.15: Target interactionAbsorption (A) occurs when radiation (energy) is absorbed into the target whiletransmission (T) occurs when radiation passes through a target.Remote Sensing and GPS14Uttarakhand Open University
Unit 1Remote sensingFig. 1.16: ReflectionReflection (R) occurs when radiation "bounces" off the target and is redirected. Inremote sensing, we are most interested in measuring the radiation reflected fromtargets. We refer to two types of reflection, which represent the two extreme endsof the way in which energy is reflected from a target: specular reflection anddiffuse reflection.When a surface is smooth we get specular or mirror-like reflection where all (oralmost all) of the energy is directed away from the surface in a single direction.Diffuse reflection occurs when the surface is rough and the energy is reflectedalmost uniformly in all directions.Fig. 1.17: DiffusionMost earth surface features lie somewhere between perfectly specular or perfectlydiffuse reflectors. Whether a particular target reflects specularly or diffusely, orRemote Sensing and GPS15Uttarakhand Open University
Unit 1Remote sensingsomewhere in between, depends on the surface roughness of the feature incomparison to the wavelength of the incoming radiation. If the wavelengths aremuch smaller than the surface variations or the particle sizes that make up thesurface, diffuse reflection will dominate. For example, finegrained sand wouldappear fairly smooth to long wavelength microwaves but would appear quiterough to the visible wavelengths. Let's take a look at a couple of examples oftargets at the Earth's surface and how energy at the visible and infraredwavelengths interacts with them.Fig. 1.18: IR interactionLeaves: A chemical compound in leaves called chlorophyll strongly absorbsradiation in the red and blue wavelengths but reflects green wavelengths. Leavesappear "greenest" to us in the summer, when chlorophyll content is at itsmaximum. In autumn, there is less chlorophyll in the leaves, so there is lessabsorption and proportionately more reflection of the red wavelengths, makingthe leaves appear red or yellow (yellow is a combination of red and greenwavelengths). The internal structure of healthy leaves act as excellent diffusereflectors of near-infrared wavelengths. If our eyes were sensitive to nearinfrared, trees would appear extremely bright to us at these wavelengths. In fact,measuring and monitoring the near-IR reflectance is one way that scientists candetermine how healthy (or unhealthy) vegetation may be.Remote Sensing and GPS16Uttarakhand Open University
Unit 1Remote sensingFig. 1.19: WaterWater: Longer wavelength visible and near infrared radiation is absorbed moreby water than shorter visible wavelengths. Thus water typically looks blue orblue-green due to stronger reflectance at these shorter wavelengths, and darker ifviewed at red or near infrared wavelengths. If there is suspended sedimentpresent in the upper layers of the water body, then this will allow betterreflectivity and a brighter appearance of the water. The apparent colour of thewater will show a slight shift to longer wavelengths. Suspended sediment (S) canbe easily confused with shallow (but clear) water, since these two phenomenaappear very similar. Chlorophyll in algae absorbs more of the blue wavelengthsand reflects the green, making the water appear more green in colour when algaeis present. The topography of the water surface (rough, smooth, floatingmaterials, etc.) can also lead to complications for water-related interpretationdue to potential problems of specular reflection and other influences on colourand brightness. We can see from these examples that, depending on the complexmake-up of the target that is being looked at, and the wavelengths of radiationinvolved, we can observe very different responses to the mechanisms ofabsorption, transmission, and reflection. By measuring the energy that is reflected(or emitted) by targets on the Earth's surface over a variety of differentwavelengths, we can build up a spectral response for that object. By comparingthe response patterns of different features we may be able to distinguish betweenthem, where we might not be able to, if we only compared them at onewavelength. For example, water and vegetation may reflect somewhat similarly inRemote Sensing and GPS17Uttarakhand Open University
Unit 1Remote sensingthe visible wavelengths but are almost always separable in the infrared. Spectralresponse can be quite variable, even for the same target type, and can also varywith time (e.g. "green-ness" of leaves) and location. Knowing where to "look"spectrally and understanding the factors which influence the spectral response ofthe features of interest are critical to correctly interpreting the interaction ofelectromagnetic radiation with the surface.1.3 Component of Remote sensing1.3.1 IntroductionAn image refers to any pictorial representation, regardless of what wavelengthsor remote sensing device has been used to detect and record the electromagneticenergy. A photograph refers specifically to images that have been detected aswell as recorded on photographic film. The black and white photo to the left, ofpart of the city of Ottawa, Canada was taken in the visible part of the spectrum.Photos are normally recorded over the wavelength range from 0.3 µm to 0.9 µm the visible and reflected infrared. Based on these definitions, we can say that allphotographs are images, but not all images are photographs. Therefore, unlesswe are talking specifically about an image recorded photographically, we use theterm image.Remote Sensing and GPS18Uttarakhand Open University
Unit 1Remote sensingFig. 1.20: Digital formatA photograph could also be represented and displayed in a digital format bysubdividing the image into small equal-sized and shaped areas, called pictureelements or pixels, and representing the brightness of each area with a numericvalue or digital number. Indeed, that is exactly what has been done to the phototo the left. In fact, using the definitions we have just discussed, this is actually adigital image of the original photograph! The photograph was scanned andsubdivided into pixels with each pixel assigned a digital number representing itsrelative brightness. The computer displays each digital value as differentbrightness levels. Sensors that record electromagnetic energy, electronicallyrecord the energy as an array of numbers in digital format right from the start.These two different ways of representing and displaying remote sensing data,either pictorially or digitally, are interchangeable as they convey the sameinformation (although some detail may be lost when converting back and forth).In previous sections we described the visible portion of the spectrum and theconcept of colours. We see colour because our eyes detect the entire visible rangeof wavelengths and our brains process the information into separate colours. Canyou imagine what the world would look like if we could only see very narrowranges of wavelengths or colours? That is how many sensors work. Theinformation from a narrow wavelength range is gathered and stored inRemote Sensing and GPS19Uttarakhand Open University
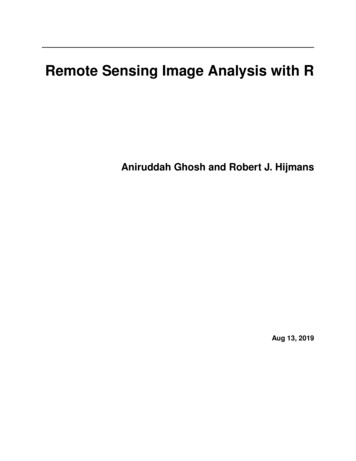
Unit 1Remote sensinga channel, also sometimes referred to as a band. We can combine and displaychannels of information digitally using the three primary colours (blue, green,and red). The data from each channel is represented as one of the primarycolours and, depending on the relative brightness (i.e. the digital value) of eachpixel in each channel, the primary colours combine in different proportions torepresent different colours.Fig. 1.21: DisplayWhen we use this method to display a single channel or range of wavelengths, weare actually displaying that channel through all three primary colours. Becausethe brightness level of each pixel is the same for each primary colour, theycombine to form a black and white image, showing various shades of gray fromblack to white. When we display more than one channel each as a differentprimary colour, then the brightness levels may be different for1.3.2 Spectral ResponseFor any given material, the amount of solar radiation that it reflects, absorbs,transmits, or emits varies with wavelength.Remote Sensing and GPS20Uttarakhand Open University
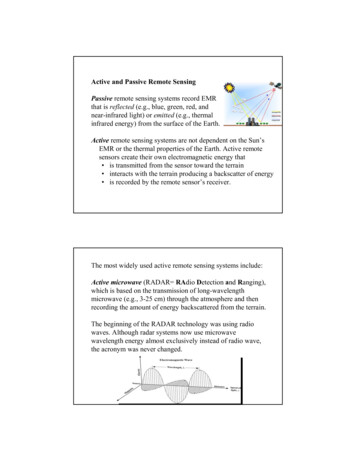
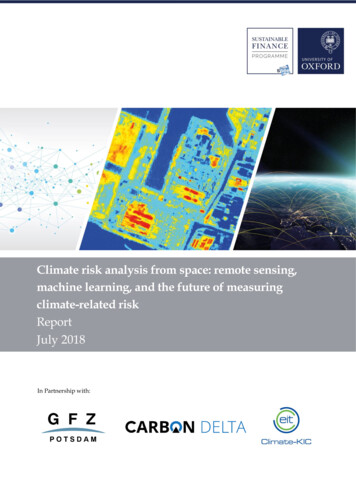
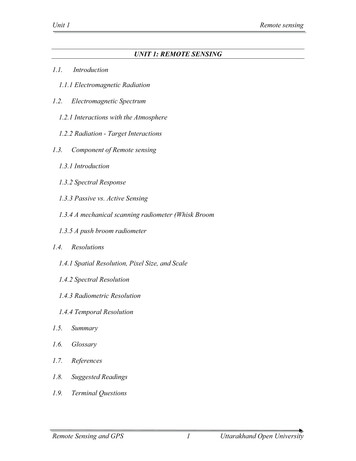
Unit 1Remote sensingFig.1.22: EMRWhen that amount (usually intensity, as a percent of maximum) coming from thematerial is plotted over a range of wavelengths, the connected points produce acurve called the material’s spectral signature (spectral response curve). Here is ageneral example of a reflectance plot for some (unspecified) vegetation type (bioorganic material), with the dominating factor influencing each interval of thecurve so indicated; note the downturns of the curve that result from selectiveabsorption:Remote Sensing and GPS21Uttarakhand Open University
Unit 1Remote sensingFig. 1.23: Spectral response curveThis important property of matter makes it possible to identify differentsubstances or classes and to separate them by their individual spectral signatures,as shown in the figure below.Remote Sensing and GPS22Uttarakhand Open University
Unit 1Remote sensingFor example, at some wavelengths, sand reflects more energy than greenvegetation but at other wavelengths it absorbs more (reflects less) than does thevegetation. In principle, we can recognize various kinds of surface materials anddistinguish them from each other by these differences in reflectance. Of course,there must be some suitable method for measuring these differences as a functionof wavelength and intensity (as a fraction [normally in percent] of the amount ofirradiating radiation). Using reflectance differences, we may be able todistinguish the four common surface materials in the above signatures (GL grasslands; PW pinewoods; RS red sand; SW silty water) simply byplotting the reflectances of each material at two wavelengths, commonly a fewtens (or more) of micrometers apart.1.3.3 Passive vs. Active SensingSo far, throughout this chapter, we have made various references to the sun as asource ofenergy or radiation. The sun provides a very convenient source of energy forremote sensing. The sun's energy is either reflected, as it is for visiblewavelengths, or absorbed and then reemitted, as it is for thermal infraredwavelengths. Remote sensing systems which measure energy that is naturallyavailable are called passive sensors. Passive sensors can only be used to detectRemote Sensing and GPS23Uttarakhand Open University
Unit 1Remote sensingenergy when the naturally occurring energy is available. For all reflected energy,this can only take place during the time when the sun is illuminating the Earth.There is no reflected energy available from the sun at night. Energy that isnaturally emitted (such as thermal infrared) can be detected day or night, as longas the amount of energy is large enough to be recorded.Fig. 1.24: Detecting EMRThese sensors are called radiometers and they can detect EMR within theultraviolet to microwave wavelengths. Two important spatial characteristics ofpassive sensors are:Their “instantaneous field of view” (IFOV) - this is the angle over which thedetector is sensitive to radiation. This will control the picture element (pixel) sizewhich gives the ground (spatial) resolution of the ultimate image i.e. the spatialresolution is a function of the detector angle and the height of the sensor abovethe ground. For more details on spatial, spectral, radiometric and temporalresolutions.Remote Sensing and GPS24Uttarakhand Open University
Unit 1Remote sensingThe Concept of IFOV and AFOV (after Avery and Berlin, 1985)Fig. 1.25: AFOVThe “swath width” - this is the linear ground distance over which the scanner istracking (at right angles to the line of flight). It is determined by the angular fieldof view (AFOV - or scanning angle) of the scanner. The greater the scanningangle, the greater the swath width.There are two main categories of passive sensor:1.3.4 A mechanical scanning radiometer (Whisk Broom).This is an electro-optical imaging system on which an oscillating or rotatingmirror directs the incoming radiation onto a detector as a series of scan-linesperpendicular to the line of flight. The collected energy on the detector isconverted into an electrical signal. This signal is then recorded in a suitablycoded digital format, together with additional data for radiometric and geometricRemote Sensing and GPS25Uttarakhand Open University
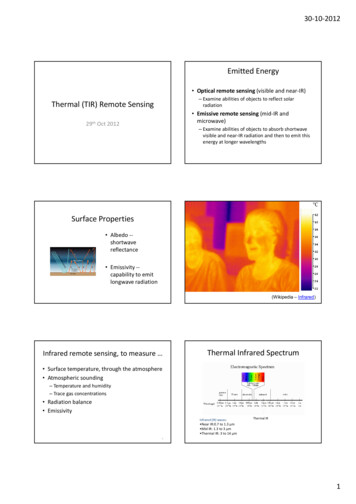
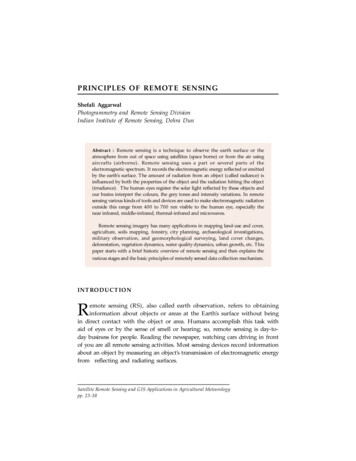
Unit 1Remote sensingcalibration and correction, directly on magnetic tape on board the sensorplatform.1.3.5 A push broom radiometerThis uses a wide angle optical system in which all the scenes across the AFOVare imaged on a detector array at one time, i.e. there is no mechanical movement.As the sensor moves along the flight line, successive lines are imaged by thesensor and sampled by a multiflexer for transmission. The push broom system isgenerally better than the mechanical scanner since there is less noise in thesignal, there are no moving parts and it has a high geometrical accuracy.Characteristics of a Push Broom Radiometer (after Avery and Berlin, 1985)Remote Sensing and GPS26Uttarakhand Open University
Unit 1Remote sensingFig. 1.26: Push Broom RadiometerActive sensors, on the other hand, provide their own energy source forillumination. The sensor emits radiation which is directed toward the target to beinvestigated. The radiation reflected from that target is detected and measured bythe sensor. Advantages for active sensors include the ability to obtainmeasurements anytime, regardless of the time of day or season. Active sensorscan be used for examining wavelengths that are not sufficiently provided by thesun, such as microwaves, or to better control the way a target is illuminated.However, active systems require the generation of a fairly large amount of energyto adequately illuminate targets. Some examples of active sensors are a laserfluro-sensor and synthetic aperture radar (SAR).We will review briefly airborne and satellite active systems, which are commonlycalled Radar, and which are generally classified either imaging or non-imaging:Imaging Radars. These display the radar backscatter characteristics of the earth'ssurface in the form of a strip map or a picture of a selected area. A type used inaircraft is the SLAR whose sensor scans an area not directly below the aircraft,but at an angle to the vertical, i.e. it looks sideways to record the relative intensityof the reflections so as to produce an image of a narrow strip of terrain.Sequential strips are recorded as the aircraft moves forward allowing a completeimage to be built up. The SLAR is unsuitable for satellites since, to achieve auseful spatial resolution, it would require a very large antenna. A variant used inRemote Sensing and GPS27Uttarakhand Open University
Unit 1Remote sensingsatellites is the SAR whose short antenna gives the effect of being several hundredtimes longer by recording and processing modified data.The Synthetic Aperture Radar System (after Avery and Berlin, 1985)Fig. 1.2
Remote Sensing and GPS 2 Uttarakhand Open University 1.1 Introduction "Remote sensing is the science (and to some extent, art) of acquiring information about the Earth's surface without actually being in contact with it. This is done by sensing and recording reflected or emitted energy and processing, analyzing, and applying that