Transcription
NanoVNAVery tiny handheld Vector Network AnalyzerUser Guidegen111.taobao.com2019-07-11
Overview:We designed NanoVNA based on edy555 (https://twitter.com/edy555), butmodified some circuits, added battery management circuits, and redesigned thePCB. The PC control software can export Touchstone (snp) files which can be usedfor various radio design and simulation software. The improved frequencyalgorithm can use the odd harmonic extension of si5351 to support themeasurement frequency up to 900MHz. The metal shield is designed to reducethe external interference and improve the measurement accuracy. The 50k300MHz frequency range of the si5351 direct output provides better than 70dBdynamic. The extended 300M-600MHz band provides better than 50dB ofdynamics, and the 600M-900M band is better than 40dB of dynamics. is verytiny handheld Vector Network Analyzer (VNA). It is standalone with lcd display,portable device with battery. This project aim to provide an RF gadget but usefulinstrument for enthusiast.DIY's vector network analyzer, with reference to the related design of. Designedwith simple and practical PC control software, you can export Touchstone (snp)files for various radio design and simulation software through PC software.NanoVNA is an open source hardware project, everyone can be free to clone andDIY, but we hope you can do more understanding before you do it, there aresome customers reflected that they have bought the low quality nanoVNA fromother sources. We have found some low quality clones on the Internet whichclaimed have completed the project. Buying such hardware may be harm onNanoVNA performance, or leading to measurement error.We will continue to provide updates and technical support services for NanoVNAwithin 3 years after purchase. You can get the latest detail of products andsoftware updates from the Web Store: gen111.taobao.com.We provide 5 firmware on the network hard drive, you can choose theappropriate brush in accordance with the relevant tutorials, 5 firmwaredifferences are as follows:nanoVNA 300 ch:50K-300MHz,5*7 Bitmap font,4 tracksnanoVNA 900 ch:50K-900MHz,5*7 Bitmap font,4 tracks(Default)nanoVNA 900 aa:50K-900MHz,7*13 Bitmap font,2 tracks (Antenna Analyzer)The 800MHz firmware works better at higher temperatures.nanoVNA 800 ch:50K-900MHz,5*7 Bitmap font,4 tracks(Recommended)nanoVNA 800 aa:50K-900MHz,7*13 Bitmap font,2 tracks (Antenna Analyzer)
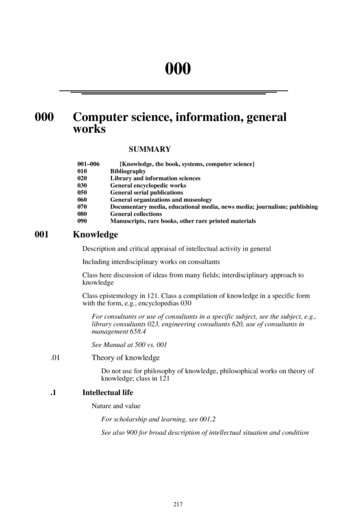
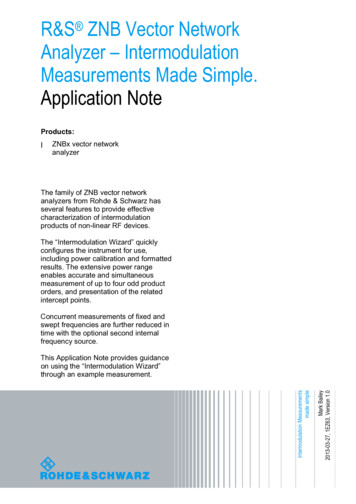
Front panelYou can use the USB interface to connect to computer communications orconnect standard 5V charger charging.When charging the battery indicates that the battery LED flashes in charge, theconstant light indicates full. When discharging the battery LED constant lightindicates normal discharge, LED flicker indicates low power, please connect thecharger in time to charge.Toggle the power switch can switch the machine, the battery indicates that theLed needs to be turned off after 40 seconds of shutdown.The system LED light and dark changes when the system is properly scanned. Youcan move the mark Point or perform a menu operation via the multifunctionalswitch, use the touchscreen operation directly also.Main interface
Basic operations:1. Set the frequency range (STIMULUS START/STOP or CENTER/SPAN)2. Calibration (CAL)3. Select display format and channel (DISPLAY)4. Save(SAVE)You can change the display format and channel selection at any time. In thenormal test mode, tap the right area of the screen or press the multifunctionalswitch to call up the menu. Tap the screen or turn the multifunctional switch toselect a menu item.The initial state of NanoVNA (no data is stored in 0)Scan range: 50KHz 900MHzTrack 1: LOGMAG CH0 (reflection)Track 2: SMITH CH0 (reflection)Track 3: LOGMAG CH1 (through )Track 4: CH1 stage (through )Mark 1: ActivatedUncalibrated.We will test before shipment and connect directly to the SMA port forcalibration, the calibration data is stored in state 0, and the boot will load thestatus 0 data directly.
Calibration and Normalization:The VNA Master is a field portable unit operating in the rigors of the testenvironment. In order to ensure measurement accuracy, RF calibration (OSLT)must be performed prior to making a measurement in the field. Calibrating withthe specified mechanical calibration requires three loads, open, short, andmatch(load). Calibration data is saved as user calibration data. It can be saved tostatus 0 and can be automatically loaded at the next boot, It can be also savedto status 1-4 and can be loaded via the RECALL menu.Click the CAL CALIBRATE menu to open the calibration interface, then connectopen, short and load three loads in turn, wait for the screen to stabilize and clickon the menu corresponding to calibrate CH 0. The machine is accompanied by acalibration piece, for the public head calibration parts inside the needle copper isshort-circuited, the interior with a needle white plastic and stainless steel shellconnected to the (LOAD) 50 ohm load, the internal empty for the open. For thehead calibrator, the back uses solder short circuit for short, welding two 100 ohmsresistor for 50 ohm load, open circuit for open.Isolation calibration of CH 1 requires two load loads to connect CH0 and CH1,respectively, to obtain the best isolation, usually with only one set of calibrationloads for port 0, and to connect the load Calibrator to CH1, CH0 to remain open,and then press the ISOLN menu to calibrate.Connect the CH0 and CH1 of the analyzer with an optional Through Adapter(SMAto SMA kit or cable), and then press the THRU menu to calibrate. Thenormalization operation moves the measurement reference plane to both endsof the Through Adapter. This function is only available when the measurementitem is S21.After the calibration is complete, press the Done button, eject the Save screen toselect the required status to save. Once the calibration is complete, the threecalibrators can be connected to port 0 again, and the correct calibration shouldbe based on the SMITH chart, which should be: when connected to OPEN, thecurves should be concentrated on the far right of the SMITH chart, and whenconnecting SHORT, the curves should be concentrated on the leftmost side of the
SMITH chart, When connecting LOAD, the curves should all be concentrated inthe middle of the SMITH chart. Using RF cables to connect Port 0 and port 1, viewS21 curve errors should not exceed 0.1dB. If calibration data abnormalities arefound, they should be re-calibrated.Note: If there is already saved calibration data, first press “Reset”to clear the calibration data and then calibrate!If the calibration has been applied, CAL status is displayed.It is hidden in a state that has not been applied. C * is the state in which theunsaved calibration value is applied (it disappears when the power is turned off).C0 C4 0 to 4 indicates that a saved calibration value has been applied to one ofthe save locations.SAVE UnsavedIt changes to this state when saving by an operation. Each of the characters shownbelow C indicates that the following error terms are applied:D: Directivity, R: Reflection Tracking, S: Source Match, T: Transmission Tracking, X:IsolationSelect the display trace and display format:The DISPLAY TRACE item of the menu can choose to turn the correspondingdisplay curve on or off, showing that the curve color is consistent with the colorof the interface curve, and the display curve of the final operation is the activetracking curve, when the menu FORMAT, the SCALE,CHANNEL operation is validfor the display curve.The display type can be modified by the DISPLAY FORMAT of the menu,DISPLAY SCALE can adjust the scale, DISPLAY CHANNEL can select themeasured port.Setting the frequency range:The frequency range of a channel can be expressed by three groups of parameters:Start Frequency, Center Frequency and Stop Frequency. If any of the parameterschange, the others will be adjusted automatically in order to ensure the couplingrelationship among themfcenter (fstart fstop )/2fspan fstop- fstartWhere fspan is the span.Set the center frequency point of the current screen through theSTIMULUS CENTER of the menu, and display the values of the center frequencyand sweep span, respectively, to the left and right of the bottom of the grid. Inthe lower-right corner of the pop-up Settings value screen, click to eject thesoft keyboard and enter the frequency value via the soft keyboard.
Please pay attention to the following points:The start and stop frequencies will vary with changes to the center frequencywhen the span is constant.In Zero Span, the start frequency, stop frequency and center frequency are alwaysset to the same value. Now, you can use port 0 as a signal source for a fixed outputamplitude, but it is important to note that this machine uses the clock signalgenerator S5351 as the signal source, the output signal is square wave, containsa larger odd harmonic.Set the frequency range through the STIMULUS SPAN of the menu, display thecenter frequency and sweep span values on the left and right sides of the grid,and click on the lower right corner of the pop-up settings value screen to ejectthe soft keyboard and enter the frequency values through the soft keyboard.Please pay attention to the following points:The start and stop frequency vary with the span when the center frequency isconstant.When the span is set to the maximum, the analyzer enters full span mode.In Zero Span, the start frequency, stop frequency and center frequency are alwaysset to the same value.Set the start frequency through the STIMULUS START of the menu and displaythe start frequency and stop frequency values on the left and right sides of thegrid, respectively. Click on the bottom right corner of the pop-up settings screento eject the soft keyboard and enter the frequency value through the softkeyboard.Please pay attention to the following points:The span and center frequency vary with the start frequency when the Spandoes not reach the minimum (The parameters vary with the span, please refer to“Span”);In Zero Span, the start frequency, stop frequency and center frequency arealways the same value.Set the stop frequency through the STIMULUS STOP of the menu, and displaythe start frequency and stop frequency values on the left and right sides of thegrid, respectively, in the lower right corner of the pop-up Settings screen, clickto eject the soft keyboard and enter the frequency value through the softkeyboard. Please pay attention to the following points:The span and center frequency vary with the stop frequency. The change of thespan will affect other system parameters. For more details, please refer to“Span”.In Zero Span, the start frequency, stop frequency and center frequency are alwaysthe same value.
Menu items:DISPLAY TRACE 0 1 2 3 FORMAT LOGMAG PHASEDELAY (Not implemented, computer software provides Group delay functionality) SMITH SWR MORE POLAR LINEAR SCALE SCALE/DIV REFERENCE POSITIONELECTRICAL DELAY CHANNEL CH0 REFLECT CH1 THROUGH MARKER SELECT 1 2 3 4 MARKER START MARKER STOP MARKER CENTER MARKER SPAN (Not implemented,) STIMULUS STAR STOP CENTER
SPAN CW FREQ CAL CALIBRATE OPEN SHORT LOAD ISOLN THRU DONE SAVE RESET CORRECTION RECALL/SAVE 0 (Default) 1 2 3 4 CLOSEBasic performance: PCB: 54mm x 85.5mm x 11mm (without connectors, switches) Measurement frequency: 50KHz -900MHz RF output: -13dbm (maximum -9dbm) Measurement range: 70dB (50kHz-300MHz), 50dB (300M-600MHz), 40dB(600M-900MHz)); Port SWR: 1.1 Display: 2.8 inch TFT (320 x240) USB interface: USB type-C communication mode: CDC (serial) Power: USB 5V 120mA, built-in 400mAh battery, maximum charging current0.8A Number of scanning points: 101 (fixed) Display Tracking: 4, Marking: 4, Setting Save: 5 Frequency Tolerance: 2.5ppm Frequency Stability: 0.5ppm
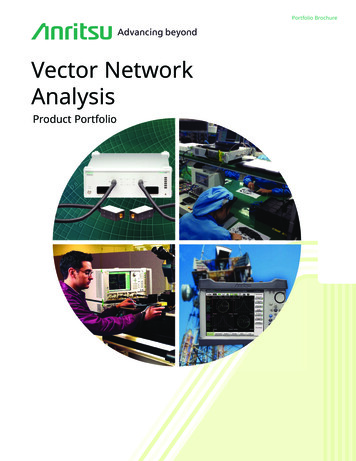
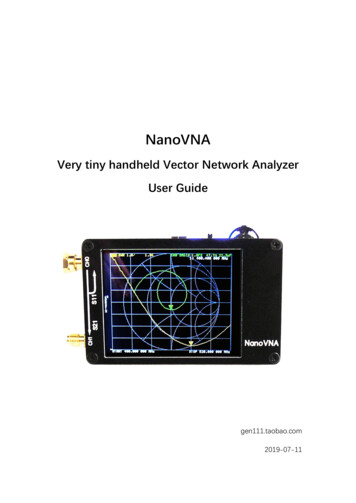
Packing listNanoVNA host (with 400mAh battery) x 1USB Type-C data cable x130cm SMA male to male RG174 RF cable x2SMA male calibration kit (OPEN / SHORT /LOAD) x1SMA female to female connector x1Block diagram:
NanoVNA Sharp:This PC software is designed for control NanoVNA and export Touchstone(snp) files.
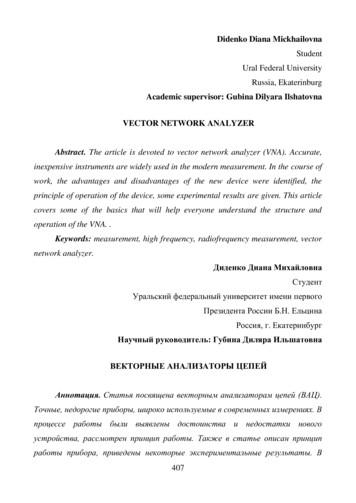
123U2IP5303C4610uFAGND 1L1R21KR402ΩVDDC5 C6 C7 C8100nF100nF100nF100nF2.54mm 1*2P2BAT1VBUS B4A9R510KΩU3XC6206P332MRVout 2 5V51VBUS A4B92SK-12D02-VG3SW1TC1C31uFUSB DMUSB DPC41uFGND 1BDAC FCX Y VDD3 Vin24364892335478SW2K1-1502SA2LED1KT-0603RGND B1A1267TMSTCKLCD T6VDD1VBAT 1VDD2R3 1KVDD3PC13 23PC14VDDAPC15 4 MCLKVSS1OSC I 5VSS2OSC O 6 NRSTVSS3NRST 7VSSABoot0 13PB14PB15181920394041424345462122252627288U10TFT 2.8 SPI 6A8B5GND A1B12VOUTSWBATKEYEPAD5C4910uFC4722uF2 GNDUSB DMUSB DPSBU2CC1DN2DP1GND 3B8A5B7A64 GNDUSB -0603RP1RE-H022TD-1190 (LF)(SN)R610KΩXYSD GP1SPI SCLKSPI MISOSPI MOSILCD CSLCD CD1122VDDVDDGNDLCD RESETSPI SCLKLCD CDLCD CSSPI MOSISPI ND5VDDX Y XY-R7R83.9KΩ 3.9KΩSD GP2SD CSI2S WCLKI2S )GND2VCCLEDGND3GND4GND5GND6XPYNXNYPSCLSDABVDDI2S C1AFC/GND2GND4VCC3OUTU5Si5351A-B-GTC11 100nFCLK0 10C12 100nFCLK1 9 MCLKCLK2 62 XA3 XBSCLSDA4 SCL5 SDAR26300ΩR27300ΩVDD1 VDD7 VDDO24 AVDD29 DVDD6 OVIDDR28300ΩGND 8C9 C10100nF100nFC34 C35 C36100nF100nF100nFR13150ΩC40 100pF L34.7uHR1727Ω2 IN-BC14 100nFC42 100pF L44.7uHC15 100nFR19390ΩC16 100nFU7SA612AD1 IN-AOSC2 IN-B1822232725195 I2S DOUT11812131415162021R2049.9Ω15KΩC22 100nFOUT-B 5R3315KΩC23 100nFR3810KΩC281nFR30300ΩC291nFC38100nFOUT-A 4R3415KΩC24 100nFOUT-B 5R3515KΩC25 100nFR2149.9ΩD30 LDO/SELECT31 RESET32 GPIOMFP5/3233 EP7 IOVSS17 AVSS28 DVSSR24100Ω R2339ΩC17 100nFR2522Ω1 IN-AC311nFOSC2 IN-BC18 100nF876R2239ΩOUT-A 4R3615KΩC26 100nFOUT-B 5R3715KΩC27 100nF 5VC43 100nFL5C44 100pFC321nFC331nFTITLE:2019-05-24EASYEDA V5.4.12234REV: 3.0nanoVNA4.7uHDate:1S10ICSRC6508 屏蔽支架1 1S4ICSRC6508 屏蔽支架1 1S3ICSRC6508 屏蔽支架1 1S2ICSRC6508 屏蔽支架1 1S1ICSRC6508 屏蔽支架1 1S9ICSRC6508 屏蔽支架11S8ICSRC6508 屏蔽支架11S7ICSRC6508 屏蔽支架1 1S6ICSRC6508 屏蔽支架1 1S5ICSRC6508 屏蔽支架11U8SA612AD3RXSMA-KC301nFR31300ΩC21 3/R3ER32C20 100nF6R18390ΩOUT-A 4 5VC41 100nFR1249.9ΩOSC8R982Ω1 IN-A76C13 BIASDOUTMFP2MISOMFP4I2S DIN 4SCL 9 DINMFP1SDA 10 SCLSSZSDAMOSIR29300ΩC19 100nFD1 MCLK/12 BCLK3 WCLK8 SCLKMFP326 LDOINU6SA612ADR16470ΩR1456ΩMCLKI2S BCLKI2S WCLK 5VC39 100nFCU9TLV320AIC3204IRHBR567Sheet: 1/1Drawn By: hugen798E
tiny handheld Vector Network Analyzer (VNA). It is standalone with lcd display, portable device with battery. This project aim to provide an RF gadget but useful instrument for enthusiast. DIY's vector network analyzer, with reference to the related design of. Designed with simple and practical PC control software, you can export Touchstone (snp)