Transcription
R&S ZNB Vector NetworkAnalyzer – IntermodulationMeasurements Made Simple.Application NoteProducts: ZNBx vector networkanalyzerThe family of ZNB vector networkanalyzers from Rohde & Schwarz hasseveral features to provide effectivecharacterization of intermodulationproducts of non-linear RF devices.The “Intermodulation Wizard” quicklyconfigures the instrument for use,including power calibration and formattedresults. The extensive power rangeenables accurate and simultaneousmeasurement of up to four odd productorders, and presentation of the relatedintercept points.Concurrent measurements of fixed andswept frequencies are further reduced intime with the optional second internalfrequency source.Mark Bailey2013-03-27, 1EZ63, Version 1.0Intermodulation Measurementsmade simpleThis Application Note provides guidanceon using the “Intermodulation Wizard”through an example measurement.
Table of ContentsTable of Contents1EZ v1.01Introduction . 32Test Equipment - Configurations. 32.1R&S ZNB Vector Network Analyzer .42.2Support Test Equipment.52.2.1Rohde & Schwarz Power Meter.52.2.2Power Combiner .62.3Device Under Test (DUT) .73Preparing for an Intermodulation Measurement . 73.1Presetting the R&S ZNB Vector Network Analyzer .73.2Defining the Measurement Requirements .83.3R&S ZNB “Intermodulation Wizard” .93.3.1Defining the Ports and Intermodulation Products .93.3.2Frequencies and Powers .103.3.3Measurement Parameters.123.3.4Completing the Intermodulation Wizard .133.4Intermodulation Power Flatness Calibration.143.4.1Power Meter Settings .164Making an Intermodulation Measurement. 174.1Swept Frequency Measurement .174.1.1Trace Label Descriptions.184.1.2Editing Measurement Traces .194.2Continuous Wave (CW) Measurement .205Editing the Intermodulation Measurement Configuration. 226Bibliography . 237Additional Information. 23 Rohde & Schwarz Intermodulation Measurements Made Simple 2
IntroductionR&S ZNB Vector Network Analyzer1 IntroductionMeasuring intermodulation products (IMP) of a non-linear RF device typically involvesthree pieces of test equipment, and time to connect and calibrate multiple cable pathlosses. Once the equipment is configured, the measurement is straightforward for asimple fixed frequency two tone measurement. However, preparing for a sweptfrequency response is more complex, requiring synchronization of frequency sources. The R&S ZNB vector network analyzer (VNA) is a versatile self-contained instrumentable to measure intermodulation products accurately and effortlessly provides thefollowing benefits: ‘Intermodulation Wizard’ tool to efficiently configure the instrument.Faster measurements with an internal second source.Generous linear source output power.Excellent receiver sensitivity for detecting low level higher order products.Excellent receiver linearity (Absolute max input, 27 dBm).Simultaneous measurement of fixed and swept frequencies.Straightforward power calibration.Formatted results.rdthththDisplay of calculated odd order intercept points (3 , 5 , 7 and 9 ).In this application note, step-wise instructions are presented on how to set up the R&S ZNB VNA, leading to the successful measurement of intermodulation products.This compliments the information given in the R&S ZNB, Vector Network Analyzers,[1]User Manual, and the on-instrument “HELP”.It is assumed that the reader is familiar with the theory and limitations caused by thegeneration of intermodulation products in non-linear RF devices. Detailed information is given in chapter 2 of R&S Application Note, Intermodulation Distortion[2]Measurements on Modern Spectrum Analyzers, (1EF79), available on the Rohde &Schwarz website.2 Test Equipment - ConfigurationsThe measurement of intermodulation products involves the application of two RFsources of equal power and close in frequency, that are combined into a single pathapplied to a device under test (DUT). The RF output spectrum from the DUT isanalyzed for the presence of spurious frequencies caused by the non-linear behaviourof the DUT. The source input power levels may need to be varied to observe theintermodulation products. Once measured, this information is used to calculate theintermodulation product intercept point, either referred to the DUT input or output.1EZ v1.0Rohde & Schwarz Intermodulation Measurements Made Simple 3
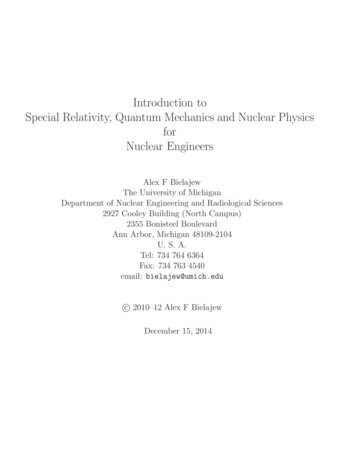
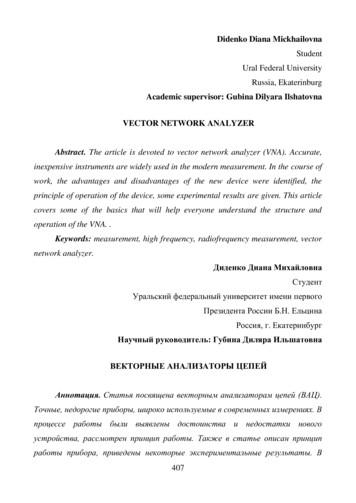
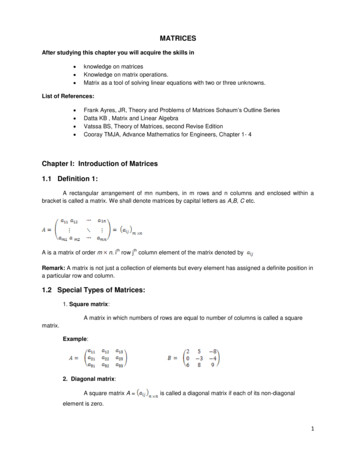
Test Equipment - ConfigurationsR&S ZNB Vector Network Analyzer2.1 R&S ZNB Vector Network Analyzer The R&S ZNB VNA fitted with options R&S ZNB-K14 (Intermodulation Measurements) and R&S ZNB-K4 (Frequency Converting Measurements), istransformed into an effective test facility for measuring intermodulation products. Using the built in “Intermodulation Wizard” the R&S ZNB VNA is quickly and accuratelyconfigured, calibrated and set up to display results for the required parameters. The two and four port R&S ZNB network analyzers both support intermodulationmeasurements and require an external power combiner. The two port analyzerrequires an additional external signal generator. Figure 1 - Intermodulation testing with a 2-port R&S ZNB network analyzer,external signal generator and combiner.Figure 1 shows the configuration with a 2-port analyzer with the lower tone signalsourced from Port 1 and the upper tone sourced from an external generator. Bothsignals are combined externally and applied to the input of the DUT. Theintermodulation quantities produced at the DUT output are analyzed at Port 2. The function of Ports 1 and 2 can be interchanged. The R&S ZNB VNA can control theexternal signal generator using a USB, LAN or GPIB interface. Use of GPIB does require option R&S ZVAB-B44 (USB-to-IEC/IEEE Adapter). Faster measurements are achieved with a four port R&S ZNB VNA equipped with an internal second source, option R&S ZNB-B2 (Internal second generator). The versatilearchitecture allows any combination of analyzer ports that are supplied by differentinternal sources to generate the lower and upper tones. Figure 2 provides an examplewhere Port 3 produces the upper tone.1EZ v1.0Rohde & Schwarz Intermodulation Measurements Made Simple 4
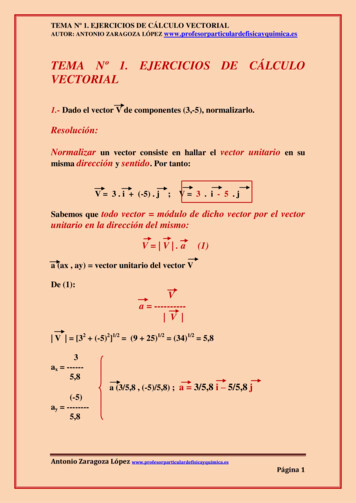
Test Equipment - ConfigurationsSupport Test EquipmentFigure 2 - Intermodulation testing using a 4-port R&S ZNB network analyzer withtwo internal sources and an external combiner. This application note is based on the R&S 4-port ZNB 8 (9 kHz 8.5 GHz) vector network analyzer, fitted with option R&S ZNB-B2 (Internal second generator), andexecuting firmware version 1.70.2.2 Support Test Equipment2.2.1 Rohde & Schwarz Power MeterFor accurate measurement of intermodulation products and prediction of associatedintercept points it is necessary to calibrate the following power levels: the two tones at the DUT input. power at the receiver port input. Calibration of the power levels is effortless with a R&S NRP-Zxx power sensor connected to and controlled by the R&S ZNB analyzer. The example given in this application note uses an R&S NRP-Z31 power sensor (10 MHz - 33 GHz) connected directly to the analyzer USB ports using an R&SNRP-Z4 adapter cable. When the R&S power sensor is first connected, an onscreen message may appear asshown in Figure 3, stating “Frequency out of range”.Figure 3 - Warning message after connecting NRP-Zxx power sensorSelecting “Port Settings ” opens a window, as shown in Figure 4.1EZ v1.0Rohde & Schwarz Intermodulation Measurements Made Simple 5
Test Equipment - ConfigurationsSupport Test EquipmentFigure 4 - Port Settings for Channel 1 In this example, the power meter has been correctly identified as being an R&S NRPZ31, and has a minimum frequency response greater than the minimum frequency response of the R&S ZNB. Therefore, the user must ensure that the test configurationis within the operating limits of the instruments.2.2.2 Power CombinerMeasurement of intermodulation products requires two test tones to be combined intoa single RF path using a passive power combiner.The choice of combiner should take into account: FrequencybandwidthThe operating bandwidth of the combiner must beconsiderably greater than the spectrum of theintermodulation products. CouplingfactorThis should be kept to a minimum to reduce insertion lossthrough the combiner. IsolationThe combiner must provide sufficient isolation between thetwo sources ( 6 dB).In the following example, a resistive power combiner from Mini-Circuits (ZFRSC[4]183 ) is used, giving typically 6.5 dB of coupling loss and isolation, from DC to 18GHz.1EZ v1.0Rohde & Schwarz Intermodulation Measurements Made Simple 6
Preparing for an Intermodulation MeasurementDevice Under Test (DUT)2.3 Device Under Test (DUT)The RF amplifier example used in this application note is from Mini-Circuits (ZJL[3]3G ). This has the following typical characteristics: Frequency range: 20 MHz 3 GHz Gain: 19 dB Output 1 dB compression point: 8 dBm Output 3 order intercept point: 22 dBmrd3 Preparing for an IntermodulationMeasurement3.1 Presetting the R&S ZNB Vector Network Analyzer Presetting the R&S ZNB network analyzer to its factory default settings will avoid theunexpected effects of any legacy settings. Refer to the R&S ZNB, Vector NetworkAnalyzers, User Manual, or press the “HELP” button on the instrument front panelkeypad for more information on preset conditions. Selection of any function on the R&S ZNB VNA is designed to be simple and ispossible in at least two ways. Using “Preset” as an example:1. Front panel keypad: “SYSTEM” key group “PRESET”.2. Software menu structure: “SYSTEM Preset”.3. Software based hard key panel: “PRESET”.The hard key panel is hidden by default, but is useful when operating the instrumentremotely. The hard key panel can be displayed using “DISPLAY View Bar HardKey Panel”, as shown in Figure 5.1EZ v1.0Rohde & Schwarz Intermodulation Measurements Made Simple 7
Preparing for an Intermodulation MeasurementDefining the Measurement RequirementsFigure 5 - Making the "Hard Key" panel visible and two methods of instrument"Preset".3.2 Defining the Measurement Requirements Before configuring the R&S ZNB network analyzer for making measurements,consideration must be given to the DUT. Using the Mini-Circuits ZJL-3G low poweramplifier as an example, there are three minimum considerations: 1. Measurement frequency bandwidth: The R&S ZNB is able tosynchronously sweep the two tones across a defined frequency range. Thereceiver input will contain the two primary tones and the broader spectrumcontaining the intermodulation products. Therefore, the bandwidth of thereceiver needs to be set to capture the lowest and highest intermodulationproducts.2. DUT input power: The DUT input power characteristic must be known toavoid over-driving or permanently damaging the device. For example, a reviewof the amplifier parameters given in section 2.3, states that the 1 dBcompression point referred to the input is about -10 dBm. So, to ensure thatthe amplifier is measured out of saturation, an input power of -20 dBm will beused.3. DUT output power: When measuring a high power amplifier, it is veryimportant to know the level of the device output power. The maximum ratedRF power of each receiver port is 27 dBm. To avoid permanent damage tothe analyzer, the DUT output power must be significantly below this limitthrough either using attenuation at the DUT output, and/or by reducing theDUT input power. This is not an issue of concern for the low power amplifiercharacterized in this Application Note. The R&S ZNB VNA is ready to be configured once these considerations are fulfilled.1EZ v1.0Rohde & Schwarz Intermodulation Measurements Made Simple 8
Preparing for an Intermodulation MeasurementR&S ZNB “Intermodulation Wizard”3.3 R&S ZNB “Intermodulation Wizard” The R&S ZNB network analyzer “Intermodulation Wizard” is a straightforward tool toconfigure the instrument and access is through the menu “Channel Config Intermodulation Intermodulation Wizard”, giving the window shown in Figure 6.Figure 6 - Intermodulation Wizard, default screenIn this example, the intermodulation measurement will be made on channel 1.Additional information and support is always available on the test instrument,accessible using the “Help” soft key, or “HELP” front panel key. It is also possible toexit the wizard at any stage using the “Cancel” soft key.3.3.1 Defining the Ports and Intermodulation ProductsFigure 6 shows the measurement hardware configuration. Quantities relating to the twosignal sources are on the left, and those relating to the receiver are on the right. The upper part of the window shows three RF ports of the R&S ZNB analyzer and howthese are connected to the external power combiner and DUT, identified in the greybox.“Lower Tone”, “Upper Tone” and “Receiving Port” functions require ports to beallocated. The default setting is shown in Figure 6. A new port selection is made usingthe touchscreen interface or a computer mouse to activate the Port window, producinga drop down menu listing available ports. For the Lower Tone, only ports associated with the R&S ZNB internal generator(s) are listed. For the Upper Tone, external signal generators connected to and for control by the R&S ZNB analyzer are alsolisted.1EZ v1.0Rohde & Schwarz Intermodulation Measurements Made Simple 9
Preparing for an Intermodulation MeasurementR&S ZNB “Intermodulation Wizard”Selection of unsupported port combinations will result in anerror message which automatically clears when the testconditions are corrected.“Src. for Rcvr. Cal” selects the signal source used forcalibrating the power level at the receiver port. Figure 7 showsthe available power sources from the drop down menu. Bydefault, the output from the combiner and Port 4 of theanalyzer are offered as power sources. Figure 7 also shows a R&S SGS 100A signal generator connected to the analyzer,“Gen 1”. For this example “Combiner Out” is used.Figure 7 – Receivercalibration: Powersource optionsThe bottom part of Figure 6 configures the source and receiver parameters. Values areinput for source Power, Tone Distance and the receiver filter MeasurementBandwidth. The Measurement Bandwidth and Tone Distance values need to bechosen with care. The Tone Distance should be greater than 100x the MeasurementBandwidth, so that each frequency component is selected by the filter withoutinterference. The analyzer will present an information window if this condition is notfulfilled.“Prepare Measurement of IM Order” allows the intermodulation product orders ofinterest to be selected by placing a ‘tick’ in the appropriate boxes. This information allows the R&S ZNB VNA to optimize its configuration, avoiding measurement ofunnecessary data. Hence the wanted measurements are collected more quickly. “Step Attenuator“ refers to analyzers fitted with option R&S ZNB-B3x (Receiver StepAttenuator) to allow measurement of higher input power levels.“Selectivity” of the IF filter can be changed and by default is set to “High”, to maximizerejection of adjacent spurious frequency components.Example (Amplifier ZJL-3G ): All parameters are default except: Source Power level -20 dBmAll intermodulation orders are selected.Once configured, press “Next”. It is possible to come back to this window and changethese parameters at any time.3.3.2 Frequencies and PowersStage two of the Intermodulation Wizard defines the start and stop frequencies, andoutput power of the sources. If the start and stop frequencies exceed the hardwarecapabilities of the instrument, then a warning message will appear and the frequencyrange text will be highlighted in red for the port(s) attempting to operate beyondhardware limits, as shown in Figure 8.1EZ v1.0Rohde & Schwarz Intermodulation Measurements Made Simple 10
Preparing for an Intermodulation MeasurementR&S ZNB “Intermodulation Wizard”Figure 8 - Frequency range: Defining and viewing exceeded limitsThe “Start Frequency” and “Stop Frequency” values are referenced to the portsourcing the lower tone. This port is used to set the frequency ranges for the otherports. In this example, Port 1 sources the lower tone and Port 3 the upper tone, offsetby 1 MHz. Therefore the hardware upper limit of Port 3 is exceeded by 1 MHz,requiring that the “Stop Frequency” of Port 1 must be reduced by at least 1 MHz.For the receiver (Port 2), Figure 8 shows that the hardware limits for the lower andupper frequency ranges are exceeded. When the two source tones are set to thethminimum frequency, the calculated lower 9 order intermodulation product is below themeasured frequency range. Similarly, when the tones are set to the maximumthfrequency limit, the higher 9 order intermodulation product is above the measuredfrequency range.Therefore the measurement frequency range must be configured so that all of the VNAports and the power meter are within their operating frequency ranges. For theanalyzer only, this can be done automatically using the “Fit Frequency Range” softkey. When using this method, take care to ensure that the power meter frequencyrange matches or exceeds the required test measurement frequency range.Example (Amplifier ZJL-3G ): The lower tone frequency range andpower level are set as follows, and implemented as shown in Figure 9: Start frequency 15 MHzStop frequency 3.5 GHzPower -20 dBmThe 10 MHz low frequency limit of the R&S NRP31 power sensor defines the StartthFrequency. At 15 MHz the lowest 9 order product is safely measured at 11 MHz. TheStop Frequency is 3.5 GHz, since the amplifier is not specified beyond 3 GHz.1EZ v1.0Rohde & Schwarz Intermodulation Measurements Made Simple 11
Preparing for an Intermodulation MeasurementR&S ZNB “Intermodulation Wizard”Figure 9 – Setting the reference frequency range and power levelOnce configured, press “Next”. It is possible to come back to this window and changethese parameters at any time. Or go “Back” to the previous step if necessary.3.3.3 Measurement ParametersThe measured parameters that will be displayed need to be chosen. The selecteditems will each have a trace and will be shown together on one display. The availablemeasurement parameters are shown in Figure 10 and are selected by placing a tick inthe adjacent box: The available parameters are: Output intermodulation productsCalculated intercept pointsInput tone levelsOutput tone levelsIf parameters are greyed out, then the associated intermodulation product order wasnot selected in step 1 of the Intermodulation Wizard, “Define Intermodulation” (seeFigure 6). It is possible to change the selected order using the “Back” button to returnto step 1 of the wizard.1EZ v1.0Rohde & Schwarz Intermodulation Measurements Made Simple 12
Preparing for an Intermodulation MeasurementR&S ZNB “Intermodulation Wizard”Figure 10 – Selection of available measurement parametersIntermodulation Products – These are all referenced to the DUT output and for eachorder of intermodulation product, any of the following can be shown: Low side intermodulation productHigh side intermodulation product“Major Prod.” – Derived from the greater of the upper and lower products ateach measured frequency point.Intercept Point - Calculated from the “Major Prod.” result for each order.Tone Power Level – Measurement of the input and output levels of the two tones areselected at the bottom of the window.Example (Amplifier ZJL-3G ): Figure 10 shows that the followingparameters have been selected for measurement. rd3 order intermodulation lower and upper productsrd3 order intercept pointLower and upper tone levels at the DUT inputLower and upper tone levels at the DUT outputOnce configured, press “Next”. It is possible to come back to this window and changethese parameters at any time. Or go “Back” to the previous step if necessary.3.3.4 Completing the Intermodulation WizardWith the measurement defined and results parameters selected, the final step in thewizard is shown in Figure 11. This provides two options, either to perform a power levelcalibration, or to finish without a calibration.1EZ v1.0Rohde & Schwarz Intermodulation Measurements Made Simple 13
Preparing for an Intermodulation MeasurementIntermodulation Power Flatness CalibrationFigure 11 – Completing the Intermodulation WizardThis is a good opportunity to review the measurement configuration. If changes areneeded, use the “Back” soft key to reverse through the set up menus.Select the calibration requirement and press “Finish” to complete the Intermodulation Wizard. Regardless of the calibration state, the R&S ZNB VNA will close the Wizardand open a display with the frequency response of the parameters that were selectedin step 3 of the Intermodulation Wizard, “Measurement Parameters”.3.4 Intermodulation Power Flatness Calibration Coupling a R&S NRP-Zxx power sensor to the R&S ZNB VNA, allows the use of aninbuilt calibration tool, “Intermodulation Power Calibration”. This ensures that thesource power levels at the input of the DUT and the measurement of theintermodulation products at the Receiving Port are accurate across the frequencyrange.There are two ways of starting the power flatness calibration tool, either at the end ofthe Intermodulation Wizard, or if in the measurement mode, through the menu:“Channel Channel Config Intermodulation Start Power Cal /Intermod.Pwr. Cal ”.1EZ v1.0Rohde & Schwarz Intermodulation Measurements Made Simple 14
Preparing for an Intermodulation MeasurementIntermodulation Power Flatness CalibrationFigure 12 – Power calibration windowFigure 12 shows the power calibration window, with the sources on the left and thereceiver port on the right. The calibration is performed in three steps:1. With the power meter connected to the calibration plane (normally thecombiner output), press “Start Cal Sweep”, and the power response of theLower Tone will be characterized over frequency. The Upper Tone is off.2. Once the Lower Tone is completed, characterization of the Upper Toneproceeds automatically.3. With the two sources calibrated, the port allocated to the Lower Tone is thenautomatically configured to provide a reference tone at the receiver frequencyrange for calibration of the Receiving Port, as shown in Figure 13. The user isprompted to connect the combiner output to the Receiving Port and thenpress “Start Cal Sweep”.Figure 13 - Power calibration of the receiving port using the lower toneIn the first window of the Intermodulation Wizard(Figure 6), the user selects the source forcalibrating the power flatness of the ReceivingPort. If a free analyzer port or a signal generatoris selected, this will be presented in the calibrationwindow as shown in Figure 14. This introduces anextra step to the power flatness calibration,necessitating connection of the power meter tothe source for calibration, before connecting thesource to the Receiving Port.It is possible to step back and forth through thesteps of the power flatness calibration using the“Prev” and “Next” soft keys.1EZ v1.0Figure 14 – Receiver portcalibration with (left) signalgenerator, (right) analyzer port 4Rohde & Schwarz Intermodulation Measurements Made Simple 15
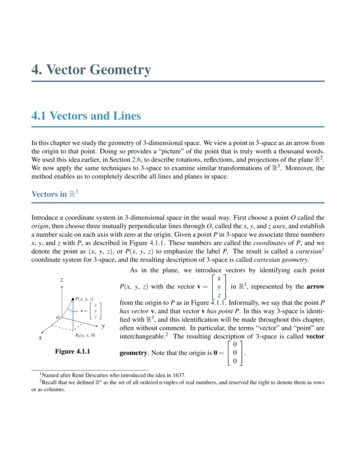
Preparing for an Intermodulation MeasurementIntermodulation Power Flatness CalibrationOnce calibration is complete, the “Next” soft key is replaced by an “Apply” soft key,which will apply the calibration.3.4.1 Power Meter SettingsWhen starting the intermodulation power flatness calibration, inaddition to presenting the calibration tool (Figure 12), the “PwrCal Settings” menu is automatically displayed (Figure 15). Thismenu allows connected power meters to be configured. For thepower flatness calibration, there are three variables:1. Max Iterations – An upper limit to the number of times thatthe flatness calibration is performed, if performance within thetolerance limit has not been achieved.2. Tolerance – Defines a window of accepted performance,centered on a target value. This is used during calibration andwhen successfully completed, performance is checked to bewithin tolerance limits.3. Convergence – During the power flatness calibration, theamount of power correction for each sweep is multiplied by theconvergence factor. The power correction is calculated fromthe difference in measured power level at the power meter tothat at the analyzer port reference receiver. The convergencefactor is generally left set to unity.Figure 15 - PowerSensor settingsFigure 16 presents results with the Receiving Port connected directly to the combiner output after calibration. These responses are a measure of the R&S ZNB VNAintermodulation performance. The power level has been adjusted to 0 dBm so that theinstrument intermodulation products are above the measured noise floor. Therefore the rdR&S ZNB VNA has a calculated 3 order intercept point greater than 30 dBm.Figure 16 - Example of default screen after calibration1EZ v1.0Rohde & Schwarz Intermodulation Measurements Made Simple 16
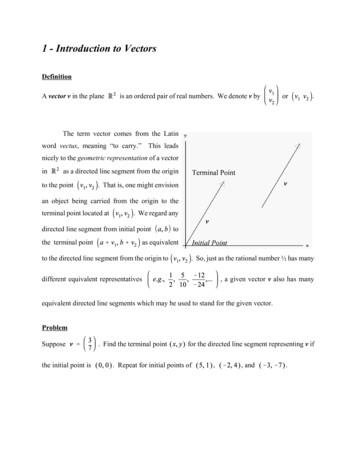
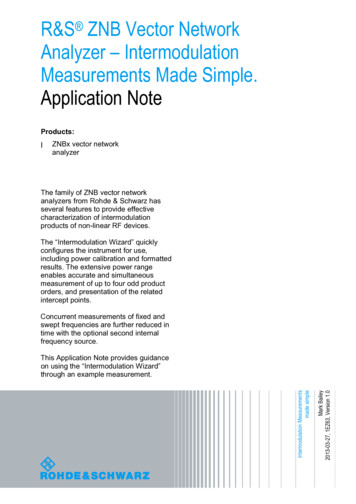
Making an Intermodulation MeasurementSwept Frequency Measurement4 Making an Intermodulation Measurement4.1 Swept Frequency MeasurementFollowing a successful calibration, the amplifier is inserted between the combineroutput and the Receiving Port. Figure 17 shows the frequency response of the inputrdtones; the output tones; the output 3 order intermodulation products; and therdcalculated output 3 order intercept point.Figure 17 - 3rd order intermodulation characteristic of Mini-Circuits ZJL-3G .Input and output tone levels; intermodulation products and intercept point.Example (Amplifier ZJL-3G ): Using the marker information in Figure17, the performance of the amplifier at 2 GHz is summarized as: Gain 18.3 dBrdOutput 3 order intermodulation products (2 GHz) -49 dBmrdOutput 3 order intercept point (2 GHz) 21.5 dBmrdFor the gain and 3 order intercept point, this aligns with the data sheetinformation (see 2.3 Device Under Test (DUT)).NOTE: The ripple on the traces is due to the effects of impedance mismatch betweenthe combiner, DUT and analyzer ports. Use of attenuators reduces the effects ofmismatch at these transitions. Care must be taken not to saturate the analyzer sources( 12 dBm) when compensating for any additional attenuating losses before the DUTinput. Figure 18 and Figure 19 provide an example of the use of attenuators and theimprovement in performance, when compared with Figure 17 without attenuators. Inthis example, 10 dB attenuators have been placed between the sources and thecombiner to provide increased isolation between the sources. The Mini-Circuitscombiner common port has a typical return loss of 35 dB at these frequencies,therefore providing a good input match to the DUT.1EZ v1.0Rohde & Schwarz Intermodulation Measurements Made Simple 17
Making an Intermodulation MeasurementSwept Frequency MeasurementOther results in this application note are measured without any attenuators.Figure 18 – Use of attenuators to reduce impedance mismatch at test interfacesFigure 19 - 3rd order intermodulation characteristic of Mini-Circuits ZJL-3G withattenuators inserted as shown in Figure 18.4.1.1 Trace Label DescriptionsTo help the User, the Intermodulation Wizard labels the result traces with suitableacronyms. Examples are given in Table 1, and most are P5MOIP7MINLOParameter descriptionLow side intermodulation productUpper side intermodulation productMajor intermodulation productLower toneUpper ToneMajor intermodulation product relative toinput toneIntercept Point – based on largest IMPIntercept Point – based on largest IMPNoise measured at:fnoise flower tone - (fupper tone - flower tone) / putdBmOrder357UnitTable 1 - Examples of trace labels1EZ v1.0Rohde & Schwarz Intermodulation Measurements Made Simple 18
Making an Intermodulation MeasurementSwept Frequency Measurement4.1.2 Editing Measurement TracesIn step 1 of the Intermodulation Wizard, the intermodulationorders for measurement are chosen. Choosing only thewanted product orders gives a faster measurement.rdthththIn this example, 3 , 5 , 7 and 9 orders were selected, but are not all shown in Figure 17. However, the R&S ZNB VNAstill makes the measurements for all of the selectedintermodulation products. To view the other results, eithercreate another trace or highlight an existing trace for changeby using the touchscreen interface. The other intermodulationorders are accessed by entering the “Meas Intermod”menu structure. Figure 20 shows this self-explanatory menu,rdwhich allows single
3.1 Presetting the R&S ZNB Vector Network Analyzer Presetting the R&S ZNB network analyzer to its factory default settings will avoid the unexpected effects of any legacy settings. Refer to the R&S ZNB, Vector Network Analyzers, User Manual, or press the " HELP " button on the instrument front panel keypad for more information on .