Transcription
Performance Attribution ReportIntrepid Small CapIntroductionThe Intrepid Small Cap Fund, managed by Eric Cinnamond of Intrepid Capital Funds, has garnered noteworthy media attention in 2009. Bloomberg Online's June 3,2009 article featured Cinnamond's fund as the only diversified stock manager to outperform Bill Gross' venerable Pimco Total Return Bond fund over the trailing 3-yearperiod (through 5/26/09). Wall Street Journal's October 5, 2009 article puts this fund in second place in the Winners' Circle contest for the 12-months throughSeptember 2009 (posting a return of 29%). What explains Intrepid Small Cap’s outperformance? MPI takes a closer look using daily data and returns-based styleanalysis (RBSA), and finds Mr. Cinnamond’s selection skills over the past nineteen months have been strikingly strong relative to other small capitalization mutualfunds.In this post we illustrate a step-by-step performance attribution approach using returns-based style analysis, daily data, and holdings information. High frequency dailydata enables practitioners to detect style changes with greater speed and accuracy. Daily data also provides a better performance attribution especially for a fund withshort history and high turnover. The attached report contains more detailed descriptions along with supporting charts and tables generated by an mpi Stylus Properformance attribution template (note that this template is available for client use; please contact Support at support@markovprocesses.com for more information).The report demonstrates how a performance attribution narrative can be crafted in a straightforward, efficient, and compelling way.BackgroundMr. Cinnamond is a devout bottom-up stock picker who is openly resistant to efficient market and asset allocation theories and practices. Although Intrepid Small Capis categorized as a small cap value manager, Mr. Cinnamond's strict focus on small capitalization companies' operating fundamentals can be described as beingsomewhat style-agnostic. He focuses on businesses with strong free cash flow, asset and transaction valuations, respectively. According to the Wall Street Journal'sonline “Ask a Fund Manager” series in April 2009, Mr. Cinnamond typically has a potential buy list of roughly 300 small cap companies. As of June 30, 2009, the Fundheld roughly 60 of those names with annual turnover on the high side of approximately 160%.'Created with mpi Stylus
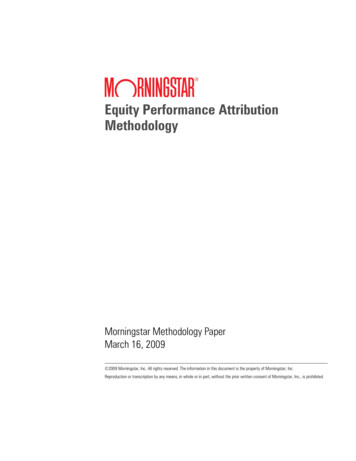
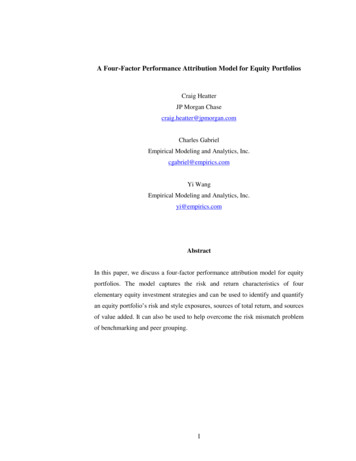
Performance Attribution ReportIntrepid Small CapStep 1 - Factor Exposures &CompositionCreated with mpi StylusApr-08Jun-08Weight, %UtilitiesFinancialsCons. Disc.EnergySep-08Dec-08Mar-09Telecomm SvcsHealth CareIndustrialsCashAsset 50Jun-09Sep-09ITCons. StaplesMaterialsR-SquaredUtilitiesTelecomm SvcsITFinancialsHealth CareCons. StaplesCons. Disc.IndustrialsMaterialsEnergyCashIntrepid:Small CapRussell 2000 Index10094.5892.799084.808070R-Squared, %High-frequency RBSA analysisdetects a fairly large structuralreallocation in the portfolio beginningin mid-2008. Note the decline in cashand utilities, and sizeable shifts intoenergy, healthcare and consumerdiscretionary. In February 2009, theshift was away from consumerdiscretionary and healthcare and intoutilities and energy. SEC filings andassociated holdings informationsupport the overall directional shiftsbut there are differences in terms ofmagnitude. RBSA exposures to cashseem to be more pronounced thanthe actual holdings indicate; the latterbeing about 10% less.Mar-08Weight, %Intrepid Small Cap is anon-diversified, highly concentratedportfolio, with relatively high turnover.Because of this, we decided to usesmall capitalization (S&P 600) sectorindices instead of "generic" styleindices to compute factor exposures.After running the RBSA optimization,we found the Predicted R-Squaredwas very high at about 93% usingsector indices and felt confident inproceeding with the attributionanalysis. SEC filings showedextremely high cash positions, andthe RBSA results confirmed theholdings-based information.Asset 020100Mar-08 - Sep-0903/03/08 - 09/30/09Style R-SquaredPredicted Style R-SquaredBenchmark R-Squared
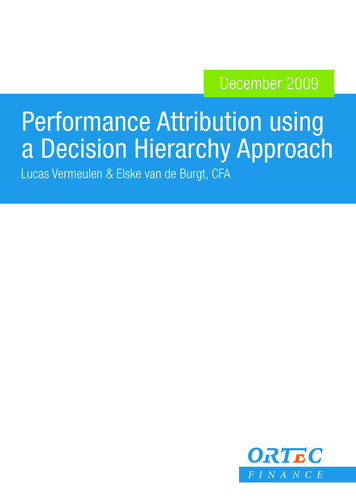
Performance Attribution ReportIntrepid Small CapStep 2 – Exposure and StyleExcess Weight, % (vs. Russell 2000 Index)Asset Loadings Excess of Russell 2000 IndexAt this point, we know the validity ofthe model factors are high based uponthe Predicted R-Squared and are alsoreasonable in light of the fund filings. Afew items stand out in terms ofexposure relative to the Russell 2000:(a) large cash exposure; (b)underweight in financials and healthcare, information technology, andindustrials. In terms of Style, we see(a) sizable cumulative outperformancerelative to both the benchmark andfactor portfolio (i.e. Style); and (b)negative monthly style returns duringsignificant periods last year. Theimmediate conclusion from thisnarrative is that the manager'soutperformance is most likely due tosuperior selection /31/08UtilitiesMaterials06/30/08Telecomm Health Care06/30/09Cons. StaplesCumulative Performance09/30/09Cons. Disc.IndustrialsMonthly Performance130Style Attribution12512015115110101005Return, %Growth of talCreated with mpi Stylus006/30/0812/31/08Russell 2000 Index05/29/09Style09/30/09Jun-08UtilitiesHealth CareMaterialsSep-08Dec-08Telecomm SvcsCons. StaplesEnergyMar-09Jun-09ITCons. Disc.CashSep-09FinancialsIndustrials
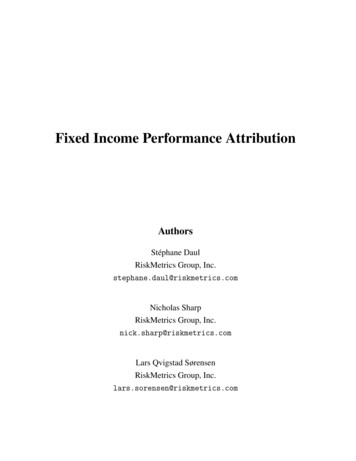
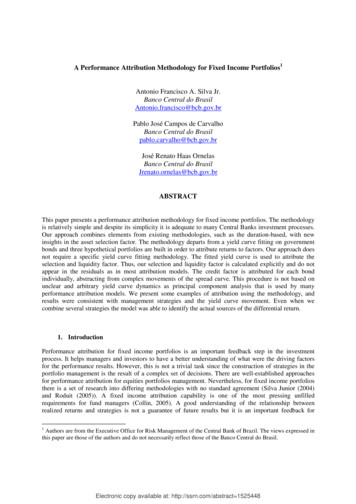
Performance Attribution ReportIntrepid Small CapStep 3 - Performance Attribution(Selection)Created with mpi StylusReturn, %Style Attribution1614121086420-2-4-6-8-10-12-14Mar-08 Apr-08 May-08 Jun-08 Jul-08 Aug-08 Sep-08 Oct-08 Nov-08 Dec-08 Jan-09 Feb-09 Mar-09 Apr-09 May-09 Jun-09 Jul-09 Aug-09 Sep-09SelectionHealth CareEnergyUtilitiesCons. StaplesCashTelecomm SvcsCons. Disc.ITIndustrialsCumulative nceExcessExcessSelectionTimingMar-08 - nualized Return, %403020100-10Growth of 100The manager changed its cash and sectorexposure during periods of significantmarket volatility; one would expect thecontribution of timing of such changes tohave an impact on the performance. Yet wesee that timing component is negligible.Most of the excess performance isgenerated through superior selection. Thecombination of both timing and selectionskill led to dramatic excess outperformanceof 23% over the Russell 2000 Index for theperiod. As indicated by the MonthlyPerformance Attribution chart, there were10 monthly periods between 6/30/08 and6/30/09 that Mr. Cinnamond shows positiveselection return skill. The cumulativeselection chart shows a dramatic straightline rise beginning in the last quarter of2008. This would indicate that Mr.Cinnamond's security picks made duringthis period appear to be very strong. Takinga deeper dive into holdings obtained fromSEC's website indicate that his bets onApplied Signal Technology, Oil DriCorporation of America, Family DollarStores and Scotts Miracle Gro companiesmade very positive contributions. Themonthly selection and style attributes chartprovides further granularity on the periodswhere selection skill appears. It isinteresting to note that during October –November 2008 and January – February2009 the only value added appears to havecome via superior security selection (lightpink bars). Sector exposures during thesame period detracted value. Mr.Cinnamond's security selection capabilitiescompensated and offset the poor sectorperformance.Monthly Dec-08May-09Sep-09Mar-08 - Sep-09
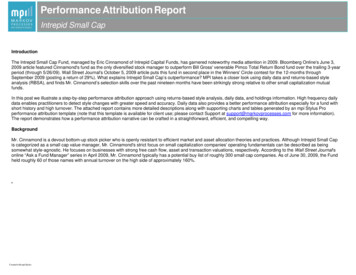
Performance Attribution ReportIntrepid Small CapStep 4 - Performance Attribution(Timing)12108Return, %6420-2-4-6-8Mar-08 Apr-08 May-08 Jun-08 Jul-08 Aug-08 Sep-08 Oct-08 Nov-08 Dec-08 Jan-09 Feb-09 Mar-09 Apr-09 May-09 Jun-09 Jul-09 Aug-09 Sep-09Utilities ExcessHealth Care ExcessMaterials ExcessTelecomm Svcs ExcessCons. Staples ExcessEnergy ExcessIT ExcessCons. Disc. ExcessCash ExcessFinancials ExcessIndustrials ExcessMonthly Factor Peformance40Total Annualized Return, %Overall timing contribution for the fundwas marginally positive. This isprimarily because the contribution fromCash is very negligible. While thetiming component is accuratelymeasuring the contribution from eachsector bet, it doesn't say whether itwas a good or bad decision on the partof the manager. To get a more intuitiveand better picture of how effective thetiming decisions were, we look atExcess timing attribution. (Note:Excess timing attribution is calculatedas the product of a manager excessweight in a particular factor and therespective factor's excess return overthe benchmark). Since Mr. Cinnamondhad excess factor exposures to cash,and cash outperformed the overallbenchmark (Russell 2000), the excesscash timing (green bars) helped thefund during declining markets.However, during the marketoutperformance periods shown in thebottom chart, the excess cash holdingsnegatively impacted the fund.Monthly Timing Attribution (Excess)3020100-10-20-30-40-50Mar-08 Apr-08 May-08 Jun-08 Jul-08 Aug-08 Sep-08 Oct-08 Nov-08 Dec-08 Jan-09 Feb-09 Mar-09 Apr-09 May-09 Jun-09 Jul-09 Aug-09 Sep-09CashIndustrialsHealth CareTelecomm SvcsCreated with mpi StylusEnergyCons. Disc.FinancialsUtilitiesMaterialsCons. StaplesITRussell 2000 Index
Performance Attribution ReportIntrepid Small CapStep 5 - Return PerformancePerformance to eekMTDIntrepid:Small CapQTDYTD1 YearRussell 2000 IndexPerformance to dateCumulative Performance130125120115110105Growth of 3/0810095908580757065605507/01/08Intrepid:Small CapCreated with mpi Stylus5.84.65-10Total Return, %The Cumulative and Performance toDate charts indicate that the managerwas tracking the benchmark more orless for period before October 2007and after March 2009. The decisionsthat Mr. Cinnamond took between thisperiod made a difference. Note thatfor the later part of this period thestock market went south. His decisionto not follow the market and avoid thishuge setback appears to have set himapart from the rest of his Russell2000 peer group.10/01/08 - 09/30/09Total Annualized Return, %Once we have a good grasp of thebehavior/dynamic of the fund, we canturn our attention to the return andrisk that result. The fund returned29.1% from September 30, 2008through September 30, 2009, whileRussell 2000 returned -9.5% over thesame period. The trailing 12-monthexcess return through the end ofSeptember 2009 was about 40%.YTD excess return is positive as well.01/02/0906/01/09Russell 2000 Index09/30/095002/29/0806/30/08Intrepid:Small Cap12/31/0805/29/09Russell 2000 Index09/30/09
Performance Attribution ReportIntrepid Small CapStep 6 - Distribution ProfileDistribution of Total Return20Frequency, %The Decile/Value (D/V) chart plotsmanager returns against benchmarkreturns with distributions expressed interms of its deciles along the X-axis.The D/V plot is indifferent to specifictime period, and evaluates the entiretime series and partitions into decilebuckets. In some ways, this is a visualextension of Up/Down marketstatistics. The average return of boththe benchmark and the fund for eachdecile are plotted along y-axis.Clearly, the manager returns areindependent to that of the benchmark.Particularly at the lower end, thefund's risk/return has a much betterprofile than that of the benchmark.Mar-08 - 159.35Total Return, %Intrepid:Small CapRussell 2000 IndexPerformanceMar-08 - Sep-09654Total Return, % (average)The return distribution of the fundshows thinner tails whereas thebenchmark distribution exhibits fattertails. The lower end of the benchmarkdistribution is also much morepronounced than that of the fund.3210-1-2-3-4-5-6123456Russell 2000 Index Return, % (decile)Intrepid:Small CapCreated with mpi StylusRussell 2000 Index78910
Performance Attribution ReportIntrepid Small CapStep 7 - RiskRisk to date10/01/08 - 09/30/096051.22Total Annualized StdDev, %Risk taken by Mr. Cinnamond hasbeen consistently lower than that ofthe benchmark. During the lastquarter of 2008 risk in the marketskyrocketed. The fund's risk alsospiked, however, it was well belowthat of the benchmark. The last 1-yearwhen the benchmark standarddeviation was 51%, the fund had astandard deviation of 35%. Thedrawdown profile has also beenrelatively better. The max drawdownis almost half of what the benchmarkproduced since March 2008. 95%rolling 90 day VaR shows lower thatthe manager consistently took lowerrisk than that of the .54100MTDIntrepid:Small CapQTDYTD1 YearRussell 2000 IndexMax Drawdown Return to date95% VaR: 90 day Rolling08-57-156-2095% VaR, %Max Drawdown Return, ntrepid:Small CapCreated with mpi Stylus01/02/0906/01/09Russell 2000 Index09/30/090Jul-08Sep-08Dec-08Intrepid:Small CapMar-09Jun-09Russell 2000 IndexSep-09
Performance Attribution ReportIntrepid Small CapStep 8 - Portfolio Level SafeguardAnnual Return ContributionJan-08 - Aug-093Return Contribution, %210-1-2Jan-08 - Aug-09Risk ContributionJan-08 - Aug-09Dec-07 - Aug-09120115110Growth of 1000.30.210510095900.18580Dec-070.0-0.1Created with mpi StylusCumulative Performance (Fund v. Portfolio)0.4Risk Contribution, %With concentrated managers such asIntrepid, an additional due diligencesanity check can be helpful by loadingactual holdings as a representativeportfolio. In this case, we took IntrepidSmall Cap's top holdings for thesemi-annual periods for the past2-years obtained from SEC filings.Note that this is not an accuraterepresentation of their daily holdingsbut rather a proxy. In June 2009, thetop 35 funds accounted for more than85% of funds total assets. Wecompared daily return values versusthe returns obtained from these actualunderlying holdings just to rule outany foul play. In addition, you'll find aportfolio-analysis level decompositioninto risk and return components.While Applied Signal Technologycontributed the most towards thefund's annual return, Unit Corpcontributed the most towards fund'srisk during the January 2008 toAugust 2009 period.Jan-08 - Aug-09Mar-08Jun-08TotalIntrepid:Small CapSep-08Dec-08Mar-09Intrepid PortfolioAug-09
Performance Attribution ReportIntrepid Small CapSummary Take Aways Daily data and returns-based style analysis can provide timely insight into the investment strategies of a fund. For a fund with shorter history and high turnover,monthly analysis would lack accuracy, robustness and granularity.A manager with exceptional selection skills can offset poor timing decisions and negative style impacts.Factor and benchmark selection biases are very important considerations. The analysis above can be broadened to include peer group benchmarks, other factormodels, and benchmarks respectively.Portfolio Analysis using historical top holdings can provide a useful, “back-of-the-envelope” 'sanity check' measure for concentrated portfolios.Created with mpi Stylus
Performance Mar-08 - Sep-09 0 5 10 15 20 25 Annualized Return, % Mar-08 - Sep-09 23.0 22.0 0.3 Excess Selection Timing Step 3 - Performance Attribution (Selection) The manager changed its cash and sector exposure during periods of significant market volatility; one would expect the contribution of timing of such changes to have an impact on the .