Transcription
Calculating EquityAttribution to Understanda Fund’s PerformanceOnboarding GuideDirect
Copyright 2020 Morningstar, Inc. All rights reserved.The information contained herein: (1) is proprietary to Morningstar and/or its content providers; (2) may not be copiedor distributed; (3) is not warranted to be accurate, complete or timely; and (4) does not constitute advice of any kind.Neither Morningstar nor its content providers are responsible for any damages or losses arising from any use of thisinformation. Any statements that are nonfactual in nature constitute opinions only, are subject to change withoutnotice, and may not be consistent across Morningstar. Past performance is no guarantee of future results.Morningstar Direct January 2020 2020 Morningstar. All Rights Reserved.
ContentsOverview . . . . . . . . . . . . . . . . . . . . . . . . . . . . . . . . . . . . . . . . . . . . . . . . . . . . . . . . . . . . . . . . 4Exercise 1: Create a new Equity Attribution report . . . . . . . . . . . . . . . . . . . . . . . . . . . . . . 5Exercise 2: Configure the settings for the report . . . . . . . . . . . . . . . . . . . . . . . . . . . . . . . . 7Exercise 3: Evaluate the attribution report values . . . . . . . . . . . . . . . . . . . . . . . . . . . . . . . 9Exercise 4: Exclude a security from analysis . . . . . . . . . . . . . . . . . . . . . . . . . . . . . . . . . . 11Exercise 5: Explore other important information on the report . . . . . . . . . . . . . . . . . . . . 15Exercise 6: Find the largest positions by weight in the fund . . . . . . . . . . . . . . . . . . . . . . 16Exercise 7: Find the median price-to-earnings ratio for the fund’s portfolio. . . . . . . . . . 17Exercise 8: Find the holding with the best quarter-to-date performance . . . . . . . . . . . . 18Exercise 9: Find the sector with the lowest price-to-book value . . . . . . . . . . . . . . . . . . . 19Exercise 10: Find the sectors with the biggestdeviations by weight from the benchmark. . . . . . . . . . . . . . . . . . . . . . . . . . . 20Exercise 11: Find the number of shares owned and YTD return of the largest stock . . . . 21Exercise 12: Determine whether the data on thereport reflects actual or inferred holdings . . . . . . . . . . . . . . . . . . . . . . . . . . . 21Exercise 13: Generate a PDF report for attribution. . . . . . . . . . . . . . . . . . . . . . . . . . . . . . . 22Morningstar Direct January 2020 2020 Morningstar. All Rights Reserved.3
Calculating Equity Attributionto Understand a Fund’s PerformanceThe Portfolio Analysis module in Morningstar DirectSM allows users to investigate afund’s portfolio by calculating single portfolio attribution of an equity fund. (This is alsosometimes referred to as micro attribution.) Reviewing equity attribution for a fundinvolves calculating its Active Return value. Active Return is a combination of amanager’s skill in stock selection and allocation of assets to a particular grouping, suchas stock sectors.Overview Note: Single portfolio fixed-income attribution is not yet available in Morningstar Direct.Calculating equity attribution values also requires comparing a fund’s holdings to thoseof a benchmark, which is typically an index. Therefore, users need access to the index’holdings to calculate equity attribution values. If this access is not already set up foryour account in the Content Catalog in Morningstar Direct, please contact yourCustomer Success Manager. Alternatively, users can select a Morningstar index as theattribution benchmark (because constituent holdings are automatically available forthese), or a representative ETF. To learn more about the methodology used in thiscalculation, login to the web-based version of Morningstar Direct, then read thismethodology paper.The following exercises are offered:g Exercise 1: Create a new Equity Attribution report (page 5)g Exercise 2: Configure the settings for the report (page 7)g Exercise 3: Evaluate the attribution report values (page 9)g Exercise 4: Exclude a security from analysis (page 11)g Exercise 5: Explore other important information on the report (page 15)g Exercise 6: Find the largest positions by weight in the fund (page 16)g Exercise 7: Find the median price-to-earnings ratio for the fund’s portfolio (page 17)g Exercise 8: Find the holding with the best quarter-to-date performance (page 18)g Exercise 9: Find the sector with the lowest price-to-book value (page 19)g Exercise 10: Find the sectors with the biggest deviations by weight from thebenchmark (page 20)g Exercise 11: Find the number of shares owned and YTD return of the largest stock(page 21)g Exercise 12: Determine whether the data on the report reflects actual or inferredholdings (page 21)g Exercise 13: Generate a PDF report for attribution (page 22)Morningstar Direct January 2020 2020 Morningstar. All Rights Reserved.4
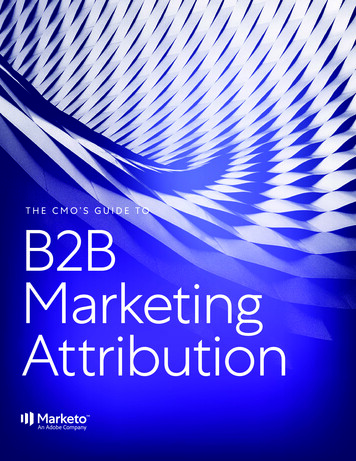
Calculating Equity Attribution to Understand a Fund’s PerformanceExercise 1: Create a new Equity Attribution reportThis exercise shows users the procedure for creating an on-screen equity attributionreport. This involves selecting the correct investment and benchmark, and entering aname for the report to make it easy to find later. Do the following:Exercise 1: Create a newEquity Attribution report1. In Morningstar Direct, click the Portfolio Analysis module.2. The Equity Attribution section should be expanded. Click the Single Portfolio folder.3. When the tutorial window opens, click Close. (To see it again the next time this moduleis selected, click Yes.)4. From the toolbar, click New. The New Report dialog box opens.Click this icon tocreate a new report.5. In the Portfolio field, type POAGX, then click the PRIMECAP Odyssey AggressiveGrowth fund.Use this field to search forand select the correct fund.Morningstar Direct January 2020 2020 Morningstar. All Rights Reserved.5
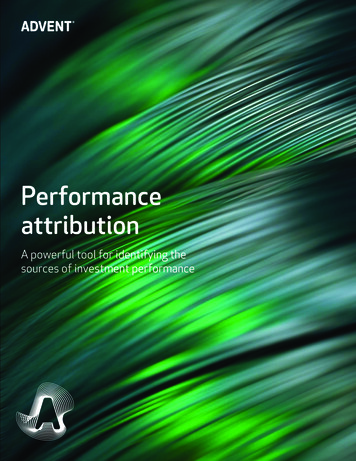
Calculating Equity Attribution to Understand a Fund’s PerformanceExercise 1: Create a new Equity Attribution report6. The Benchmark field selects the Primary Prospectus Benchmark by default, which in thisinstance is S&P 500 TR USD. If you do not have constituent rights to this index series,click the Benchmark drop-down field and select ETF Index Proxy.7. In the Report Name field, type PRIMECAP Odyssey Aggressive Growth Analysis.8. Under Report Settings, the New option should be selected. Click OK. The Settings dialogbox opens. The Settings dialog box allows a user to decide, among other things, whattime period the attribution analysis should cover, the portfolio breakdown, and theinvestment process.Note the values ofthe highlighted fields.Morningstar Direct January 2020 2020 Morningstar. All Rights Reserved.6
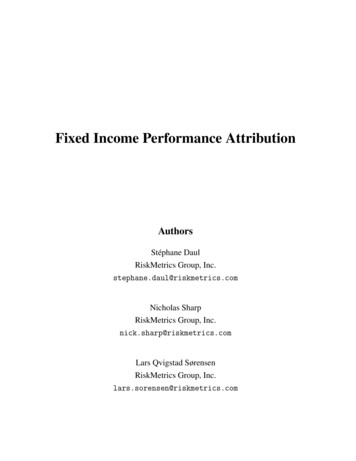
Calculating Equity Attribution to Understand a Fund’s PerformanceExercise 2: Configure the settings for the reportThis exercise shows users how to change certain settings on the report, including howto remove information that may not be needed for attribution analysis. This report usesan option for Two-Factor: Interaction in Selection Effect. This option focuses on one ormultiple Weighting allocation decisions prior to Security Selection. The WeightingEffect is primary, then, and the Selection Effect is secondary. That is, the manager’schoice to weight certain stock sectors has primacy over the decision to pick any stocks.The Interaction Effect itself is incorporated in the Selection Effect. For more informationon the Investment Process, refer to this methodology paper. Do the following:Exercise 2: Configure thesettings for the report1. Ensure the Start Date is set to 3 months ago, and the End Date is Last Quarter End.2. Set the Display Frequency to Single.3. Ensure the Calculation Frequency is set to Monthly.4. Confirm the Grouping option is set to Morningstar Sector.5. Under the Calculation Options section confirm the Investment Process field is set toTwo-Factor: Interaction in Selection Effect.Note the values forthe highlighted fields.Morningstar Direct January 2020 2020 Morningstar. All Rights Reserved.7
Calculating Equity Attribution to Understand a Fund’s PerformanceExercise 2: Configure the settings for the report6. From the left navigation pane, click View Settings.7. The View Settings page allows users to select each title on the left to decide what todisplay or hide in the report. Select Attribution, then deselect the following options inthe Column Display area:g Rescaled Weights, andg Contribution.Users can select anypage to the left inorder to show, hide,or change values fordata shown on eachpage of the report.8. Click OK. The report calculates and opens in a new window. Once the calculation iscomplete, the Highlights page is automatically displayed. It shows an overall summary ofthe results. The pages to the left reflect the choices made on the View Settings page.9. Look at the Attribution Total row. Is the value under the Active Return column positive ornegative? How did both the Morningstar Sector Weighting % total and the Selection %total contribute to this result?Note thesummary values here.Morningstar Direct January 2020 2020 Morningstar. All Rights Reserved.8
Calculating Equity Attribution to Understand a Fund’s PerformanceExercise 3: Evaluate the attribution report valuesIn this exercise, two levels of data are available on the Attribution page of the report:Level 1 is the Sector breakdown, and Level 2 is the Security breakdown. Which sectorsand holdings were the best and worst for this fund during this time period? Thisexercise shows users how to explore this page of the report to uncover this attributioninformation. Do the following:Exercise 3: Evaluate theattribution report values1. Select the Attribution page.2. Double-click the Active Return column header twice to sort this column in descendingorder. The sector with the best Active Return (after combining both the sector andweighting columns) is at the top.Double-click thiscolumn header twiceto sort the data inthe correct order.3. Click the arrow to the left of the top sector to expand it. The stock in this sectorcontributing the best return relative to the index is shown at the top. What was its returnover the past quarter? Does this stock stand out in driving the Selection Effect for thissector, or do other stocks also contribute significantly?Click the arrow tothe left of a sector’sname to expand it.4. Click the arrow to the left of the top sector to collapse it.Morningstar Direct January 2020 2020 Morningstar. All Rights Reserved.9
Calculating Equity Attribution to Understand a Fund’s PerformanceExercise 3: Evaluate the attribution report values5. Double-click the Active Return column header to sort it in ascending order.6. Expand the stock sector now at the top. Which holding here has the largest negativeSelection Effect due to under performance? Do any stocks in this sector offer a positivereturn relative to the index for the time period?Note the new sortorder for this column.Morningstar Direct January 2020 2020 Morningstar. All Rights Reserved.10
Calculating Equity Attribution to Understand a Fund’s PerformanceExercise 4: Exclude a security from analysisWhen calculating Equity Attribution, it is possible to exclude a security from the reportto see the effect on the Active Return value over the time period had the fund managernot invested in that security. Use the following table to compare these values for thecurrent settings seen versus those seen after removing the worst-performing stockfrom the worst-performing sector in this exercise:StatisticOriginal ValueExercise 4: Exclude asecurity from analysisValue afterExclusionActive Return TotalWorst-Performing SectorMorningstar Sector Weighting %Selection % EffectTo exclude an underlying position for a fund, do the following:1. Take note of the stock sector to which the worst-performing stock belongs.2. From the toolbar, click Settings Report Settings. The Settings dialog box opens.Select this option to excludea security from the report.Morningstar Direct January 2020 2020 Morningstar. All Rights Reserved.11
Calculating Equity Attribution to Understand a Fund’s PerformanceExercise 4: Exclude a security from analysis3. Click the icon next to the Exclusions field. The Exclusions dialog box opens.Click this icon to selectstocks to exclude.4. Expand the worst-performing sector, then select the stock with the worst performancenoted earlier.5. Click Exclude, then click OK.Once a stock is excluded, it no longerappears in the Available Data area.Morningstar Direct January 2020 2020 Morningstar. All Rights Reserved.12
Calculating Equity Attribution to Understand a Fund’s PerformanceExercise 4: Exclude a security from analysis6. Click OK again to return to the attribution report, which automatically calculates.7. Select the Attribution page, then fill out the Value after Exclusion column in the table onpage 11 with the new data. Note: The report displays a section for any bonds or stocks missing performance, and “other”securities which are not taken into account in the Equity Attribution report. It also nowincludes the Excluded section, where users can see any excluded securities.Note the newvalues and order ofsectors with justone stock excluded.8. To include the worst-performing stock again in the attribution report, from the toolbar,click Settings Report Settings. The Settings dialog box opens.9. Click the icon next to the Exclusions field. The Exclusions dialog box opens.Morningstar Direct January 2020 2020 Morningstar. All Rights Reserved.13
Calculating Equity Attribution to Understand a Fund’s PerformanceExercise 4: Exclude a security from analysis10. In the Select Exclusions area, select the stock, then click Include.Select the excluded stock,then click this button.11. Click OK to close the dialog box, then click OK again to recalculate the report.Morningstar Direct January 2020 2020 Morningstar. All Rights Reserved.14
Calculating Equity Attribution to Understand a Fund’s PerformanceExercise 5: Explore other important information on the reportThe Reported Total value seen on the report is the actual return of the investmentreported to Morningstar. For a mutual fund, this is the NAV return. For an index, it isthe actual return of the index. This differs from the Attribution Total which is theweighted average returns of the underlying stocks calculated using the beginning ofthe period weight assuming a buy-and-hold approach. In other words, the AttributionTotal is a hypothetical return. This hypothetical return is gross of fees and expenses.Exercise 5: Exploreother importantinformation on the reportNote the discrepancythat can exist betweenthese two values.To be consistent with how index returns are calculated, the hypothetical returncurrently assumes dividend reinvestment on the ex-date, when in reality someportfolios may receive dividends in cash. The hypothetical return also excludes anysecurities shown below the Attribution Total row.The Residual value is the difference between the Reported Total row and theAttribution Total row after accounting for a fund’s Expense Ratio. This Residual value isa standard industry term, but it can often be confused with “Interaction,” which is thethird factor when conducting three-factor attribution analysis.Morningstar Direct January 2020 2020 Morningstar. All Rights Reserved.15
Calculating Equity Attribution to Understand a Fund’s PerformanceExercise 6: Find the largest positions by weight in the fundThe Highest/Lowest page displays fundamental data for those securities with thehighest and lowest weights in the portfolio. Note that the information on this page is aweighted average of each stock’s position, while the weights on the Attribution pageare as of the end of the time period being shown on the report.Exercise 6: Find thelargest positions byweight in the fundTo see which holding had the largest average weight and determine if it had a positiveor negative impact on the fund, do the following:1. Select the Highest/Lowest page.2. Expand the 10 Highest section. The holdings are automatically sorted by the PortfolioWeighting % column.Select the correctpage, then notethe holding at thetop of this section.3. Select the Attribution page. Expand the appropriate sector to find the largest stock. Note: If it is not apparent which stock sector the largest holding belongs to, return to theHighest/Lowest page, expand the Highest section, then double-click the name of thelargest stock to open the Morningstar Report for that holding in a browser. Scroll to thebottom of the Morningstar Report to see its Sector classification.4. Look at its Selection % value. Did the largest holding offer a positive or negative valuefor the fund?Morningstar Direct January 2020 2020 Morningstar. All Rights Reserved.16
Calculating Equity Attribution to Understand a Fund’s Performance Exercise 7: Find the median price-to-earnings ratio for the fund’s portfolioThe Portfolio Statistics page compares the overall valuation results of the portfolio to itsbenchmark. Both Historical and Latest Data are available. To find the medianprice-to-earnings ratio for the fund, do the following:1. Select the Portfolio Statistics page.Exercise 7: Find themedian price-to-earningsratio for thefund’s portfolio2. Expand the P/E - Daily section.3. Find the Median value for the latest portfolio, and compare it to the benchmark. Are theholdings of the fund cheaper or more expensive than those in the benchmark?Compare thesetwo values.Morningstar Direct January 2020 2020 Morningstar. All Rights Reserved.17
Calculating Equity Attribution to Understand a Fund’s PerformanceExercise 8: Find the holding with the best quarter-to-date performanceThe Trailing Performance page displays the performance of various time periods by thechosen grouping and security levels. To see which holding had the best performance inthe quarter being examined on the report and what its weight in the portfolio is, dothe following:Exercise 8: Find theholding with the bestquarter-to-dateperformance1. Select the Trailing Performance page.2. Click the Level 2 button to expand all sectors.Click this buttonto expand allsectors at once.3. Double-click the Quarter-to-Date Portfolio Return % column header to sort thecolumn in descending order.Review every sectorto ensure thecorrect stock withthe highest returnhas been found.4. Scroll down to find the stock with the best return in this column, and take note of thesector to which it belongs.5. Select the Attribution page.6. Expand the sector to which the stock belongs.7. What was the stock’s weight in the portfolio?Morningstar Direct January 2020 2020 Morningstar. All Rights Reserved.18
Calculating Equity Attribution to Understand a Fund’s PerformanceExercise 9: Find the sector with the lowest price-to-book valueThe Valuation by Data Point page displays the portfolio’s valuation results by thechosen grouping and security levels. Both Historical and Latest Data are available. Tosee which stock sector has the lowest price-to-book value, do the following:Exercise 9: Find thesector with the lowestprice-to-book value1. Select the Valuation by Data Point page.2. Click the Level 1 button.3. Under the P/B - Daily section, double-click the column header for the most recenttime period.Click the Level 1button, thendouble-click thiscolumn header to sortit in ascending order.4. Which sector had the lowest price-to-book value at the end of the time period, andwhich had the highest?Morningstar Direct January 2020 2020 Morningstar. All Rights Reserved.19
Calculating Equity Attribution to Understand a Fund’s PerformanceExercise 10: Find the sectors with the biggest deviations by weightfrom the benchmarkThe Weights page compares the weights of the portfolio versus the benchmark by thechosen grouping and security levels. To easily see where the portfolio differs most fromthe benchmark in this regard, do the following:1. Select the Weights page.Exercise 10: Find thesectors
Note: Single portfolio fixed-income attribution is not yet available in Morningstar Direct. Calculating equity attribution values also requires comparing a fund’s holdings to those of a benchmark, which is typically an index. Therefore, users need access to th