Transcription
PerformanceattributionA powerful tool for identifying thesources of investment performance
2 Performance AttributionInsightAttribution provides insights that helpcommunicate where investment returnshave come from to clients, prospects,and the firm itself.This communication is provided by Advent Software, Inc. (“Advent”) for informationalpurposes only and should not be construed as or relied on in lieu of, and does notconstitute, legal advice on any matter whatsoever discussed herein. Advent shall have noliability in connection with this communication or any reliance thereon.
3A PowerfulAnalytic ToolThis paper was written with thegenerous assistance of DavidSpaulding, CIPM, an internationallyrecognized expert on investmentperformance measurement andpresident of The Spaulding Group.He is also the founder and publisherof The Journal of PerformanceMeasurement.Performance is an investment manager’scalling card, and it’s often said thatperformance attribution has become thehottest area in performance measurement.Attribution has become a standard partof the portfolio manager’s analytical toolkit, providing insights into what is workingand what is not. It provides a way tocommunicate where the returns have comefrom when meeting with prospects as wellas existing clients. And it has allowed theperformance measurement team to workmore closely with the investment groupby providing important information on theresults of their investment decisions.This white paper provides an overviewof what performance attribution isand how it works and contrasts two ofthe more popular models to calculateequity attribution. It is designed to be anintroduction to the topic, not an exhaustivediscussion, but it is hoped that readerswill come away with a firm grasp of thefundamental principles of attribution aswell as a practical understanding of howthey can be used to measure performance.Our focus is solely on equities, since fixedincome attribution is a complex topicbeyond the scope of this paper.A Familiar ConceptAttribution, by itself, isn’t a new concept.People have engaged in attribution analysisfor many, many years; probably centuries.Many individuals are trained in attributionanalysis, although they may not know it.For example, when police officerscome upon an automobile accident,they will often conduct an analysis todetermine the cause(s) of the accident.Similarly, firefighters typically conductinvestigations after a fire to determine thecause. Sports teams regularly engage in apost-game analysis as a way to determineif their strategy was successful or not.The basic concept of attribution istherefore something we see on a fairlyregular basis. In the case of police and fireofficials, they’re analyzing something thatoccurred independently of their actions.For sports teams, they no doubt had somestrategy that they developed in advance ofthe event and now want to review the gameto determine what worked and what didn’t.The process may be summed up in threewords: strategy, execution, analysis.
4 Performance AttributionAttribution hasbecome a standardpart of the portfoliomanager’s analyticaltool kit.
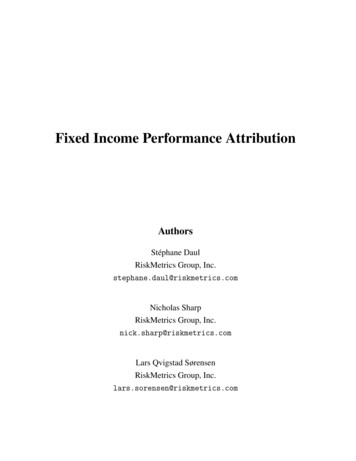
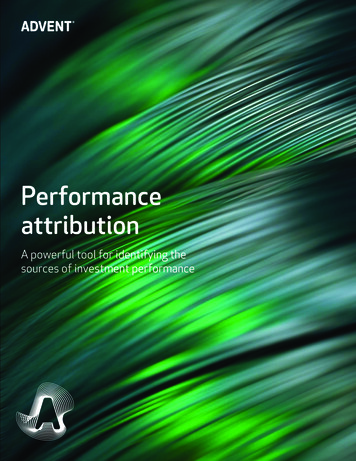
5Figure 1Relative versusAbsolute AttributionExcess ReturnAbsoluteAttributionTotal ReturnRelative AttributionPortfolio ReturnWhen it comes to conducting analysis inthe investment arena, our approach is quitesimilar to what a sports team does: theportfolio manager(s) usually starts witha strategy, then implements or executesthe strategy, and then wants to conductanalysis to determine if the strategyworked. We call this analysis “attribution.”Relative versus AbsoluteAttributionOne of the basic rules of attribution is thatthe approach we use should be relatedto the strategy; otherwise, we may beanalyzing the wrong things. We want tofocus on the decisions that were madeto determine if they were effective ornot. The decisions produce “effects,” andconsequently we want to analyze theeffects that result from the decisions. Wecall these “allocation effects.”We can split attribution into many differentcategories. For the purpose of thispaper, we will focus primarily on relativeattribution. We will now briefly contrastthis approach with absolute attribution,which is also referred to as “contribution.”Index ReturnPortfolio ReturnIn both cases, we are attempting toreconcile to some number: for relativeattribution, we’re reconciling to theexcess return (i.e., the portfolio minus thebenchmark or index return); for absoluteattribution, we’re reconciling to the totalreturn. In each case, we want to understandwhere that number came from, whatcontributed to it as well as what detractedfrom it.Absolute attribution is the typical sourcefor a manager’s top ten or bottom teninvestments, for example. Many managerswant to highlight their winners and losers.Our focus in this paper will be on relativeattribution: we will demonstrate a processto understand where the excess rate ofreturn (ROR) came from.The Effects to Analyze:Allocation and SelectionIf we think about equity managers, onetypical way to distinguish them is tocompare top-down managers with bottomup ones. In the case of top-down managers,the process often begins with a review ofthe economy; the managers may also takeinto consideration the political activitiesthat may be occurring. Based on theirprojections on what the future may hold,they can make some predictions on howthe various segments of the market mightrespond.If their analysis suggests that certainsegments should do well, they may wantto overweight them relative to the indexthey’re managing against; on the otherhand, if they’re projecting that othersegments won’t fare too well, they mayunderweight them. These over- and underweighting decisions are the allocationdecisions; thus they’re ones we may want toreview to determine if they worked or not.The next step in the process would be toselect the stocks in which they want toinvest. This selection decision will also beevaluated.In the case of bottom-up managers,the decision often begins with theidentification of securities they will wantto purchase as well as those they wishto sell. Thus, we want to analyze themanager’s selection decision as we didin the case of the top-down manager. Acontroversial aspect of attribution deals
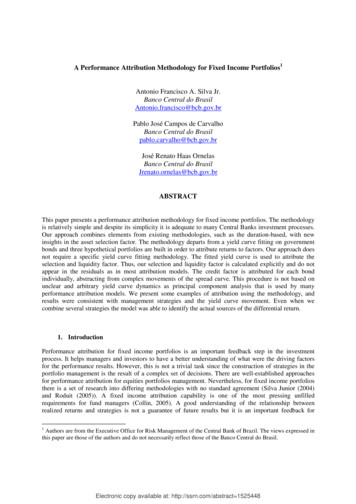
6 Performance AttributionFigure 2A Top-Down Approach to InvestingEconomic DataCPI, unemployment stats,production figures, interest ratePredict the Impact on Industry SectorsHelp technology, hurt banking,bullish on Technology, bearish onBanksIndexTechnology 4%Banks 5%Allocation Decision and StrategyTechnology 6%Banks 3%We will want to assess both theAllocation decisions and the Selectiondecisions.Security Selection Decisionsand Strategywith whether or not we should also lookat the allocation decision. In some cases,bottom-up managers have been known toargue vehemently in opposition to usinga top-down model. And, if you think aboutour rule, one might argue against its use,suggesting that we should only focus onthe selection decision.authors.1 While these models are quitesimilar, there is a key distinction betweenthem.While it may be true that the managerdidn’t make a conscious allocation decision,there will no doubt be some differencesin the way the securities are allocatedin the portfolio relative to the index; inaddition, these allocation differences canhave an impact on the manager’s return.Consequently, we generally recommendthat even bottom-up managers take a lookat the allocation effect.The Brinson Hood Beebower (BHB) modelwas published in 1986 and has been quitepopular (BHB (1986)). This model hasthree effects, two of which we’ve alreadydiscussed: allocation and selection. We willdiscuss the third effect shortly.How do we analyze these effects? Weemploy models. Models are mathematicalformulas which take into considerationvarious characteristics of the portfolio andits related index to both reconcile to theexcess return as well as to apportion theexcess return across two or more of oureffects. Our experience and research haveshown that the two most popular modelsfor equity attribution were developedby Gary Brinson, along with various co-Allocation Formulawhere:The Brinson HoodBeebower ModelThe allocation effect measures the impactof the manager’s over- and under-weightingdecisions.AllocationBHB (wP – wB ) (rB)wP the portfolio’s weightin a sectorwB the benchmark’s weightin the same sectorrB the benchmark’s returnsfor the given sectorThe difference in weights represents theallocation decision. For example, if wewere bullish on a particular segment, wewould presumably want to overweight it inanticipation of it having good performance;on the other hand, if we were bearishwe would probably want to reduce ourexposure to it relative to the index, andtherefore underweight it.1See TSG (2007), page 23
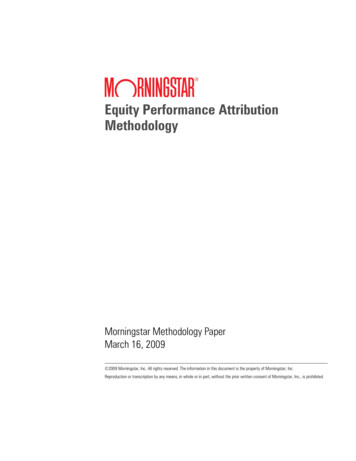
7Figure 3A Bottom-Up Approach to InvestingIndustry Allocation falls outfrom stock selectionBut is there an overtallocation decision andstrategy that we needor want to assess?Begins with stock selectionWe will want to assessthe Selection decision.Even though a manager may not havemade conscious allocation decisions,can there be a benefit from reviewingthe allocation effects? Will it provideus with some additional insights?Assessing the Allocation DecisionFigure 4Technology 2% ogy -2% ROROverweightNegativeUnderweightPositiveFor example, in Figure 4, we see in one casethat technology had a positive return. If wewere to overweight it, our portfolio wouldhave more invested in the sector than theindex. This would result in a positiveweighting factor and multiplying this by thepositive return would yield a positiveresult. Here, we would basically be sayingthat we’re being rewarded foroverweighting a sector that had good,positive performance.On the other hand, if we had chosen tounderweight the sector, our portfolio’sweight would be below the index. Thiswould mean the difference would benegative and multiplying this differenceby our positive return would yield anegative result. This can be interpreted asa negative assessment of our decision tounderweight a positively performing sector(i.e., we failed to take advantage of a sectorthat had a positive return).In the second case, our return is negative.If we had overweighted it, we wouldhave a positive weighting (our weightbeing greater than the index’s) beingmultiplied by a negative return. Thiswill yield a negative result, suggestingthat our overweighting of a poorlyperforming sector wasn’t a good idea. Ifwe underweighted it, we’d have a negativeweight difference being multiplied by anegative return. This results in a positiveeffect, thus rewarding us for avoidinghaving too much of our investment in apoorly performing sector.Our second effect is selection.Selection FormulaSelectionBHB (rP – rB ) (wB)where:rP the portfolio’s returnin the sectorThe first factor represents our skill atpicking better securities than thebenchmark. If our return is higher, then ourresulting effect (after multiplying thisvalue by the benchmark’s weight) will yielda positive number. If our selection wasn’tas good as the benchmark, then thedifference will be negative, resulting in apoor score for our selection.
8 Performance AttributionA Graphical Viewof the EffectsA Graphical Viewof the Effectswithout eractionEffectPortfolioFigure 6PortfolioFigure gure 5 shows an attempt to portraythese effects visually. The outside boxrepresents the portfolio’s total return;we show within this box the contributionthat comes from the benchmark. Recallthat with relative attribution we wishto account for the difference betweenthe portfolio and the index. You can seehow the allocation and selection effectscontribute to this difference; however,there remains a bit that isn’t accountedfor by either of these effects. While theauthors of the BHB model referred to thiseffect as simply “other,” the industry hasgenerally settled on the term “interaction.”The formula for interaction can easily bederived by looking at Figure 5 and is:InteractionBHB (wP – wB ) (rP – rB utionReturnIf you refer back to our other two formulas,you can see that this formula includes theallocation factor (the difference in weights)as well as the selection factor (differencein returns); thus, it’s the combination ofthese two decisions. While this may seemlike a reasonable explanation, the reality isthat the interaction effect is quitecontroversial (see, for example, Laker(2000), Spaulding (2003/2004), Campisi(2004), and Spaulding (2008)). Somecontend that the effect should be includedwith selection (or perhaps even allocation),while others argue that it should be shownseparately. Space isn’t adequate to givethis topic enough attention, so if you’recurious about the arguments, we suggestyou consult one of the aforementionedreferences.BMPortfolioIf you choose to, you can eliminatethe interaction effect by replacing thebenchmark’s weight with the portfolioweight in the selection formula:SelectionBHB (rP – rB ) (wP)As can be seen in Figure 6, if we elect to dothis we are essentially combininginteraction with selection. Again, we won’tdiscuss the pros or cons of this approach,but simply acknowledge that it’s an option.
9Figure 7Applying the BHB ModelThe scenario we will analyze.RORWeightPortfolioIndexPortfolioIndexBasic %Consumer communications-0.20%-0.21%13%10%Consumer, 0%100%Applying the BHB ModelNow let’s apply the BHB model to aportfolio and its index. Figure 7 shows theweights and returns for our benchmarkand index as well as the ten sectorsthat comprise both. As you can see, theportfolio had a return of 0.29% while theindex’s return is 0.19%, meaning we havean excess return of 0.10% or 10 basispoints. We want to reconcile tothis value.For illustration purposes, we’ll begin bylooking at the Basic Materials sector. Wecan see that the manager underweighteda positively performing sector; recall thatthis should yield a negative effect (referto Figure 4). Our portfolio outperformedthe index, so our selection effect shouldbe positive. And because we have anunderweighting factor from the allocationbeing multiplied by a positive selectionfactor, our interaction effect will benegative.Our results:AllocEffect rB (wP – wB ) 0.0015 (0.10 – 0.11) –0.002%SelEffect wB (rP – rB ) 0.11 (0.0025 – 0.0015) 0.011%InterEffect (wP – wB ) (rP – rB ) (0.10 – 0.11) (0.0025 – 0.0015) –0.001%Hopefully these results make intuitivesense.
10 Performance AttributionFigure 8Applying the BHB Model to the ScenarioFigure 8 shows the model applied to the entire scenario. As you can see, we successfully reconciled to our excess xAllocationStk SelInteractionTotalBasic 9%Consumer sumer, .102%TechnologyFigure 9BHB with and without InteractionWe mentioned that if you’d prefer not to see interaction, we could substitute the portfolio weight for the benchmark’s weight in theselection effect. If we do this, our allocation effect will be identical to what we see in Figure 8; the only difference will be the combiningof the interaction and selection effects, as we see in Figure 9.AlternativeBasic MaterialsBHBStk SelAllocationAllocationStk ustrials-0.001%0.010%0.010%-0.001%0.000%Consumer nications0.001%-0.006%-0.006%0.001%0.000%Consumer, io0.002%100%0.100%0.001%0.000%
11The various models are mathematicalformulas which take into considerationcharacteristics of the portfolio and itsrelated index to both reconcile to theexcess return as well as to apportionthe excess return across two or moreof our effects.
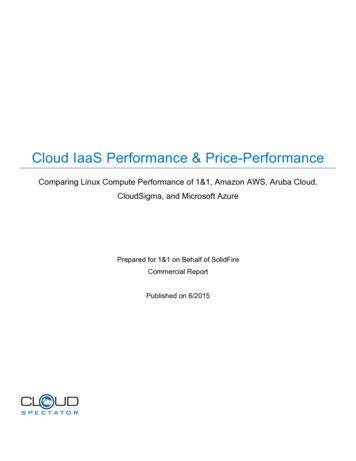
12 Performance AttributionFigure 11Comparing the BHB and BF Approaches to AllocationBF ViewOverweight ifSector Return IndexBHB ViewOverweight ifSector Return 0BanksTechnology3% Index ReturnTelecomTelecomFinancial0%Cons CyclicalSigns will Flip-3% Index ReturnIndustrialsHealthcareHealthcareBHB ViewUnderweight ifSector Return 0UtilitiesNegative Index ReturnThe Brinson Fachler ModelThe year before the BHB article waspublished, The Journal of PortfolioManagement published an article byGary Brinson and Nimrod Fachler (BrinsonFachler (1985)). Although this model isolder, many seem to favor it over the BHB.2The Brinson Fachler (BF) model is quitesimilar to the BHB, with one significantdifference: how the allocation effect iscalculated:Allocation Formula(wP – wB ) (rB - RB)where:the overallbenchmark returnSee TSG (2007), page 23Cons CyclicalIndustrialsEnergyBF ViewUnderweight ifSector Return Index2Signs will FlipFinancial0%RB TechnologyAutoAutoAllocationBF BF ViewOverweight ifSector Return IndexBanksEnergyBF ViewOverweight ifSector Return IndexUtilitiesPositive Index ReturnIn the case of the BHB approach, wemultiplied our weighting differences bythe benchmark’s sector return. Here, wemultiply the weighting difference by thebenchmark sector’s relative return, wherethe sector’s return is relative to the overallbenchmark return. The differences can besignificant. Let’s consider the followinginput values:Because the BF views allocation decisionsfrom a relative basis, it is rewardingoverweighted sectors that outperformthe overall benchmark return, whilepenalizing when we overweight sectorsthat underperform. Figure 10Portfolio weight: 8%Benchmark weight: 2%Sector return: –1.5%Overall benchmark return: –3.5%.As you can see, we decided to overweightthis sector relative to the benchmark;however, the sector’s performance isnegative. As we previously saw, theBHB model doesn’t like the idea ofoverweighting a negatively performingsector. But this sector actuallyoutperformed the overall benchmark.So, what are the results? The BHB willcalculate a –0.09% allocation effect whilethe BF will give us a positive 0.12% effect,meaning a 21 basis point swing, fromnegative to positive! We invite you to trythe math yourself to see if you can come upwith the same results.Comparing How the BF and BHB ModelsRespond to Allocation DecisionsTechnology 2% ROROverweightIndex 4% RORBHBBFPositiveNegativeUnderweight NegativePositiveTechnology -2% RORIndex -4% ROROverweightPositiveNegativeUnderweight PositiveNegative
13Figure 12Contrasting the Allocation EffectsBF AllocationThe decision as to whether to usethe BF or BHB models should bebased on your view of investing.Basic sumer s-0.0119%-0.006%0.0354%0.026%0.100%0.100%Consumer, Non-CyclicalPortfolioComparing the Two ModelsFigure 10 compares ho
fundamental principles of attribution as well as a practical understanding of how they can be used to measure performance. Our focus is solely on equities, since fixed income attribution is a complex topic beyond the scope of this paper. A Familiar Concept Attribution, by itself, isn’t a new concept. People have engaged in attribution analysisFile Size: 1MB