Transcription
TABLE OF CONTENTSTable of Contents. iExecutive Summary .vReport of the Survey of Doctoral Alumni.1Introduction.1Description of Graduates .1Occupations and Employers .5Postdoctoral Experiences. . . . .5Positions Held and Described .7Bumpers College of Agricultural, Food, and Life Sciences .7College of Education and Health Professions.7College of Engineering .8Fulbright College of Arts and Sciences .8Walton College of Business.9Employers and Employers’ Industry or Business.19Bumpers College of Agricultural, Food, and Life Sciences .19College of Education and Health Professions.20College of Engineering .20. Fulbright College of Arts and SciencesWalton College of Business.22Job Selection .31Job Locations .32Doctoral program requirements and relevance .34Academic Experiences and Outcomes.34Practical Preparation .34Non-Traditional Classroom Delivery Methods .35Graduate Studies Supported Employment .3621
Doctoral Alumni Survey Report, 2001Survey Research Center, University of ArkansasEvaluation of Dissertation Processes .38Evaluation of Academic Experiences and University Resources .39Admissions.39Instruction .40Professors and Coursework.40Advising and Mentoring .40University Resources .40Open-ended Opinions about Quality and Importance of Coursework.42Most Valuable Courses .42Bumpers College of Agricultural, Food, and Life Sciences .42College of Education and Health Professions.42College of Engineering .43Fulbright College of Arts and Sciences .44Walton College of Business.44Least Valuable Courses.65Bumpers College of Agricultural, Food, and Life Sciences .65College of Education and Health Professions.65College of Engineering .66Fulbright College of Arts and Sciences .66Walton College of Business.67Coursework and Doctoral Expectations.80Finances .80Primary Source of Financial Support.80Annual Salaries .82ii
Doctoral Alumni Survey Report, 2001Survey Research Center, University of ArkansasEducational Debt.83Doctoral Debt.84Professional Recognition and Satisfaction.85Career Satisfaction .85Promotions .85Awards and Honors.85Reflections on Study at the University of Arkansas .90Suggested Improvements for the Programs of Study .90Bumpers College of Agricultural, Food, and Life Sciences .90College of Education and Health Professions.90College of Engineering .91Fulbright College of Arts and Sciences .91Walton College of Business.92Reflections on Attending the U of A .102Bumpers College of Agricultural, Food, and Life Sciences .102College of Education and Health Professions.102College of Engineering .103Fulbright College of Arts and Sciences .103Walton College of Business.104Reflections on Departmental Paths.116Bumpers College of Agricultural, Food, and Life Sciences .116College of Education and Health Professions.116College of Engineering .117Fulbright College of Arts and Sciences .117iii
Doctoral Alumni Survey Report, 2001Survey Research Center, University of ArkansasWalton College of Business.118Summary and Conclusions .128Appendix A: Survey Methods . A-1Appendix B: Alumni Survey Instrument .B-1Appendix C: Means and Frequency Tables of Alumni Responses.C-1Appendix D: Open-Ended Responses. D-1Appendix E: Codebook.E-1iv
Doctoral Alumni Survey Report, 2001Survey Research Center, University of ArkansasEXECUTIVE SUMMARYThe University of Arkansas’ Graduate School and Colleges of Agricultural, Food andLife Sciences, Arts and Sciences, Business Administration, Education and Health Professions,and Engineering surveyed doctoral alumni to gain their assessments of their doctoral programs.Surveys were sent to all doctoral alumni for whom addresses were available from the classes of1996 through 2000 during the summer of 2001. Of the 461 surveyed, 226 responded (46percent).Forty-six percent of the doctoral alumni who graduated between 1996 and 2000 forwhom addresses were available responded to this questionnaire. They had engaged in doctoralwork at the U of A for four to five years. About 61 percent are male. Two percent identifyHispanic, Latino, or Spanish cultural backgrounds. Approximately three-fourths are EuropeanAmerican; 5 percent, Native American; 11 percent, Asian American; 5 percent, AfricanAmerican; and 3 percent of other ethnic heritages. Seventy-six percent obtained a Ph.D.; and 24percent, an Ed.D. The average age is 42.All but six of the respondents are gainfully employed. More than 60 percent areemployed by educational institutions in tenure or non-tenure track positions. About one-fifth areemployed in private industry or government. Eight percent of the alumni have pursuedadditional education since their doctoral graduation.The alumni are primarily engaged in teaching and research. Some work asadministrators, and others work in professional positions according to their area of specialization.The majority of the alumni’s employers are institutions of post-secondary education, rangingfrom community colleges to four-year universities. Elementary and secondary school systemsare also represented. Non-academic places of employment include a variety of private sector andgovernmental agencies.The largest fraction of responding doctoral alumni state that the most important factor inselecting their current job was congruency with skills and interests. Geographic location,previous employment, and opportunity for advancement also influenced significant groups of therespondents. One-fourth of the respondents work in Arkansas. Texas is the next most commonplace of employment, followed by Missouri. Forty-two of the 50 United States and the Districtof Columbia are represented by the geographic distribution of this sample of doctoral alumni. Inaddition to the U.S., South Korea, China, Taiwan, and England are among the countries in whichthe respondents work.Sixty percent of the responding graduates report that the doctoral degree obtained fromthe University of Arkansas was required for their current position. Nearly three-fourths contendthat their degree is directly related to the work in which they are currently engaged. Eighty-eightpercent believe their doctoral studies prepared them well or extremely well for either theircurrent employment or the employment they seek.At least seventy-percent of those who responded consider themselves well or very wellprepared in each of six areas evaluated in practical preparation. More than 80 percent assert thatthey were well or very well prepared to do the research and write their dissertations. Next, thealumni assess themselves as having been well prepared for their current positions and to growpersonally while in graduate school. Seventy-three and 78 percent of the alumni contend thatthey were well or very well prepared compared with other institutions they may have previouslyattended, and for competing in the job market, respectively. Seventy percent of them claim tohave been well or excellently prepared compared with colleagues who were educated at otheruniversities. With the exception of preparation to research and write a dissertation, roughly onefifth of the respondents appraise their educations as having prepared them neither well nor poorlyin each of the areas evaluated.v
Doctoral Alumni Survey Report, 2001Survey Research Center, University of ArkansasApproximately 16 of the respondents (7%) had taken at least one class via non-traditionalteaching methods. Of the seven methods listed, the one used most commonly was interactiveone-way compressed video. About 75% viewed these methods as either effective or extremelyeffective.The largest and approximately equally-sized percentages of the doctoral alumni hadassisted in research or teaching during their graduate studies. Fellowships and traineeshipssupported smaller percentages of these alumni. More than 90 percent of the respondentsconsider their experience in a teaching assistantship to have been good or excellent. Of those forwhom some form of graduate studies-supported employment is applicable, at least 80 percentconsider their research assistantship or combined teaching and research assistantship to haveprovided a good or excellent experience. Roughly three-quarters considered their traineeship tohave been good or excellent.At least 84 percent of the respondents consider the knowledge and availability of theirdissertation director and committee members, and quality of advising to have been good orexcellent. The two next most praised aspects of the dissertation process concern the overall levelof learning about research and overall assessment of the dissertation process. At least 86 percentrate the quality of advising during the dissertation process as good or excellent. However, only56 percent of the responding doctoral alumni contend that the financial support for dissertationresearch was good or excellent. More than one-fifth of the group evaluate this aspect of thedoctoral experience as having been either poor or very poor.At least 85 percent consider the admissions processes for the Graduate School andspecific doctoral programs to have been good or excellent. Slightly higher percentages ofrespondents relay positive feedback about their department’s versus the Graduate School’sadmission processes.Eighty percent or more of the responding doctoral alumni classify the quality ofinstruction within their department or program, in other departments or programs, or in otheracademic colleges as having been good or excellent. The alumni deemed the quality ofinstruction within their own department or program as slightly better than in other departments oracademic colleges. Respondents evaluate the instruction in other academic colleges higher thaninstruction in other departments or programs.Eighty percent of the respondents insist that the depth of their courses was excellent orgood. The availability of professors and the interest those professors showed in the alumni’sprofessional development is reckoned excellent or good by more than four-fifths of therespondents.While about 83 percent of the respondents assert that the quality of advising theyreceived was good or excellent, 78 percent consider the quality of mentoring to be strong. Thisindicates that alumni feel that they were well directed in terms of recommended coursework andprogram requirements, but some experienced a lack in terms of longer term career development.The UA catalog information and UA library are considered to have been good orexcellent by about 73 and 86 percent of the respondents, respectively.When asked to justify considering a course most valuable, the majority of the respondingdoctoral alumni explain their choices based on a course’s usefulness in job performance in acurrent position, practical application, development of research skills, and/or training in currenttrends in particular fields. Courses in research, statistics, and experimentation are described asthe most valuable due to their applicability in the real world, which indicates a propensity for alarge group of UA alumni to choose careers involving research. Other courses are consideredvaluable for their usefulness in teaching and research, perspectives on learning, training to writevi
Doctoral Alumni Survey Report, 2001Survey Research Center, University of Arkansasand read critically, and volume of new information gained. Preferred content-related coursesvary by the program.The most common explanation for listing a particular course as least valuable is poorinstruction, poor instructor, or some combination of the two, enumerated by criticisms ofprofessorial styles and teaching methods. Outdated information, inapplicability in a currentposition, previous instruction in the area, or incomplete levels of instruction are also among otherjustifications for listing a course as least valuable. A group of the respondents considersstatistics courses least valuable because of lack of applicability. The large fraction ofrespondents who consider similar courses most valuable can be explained by the alumni’sdisparate career paths that require greater or lesser degrees of training in statistics, research, andexperimentation. Disorganization, lack of structure, and too much or too little emphasis ontechnology and in some cases, lack of technology, reflect other respondents’ complaints.Sixteen percent (n 35) of the alumni contend that zero to 50 percent of the courses theytook offered the level of learning they would expect in a doctoral level course. For 12 percent,60 to 71 percent of their courses were of doctoral caliber. One third of the alumni assert that 75to 88 percent of their coursework offered them a doctoral level learning experience; and 39percent categorized 90 to 100 percent of their courses similarly.According to 14 percent of the alumni, zero to 35 percent of their courses offered thelevel of professional preparation they would expect in a doctoral level course. For another 16percent, 40 to 60 percent of their courses did. Two-thirds assert that 70 percent or more of theircourses offered the level of professional preparation they would expect in a doctoral level course.Teaching and/or research assistantships provided the primary support for the largestgroup of the responding doctoral alumni. Other sources of income include: loans, personalsources of income or savings, grants, fellowships and scholarships, and employerreimbursement or assistance.Nearly half of the responding doctoral alumni report annual earnings of 55,000 or less;13 percent, 55,001 to 65,000; 9 percent, 65,001 to 75,000; 14 percent, 75,001 to 85,000;and 13 percent, 85,001 or more per year.Nearly one-half report owing no debt and forty percent owe between 2,500 and 50,000in educational debts from both undergraduate and graduate study. Of the debt incurred throughundergraduate and graduate education, more than three-quarters of the responding doctoralalumni attribute one half or more than half of this debt to doctoral study.Eighty-five percent of the responding doctoral alumni describe themselves as satisfied orvery satisfied with their current career. Almost half of the responding alumni have beenpromoted since completing their dissertations. The alumni boast several patents, researchawards, and an array of recognitions, publications, and federal and private grants.Suggested program improvements focus on an increase in financial and researchresources, as well as increasing the comparative prestige and reputation of UA doctoral programsamong other institutions. Other recommendations include: more advanced and wider selectionof classes, more in-depth instruction, more direct field experience, higher academic standards,and the inclusion of alternative teaching methods. Other respondents promote stability,professionalism, and cooperation among professors, as well as improving departmentalleadership and career mentoring.Eighty-one percent of the respondents contend that, if they had it to do again, they wouldattend the U of A for their doctorate. Reasons given by alumni include: quality of particularprograms, high quality of research and coursework, affordable education, location, loyalty to theU of A, and working with particular faculty. Nineteen percent state that they would not attendthe U of A if they had the choice to repeat their doctoral work. Justifications for this stancevii
Doctoral Alumni Survey Report, 2001Survey Research Center, University of Arkansasinclude: lack of research experience offered, opportunity for a broader experience andknowledge base from out-of-state institutions or other institutions that are leaders in their field’sresearch, lack of professors with strong reputations, disparate research interests between facultyand students, and the desire to attend a school with better reputation or credentials.Eighty percent of the alumni affirmed their original choice of department of study.Among the reasons offered by respondents are: strong departmental programs, good advisors,flexibility or versatility of degree, and prior interest in the topic. Twenty percent of theresponding doctoral alumni contend that, if given the opportunity, they would pursue a differentfield of study. Justifications for this include: lack of research opportunities at the U of A,deficient reputation among other institutions, limited career opportunities, interest in other fieldsof work. Faculty, poor administration, lack of advanced courses, and poor job market are otherreasons they would choose different academic paths if they had their doctoral work to repeat.Some would specialize in a different aspect of their current field.viii
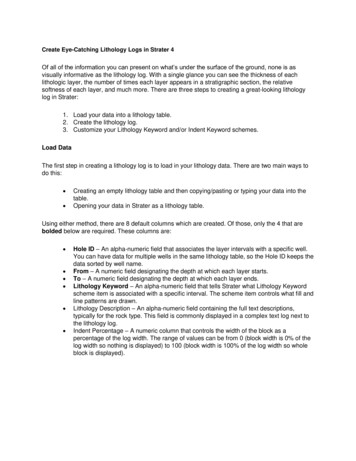
Doctoral Alumni Survey Report, 2001Survey Research Center, University of ArkansasUNIVERSITY OF ARKANSASGRADUATE SCHOOLSURVEY OF DOCTORAL ALUMNIINTRODUCTIONThe University of Arkansas’ Graduate School and Colleges of Agricultural, Food andLife Sciences, Arts and Sciences, Business Administration, Education and Health Professions,and Engineering surveyed doctoral alumni. Surveys were sent to all doctoral alumni for whomaddresses were available from the classes of 1996 through 2000 during July and August of 2001.Of the 461 surveyed, 226 responded (46 percent). The survey is part of a self-assessment thatthe Graduate School will use to review and revise internal goals, withintheGraduateSchool,aswell as to identify strengths and weaknesses within individual programs and the overalldissertationprocesses of doctoral education. The Colleges can use the information to assess theirgraduate programs as well.DESCRIPTION OF GRADUATESDemographic information and statistics of the doctoral alumni who responded to this mailsurvey are reported in Table 1. Among the 213 respondents who graduated from the Universityof Arkansas with a Ph.D. or an Ed.D. between 1996 and 2000, all but three received their degreein ten years or fewerless. The largest group, 27 percent (n 56), graduated in four years. Amongthe remaining graduates, 21 (n 49) and 24 (n 43) percent required five and three yearsrespectively. Twenty (9.7 percent) students each took six or seven years, and one studentgraduated after 25 years of study (Table 1).Thirty-nine Seventynine(38percent) of the responding graduates are female, and 12961percent, male. In two separate questions the respondents were asked to identify first anyHispanic, Latino, or Spanish cultural origins, and secondly an ethnic group with which theyidentify. In terms of cultural background, five of the 206 respondents consider themselves to beof Hispanic, Latino, or Spanish origin (Table 1). Eleven percent (n 23) are Asian American;,five percent (n 11) are American Indian or Alaskan Native. Nine (4.3%) of the 206 respondentsreport being black or African, and the remaining 76 percent, white. Responding doctoral alumnirange in age from 26 to 66 years. Their average age is 42 years (Table 1).About one-half of the doctoral alumni were in-state residents at the outset of theirdoctoral work (Table 1). Twenty percent were from Arkansas. Another 61 percent of the alumniare from a state in the USA other than Arkansas. Citizens of other countries comprise 19 percentof the responding alumni. They are listed by continent in Table 1.Table 1Demographic Characteristics of Doctoral Alumni .421.7.5Years Spent in Study at theU of A1 year2years2.5 years3 years3.5 years4 years4.3 years1MeanMedian
Doctoral Alumni Survey Report, 2001Survey Research Center, University of Arkansas4.5 years5 years5.5 years6 years6.5 years7 years8 years9 years10 years14 years16 years25 al1358622161.138.9100.0Are You Hispanic, Latino,or of Spanish 5.12.7100.0Age26-2930-3940-4941 to 66Total59268412062.444.733.019.9100.0Residency at the beginningof doctoral .0Continent of originAsia (incl. Lebanon,Turkey)AfricaCentral & South America294213.71.90.9EthnicityAmerican Indian orAlaskan NativeAsian AmericanBlack or AfricanNative Hawaiian or OtherPacific IslanderWhiteOtherTotalMeanMedian4.7644.041.8241
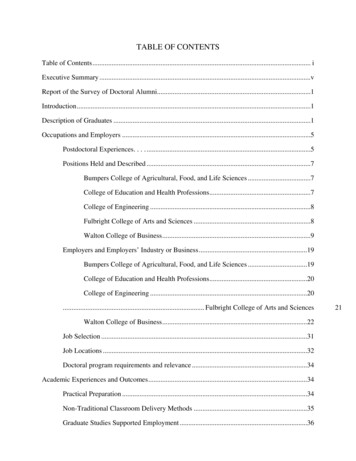
Doctoral Alumni Survey Report, 2001Survey Research Center, University of ArkansasFrequencyEurope4Percent1.9North America(Not inTable 2 displays aredata about the educational specializations pursued byrespondents while at the University of Arkansas. More than three-fourths of the respondinggraduates received a Ph.D. at the conclusion of their studies. The remaining 55 (24.3%)respondents obtained an Ed.D. All but one graduated between 1996 and 2000. About one-fifthof the respondents graduated in each of the years 1996 and 1998; approximately one-fourth in1997; 16 percent in 1999 and 15 percent in 2000 (Table 2).Respondents had earned their degrees in 30 of the 37 doctoral programs at the U of A(Table 2). The most highly represented eare Business Administration (12%, n 25), and AdultEducation (9%, n 19),. Chemistry (6%, n 12) and Educational Administration (7%, n dents.Ten or fewer alumni completeddoctorates in each of the remaining departments. In addition, nine (4%) of the respondentsindicated that they had studied in a second program and four (1.7%) in a third. These are listedin Table 2 as the second and third programs.Table 2Educational DemographicsFrequencyIndicate Highest DegreeEarned at the U of A.Ed.D.55Ph.D.171Total226Year of 3AFirstProgramIn which Degree program Frequencydid you earn your doctorate? (Percent)20Adult Education(8.8)11Agronomy(4.9)5Animal cent)0(0)0(0)0(0)Median
Doctoral Alumni Survey Report, 2001Survey Research Center, University of ArkansasBiologyFrequency8(3.5)Biological & Agricultural 0(0.0)Engineering25Business Administration(11.1)13Chemistry(5.8)4(1.8)Chemical Engineering2Civil Engineering(.9)3Comparative Literature(1.3)0Computer Science(0)ComputerSystems 0(0)Engineering5Counselor Education(2.2)7Curriculum & Instruction )4Electrical ironmental Dynamics (0)0Food Science(0)6Health Science(2.7)9Higher )0(0)0(0)0(0)0(0)0(0)0(0)4Median
Doctoral Alumni Survey Report, 2001Survey Research Center, University of ArkansasIndustrial EngineeringKinesiologyMathematicsMechanical hilosophyPhysicsPlant SciencePoultry SciencePsychologyPublic PolicyRecreationRehabilitationVocational )0(0)4(100.0)MedianOCCUPATIONS AND EMPLOYERSThe doctoral alumni were asked a series of questions to assess the typee of work in whichthey are have been engaged insubsequent to their doctoral graduation. Information about theirposition, job description, employer, employer’s industry, as well as relevance and r
and Engineering surveyed doctoral alumni to gain their assessments of their doctoral programs. Surveys were sent to all doctoral alumni for whom addresses were available from the classes of 1996 through 2000 during the summer of 2001. Of the 461 surveyed, 226 responded (46 percent). Forty-six percent of the doctoral alumni who graduated between .