Transcription
Equity Performance AttributionMethodologyMorningstar Methodology PaperMarch 16, 2009 2009 Morningstar, Inc. All rights reserved. The information in this document is the property of Morningstar, Inc.Reproduction or transcription by any means, in whole or in part, without the prior written consent of Morningstar, Inc., is prohibited.
ContentsIntroduction4Overview4Effects versus Components5Review of the Classic Approach – Brinson, Hood, and Beebower6Review of Attribution Components – Brinson and Fachler9Top-Down versus Bottom-Up Approach10Arithmetic versus Geometric Attribution11Example11Note11Basic Mathematical Expressions12Formulas12Explanation of Formulas13Special Situation I: Groups without Holdings14Special Situation II: Short Positions14Top-Down Approach for Single Period15Overview15Arithmetic Method16Geometric Method19Example20Bottom-Up Approach for Single Period24Overview24Arithmetic Method24Geometric Method26Three-Factor Approach for Single Period28Overview28Arithmetic Method29Geometric Method32Multiple-Period Analysis34Overview34Multi-Period Geometric Method34Multi-Period Arithmetic Method36Appendix A: Return Gap39Overview39Top-Down Approach, Arithmetic Method39Top-Down Approach, Geometric Method40Multi-Period Geometric Return Gaps41 2009 Morningstar, Inc. All rights reserved. The information in this document is the property of Morningstar, Inc. Reproduction or transcription by any means,in whole or part, without the prior written consent of Morningstar, Inc., is prohibited.2
Contents (continued)Version HistoryMarch 2009Updated for the addition of the three-factor model.December 2008Original version. 2009 Morningstar, Inc. All rights reserved. The information in this document is the property of Morningstar, Inc. Reproduction or transcription by any means,in whole or part, without the prior written consent of Morningstar, Inc., is prohibited.3
IntroductionOverviewPerformance attribution analysis consists of comparing a portfolio’s performance to that of abenchmark and decomposing the excess return into pieces to explain the impact of variousportfolio management decisions. This excess return is the Active Return. For a portfoliodenominated in the investor’s home-currency, the investment manager’s active return isdecomposed into Weighting Effect, Selection Effect, Interaction and Return Gap. Weightingeffect refers to the portion of an investment manager’s value-add attributable to the manager'sdecision on how much to allocate to each market sector, in other words, a manager’s decisionto overweight and underweight certain sectors compared to the benchmark. Selection effectrepresents the portion of performance attributable to the manager’s stock picking skill.Interaction, as its name suggests, is the interaction between the weighting and the sectioneffects, and it does not represent an explicit decision of the investment manager. Return gap isthe portion of the return that cannot be explained by the holdings composition at the beginningof the analysis period, and this gap is usually caused by intra-period portfolio transactions,security corporate actions, etc. Attribution analysis focuses primarily on the explainable part ofthe active return — the weighting, selection, and interaction. Return Gap is discussed inAppendix A of this document.This document first reviews the classic attribution approaches of Brinson, Hood, and Beebower(BHB) and Brinson and Fachler (BF), the principles upon which today's performance attributionmethodologies are founded. The next section presents three attribution approaches which aretop-down, bottom-up and three-factor. In addition, each of these three approaches can beimplemented using the arithmetic or the geometric method. These six combinations and theiruses are described in details in the subsequent sections, followed by how these attributionresults can be accumulated in a multi-period analysis. Although multiple alternatives arepresented in this document, the recommended method of Morningstar is the top-downgeometric method. The top-down approach presents a uniform framework for comparingmultiple investment managers, and the geometric method has the merit of theoretical andmathematical soundness. This document focuses on equity attribution performed in theportfolio's base currency, and topics such as fixed income, currency, and transactions costsattribution analyses are outside of the scope of this document. 2009 Morningstar, Inc. All rights reserved. The information in this document is the property of Morningstar, Inc. Reproduction or transcription by any means,in whole or part, without the prior written consent of Morningstar, Inc., is prohibited.4
Introduction (continued)Effects versus ComponentsWhen performing attribution analysis, it is important to distinguish between Effects andComponents. An Effect measures the impact of a particular investment decision. An Effect canbe broken down into several Components that provide insight on each piece of an overalldecision, but each piece in isolation cannot represent the investment manager's decision. Forexample, an investment manager may make an active decision on sector weighting byoverweighting certain sectors and underweighting other sectors. Since overweighting certainsectors necessitates underweighting others and vice versa, the decision is on the entire set ofsector weights. To better understand the sector weighting effect, one may examinecontributions of individual sectors. These contributions are simply Components that provideadditional insight. However, each of these contributions cannot be used in isolation to measurethe impact of a decision, as it is not meaningful to say that an investment manager made aparticular decision to time exposure to the Service sector, for example. 2009 Morningstar, Inc. All rights reserved. The information in this document is the property of Morningstar, Inc. Reproduction or transcription by any means,in whole or part, without the prior written consent of Morningstar, Inc., is prohibited.5
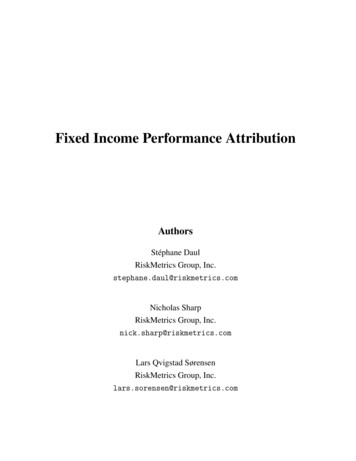
Introduction (continued)Review of the Classic Approach — Brinson, Hood, and BeebowerToday's approaches to performance attribution are founded on the principles presented in anarticle1 written by Brinson, Hood, and Beebower (BHB) and published in 1986. Therefore, it isimportant to review the BHB model even though the model in its original form is not adopted.The study is based on the concept that a portfolio's return consists of the combination of group(e.g. asset class) weights and returns, and decision making is observed when weights orreturns of the portfolio vary from those of the benchmark. Thus, notional portfolios can be builtby combining active or passive group weights and returns to illustrate the value-add from eachdecision.The study deconstructs the value-added return of the portfolio into three parts: tactical assetallocation, stock selection, and interaction. The formulas for these terms are defined below:Tactical Asset AllocationStock SelectionInteractionTotal Value Added II - IIII - IIV - III - II IIV - I (w w ) R w (R R ) (w w ) ( R R w R w RPjBjPjPjBjPjBjPjBjBjBjPjBjBj)These formulas are based on four notional portfolios. These notional portfolios are constructedby combining different weights and returns, and they are illustrated in the chart below:1Brinson, Gary P., L. Randolph Hood, and Gilbert L. Beebower, "Determinants of Portfolio Performance,"Financial Analysts Journal, July-August 1986, pp. 39-44. 2009 Morningstar, Inc. All rights reserved. The information in this document is the property of Morningstar, Inc. Reproduction or transcription by any means,in whole or part, without the prior written consent of Morningstar, Inc., is prohibited.6
Introduction (continued)Where:w Bjw PjR BjR Pj The benchmark's weight for group The portfolio's weight for group The benchmark's return for group The portfolio's return for groupjjjjThe tactical asset allocation effect, also known as the weighting effect, is the difference inreturns between the notional portfolios II and I. Notional portfolio II represents a hypotheticaltactical asset allocator that focuses on how much to allocate to each group (e.g. asset class)but purchases index products for lack of opinions on which stocks would perform better thanothers. Notional portfolio I is the benchmark which, by definition, has passive group weightsand returns. These two notional portfolios share the same passive group returns but havedifferent weights; thus, the concept intuitively defines the weighting effect as the result ofactive weighting decision and passive stock selection decision.The stock selection effect, also known as the selection effect, is the difference in returnsbetween the notional portfolios III and I. Notional portfolio III represents a hypothetical securitypicker that focuses on picking the right securities within each group but mimics how muchmoney the benchmark allocates to each group because the person is agnostic on which groupswould perform better. As described above, notional portfolio I is the benchmark which haspassive group weights and returns. These two notional portfolios share the same passive groupweights but have different group returns; thus, the concept intuitively defines the selectioneffect as the result of passive weighting decision and active stock selection decision.While the weighting and the selection effects are intuitive, the interaction portion is not easilyunderstood. The interaction term, as its name suggests, is the interaction between theweighting and the section effects, and it does not represent an explicit decision of theinvestment manager. Due to its apparent lack of meaning, Morningstar believes that it is abetter practice to incorporate it into either the weighting or the selection effect, whichever ofthe two that represents the secondary decision of the investment manager. The concept ofprimary versus secondary decision is discussed in more details in the next section of thisdocument. 2009 Morningstar, Inc. All rights reserved. The information in this document is the property of Morningstar, Inc. Reproduction or transcription by any means,in whole or part, without the prior written consent of Morningstar, Inc., is prohibited.7
Introduction (continued)The Morningstar methodology for equity performance attribution is founded on the principles ofthe BHB study, but the BHB model in its original form is not adopted. First, the BHB model is anasset class level model and does not break down attribution Effects into group levelComponents. The next section presents the Brinson and Fachler model, this method addressesgroup level Components. Furthermore, much has evolved in the field of performance attributionsince the BHB study. Methodologies are needed to incorporate the interaction term into theother two effects, accommodate for multiple hierarchical weighting decisions, perform multiperiod analysis, etc. These topics are addressed in the subsequent sections of this document. 2009 Morningstar, Inc. All rights reserved. The information in this document is the property of Morningstar, Inc. Reproduction or transcription by any means,in whole or part, without the prior written consent of Morningstar, Inc., is prohibited.8
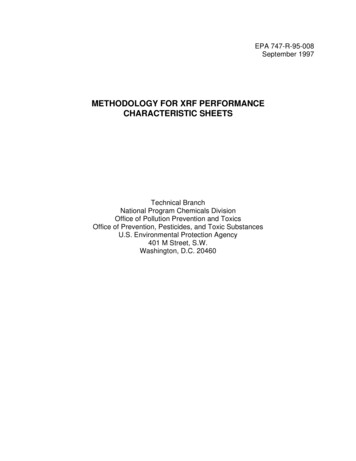
Introduction (continued)Review of Attribution Components — Brinson and FachlerThe BHB model presented in the previous section shows how attribution Effects are calculated.As discussed in the Effects versus Components section of this document, an Effect can bebroken down into several Components. Today's approaches to Component level attribution arebased on concepts presented in a study2 by Brinson and Fachler (BF) in 1985. In this article, theimpact of weighting decision for a particular group j is defined as ( w Pj w Bj ) ( R Bj R B ) .The ( w Pj w Bj ) portion of this formula is the same as the equation for the tactical assetallocation effect in the BHB study. It is the difference between the portfolio's weight in thisparticular group and the benchmark's weight in the same group, representing the investmentmanager's weighting decision. In the BHB model, the ( w Pj w Bj ) portion is multiplied by thebenchmark's total return. This basic principle is preserved in the BF model as the latter alsouses the benchmark return. However, in order to gain insight into each group's value-add, theterm is transformed into the return differential between the group in question and the totalreturn. Thus, this term intuitively illustrates that a group is good if it outperforms the total. Thisformula is not in conflict with the BHB model because their results match at the portfolio level,in other words, the sum of BF results from all groups equals the BHB tactical asset allocationeffect.With the two multiplicative terms of the formula combined, the BF formula illustrates that it isgood to overweight a group that has outperformed and underweight a group that hasunderperformed. This is because overweight produces a positive number in the first term of theformula, and outperformance yields a positive number in the second term, leading to a positiveattribution result. Similarly, a negative weighting differential of an underweight combined with anegative return differential of an underperformance produces a positive attribution result.Furthermore, it is bad to overweight a group that has underperformed and underweight a groupthat has outperformed because these combinations produce negative results. This concept isillustrated in the chart below:2Brinson, Gary P., and Nimrod Fachler, "Measuring Non-US Equity Portfolio Performance," Journal ofPortfolio Management, Spring 1985, pp.73-76. 2009 Morningstar, Inc. All rights reserved. The information in this document is the property of Morningstar, Inc. Reproduction or transcription by any means,in whole or part, without the prior written consent of Morningstar, Inc., is prohibited.9
Introduction (continued)Top-Down versus Bottom-Up ApproachThere are several approaches to performance attribution, and we focus on two of them — topdown and bottom-up. These are two-factor models, decomposing Active Return into WeightingEffect and Selection Effect. In addition, we present the three-factor model in this document asan alternative to these two approaches. In a three-factor model, the Active Return isdeconstructed into three components, displaying the BHB Interaction term as the third factor.The choice between the top-down and the bottom-up approaches depends on the investmentdecision process of the portfolio being analyzed, and the three-factor model takes an agnosticview in the order of the investment decision process.The top-down approach to portfolio attribution is most appropriately used when analyzing aninvestment manager with a top-down investment process that focuses on one or multipleweighting allocation decisions prior to security selection. In this decision making process, theWeighting Effect is primary, and the Selection Effect is secondary. As discussed in the BHBsection above, the interaction term of the BHB approach is incorporated in the effect of thesecondary decision which is the Selection Effect in this case.The bottom-up approach is most relevant in analyzing an investment manager with a bottom-upprocess that emphasizes security selection. In this decision making process, the SelectionEffect is primary, and the Weighting Effect is secondary. Unlike the top-down approach whichcan measure the effects of multiple weighting allocation decisions, there is only weightingeffect in the bottom-up approach. As discussed in the BHB section above, the interaction termof the BHB approach is included in the effect of the secondary decision which is the WeightingEffect in this case.Both the top-down and the bottom-up approaches involve hierarchical decision. For example, inthe case of a top-down analysis, an investment manager may first decide on regionalweighting, followed by sector weighting and market capitalization weighting, before makingsecurity selections. The analysis is hierarchical because weighting at each decision level isanchored upon the weighting of the prior decision. Similarly, in a bottom-up analysis, aninvestment manager first decides on security selection before making a weighting decisionsuch as sector weighting. 2009 Morningstar, Inc. All rights reserved. The information in this document is the property of Morningstar, Inc. Reproduction or transcription by any means,in whole or part, without the prior written consent of Morningstar, Inc., is prohibited.10
Introduction (Continued)Arithmetic versus Geometric AttributionSince attribution effects are the results of the portfolio's relative weighting and performance tothose of the benchmark, the return comparison can be performed using arithmetic or geometricmethod. The arithmetic method refers to simple subtractions of return terms in formulas and isvery intuitive; however, it works best in a single-period analysis, and additional "smoothing" isrequired to apply it in a multi-period setting. Refer to the Multiple Period Analysis section of thisdocument for details. The geometric method takes a geometric difference by translating returnsinto "return relatives" (that is, one plus the return), performing a division of the two returnrelatives, and subtracting one from the result. It is more complicated than the arithmeticmethod, but it has the benefit of being theoretically sound for both single-period and multiperiod analyses when applied to Effect statistics.ExampleSince the top-down approach is more complex, as it may involve a hierarchy of weightingdecisions, it is more helpful to provide an example that illustrates this process throughout thedocument. Let us assume a simple example where the investment process consists of decisionmaking in the following order:Decision Level DecisionChoice1Regional weightingAsia versus Europe2Sector weightingService versus Non-Service3Market capitalization weightingLarge Cap versus Small Cap4Security selectionNote All formulas assume that the individual constituents and the results are expressed indecimal format. For example, the number 0.15 represents fifteen percent. 2009 Morningstar, Inc. All rights reserved. The information in this document is the property of Morningstar, Inc. Reproduction or transcription by any means,in whole or part, without the prior written consent of Morningstar, Inc., is prohibited.11
Basic Mathematical ExpressionsFormulasSince attribution formulas use many mathematical expressions in common, these mathematicalexpressions and their formulas are defined in this section and are used throughout thedocument.[1] benchmark weight of stock g wØB wgB wB hB h Ω g wØ[2] portfolio weight of stock g wØP Pwg wP hP h Ω g wØ[3] return on stock g if g M whB RhBRgB h Ω gif g M wgB [4] return on stock g if g M whP RhPRgP h Ω gif g M wgP if g Mif g Mif g Mif g MWhere:wgBw gPRgBRgPggMΩgØ The benchmark's weight for group The portfolio's weight for groupg gThe benchmark's return for group gThe portfolio's return for group g The vector that denotes the group The number of elements in the vector The level that represents the security level, that is, the last grouping hierarchy All of the sub-groups within the group The total level, which is the equity portion of the portfolio or benchmark g , representing the hierarchy level of the groupgthat are one hierarchy level below 2009 Morningstar, Inc. All rights reserved. The information in this document is the property of Morningstar, Inc. Reproduction or transcription by any means,in whole or part, without the prior written consent of Morningstar, Inc., is prohibited.12
Basic Mathematical Expressions (continued)Explanation of FormulasA group represents a basket of securities classified by the end-user, e.g. economic sector,market cap, P/E, region, country, etc. Gro
mathematical soundness. This document focuses on equity attribution performed in the portfolio's base currency, and topics such as fixed income, currency, and transactions costs attribution