Transcription
MCDS User’s GuideRelease 02.2022MANUAL
MCDS User’s GuideTRACE32 Online HelpTRACE32 DirectoryTRACE32 IndexTRACE32 Documents . ICD In-Circuit Debugger . Processor Architecture Manuals . TriCore . MCDS User's Guide .1Introduction .7Intended Audience7How to read this Document7Related Documents8Background Information .9Trace Source9Program Trace9Trace Sink10Trace Filter and Trigger10The Emulation Device Concept11TRACE32 Support for Emulation Devices .13Feature Overview13Target Interface13MCDS Licensing14MCDS Basic Features .16MCDS Concept16MCDS of XC2000ED and C16616MCDS of TriCore16MCDS Configuration17General Settings18Timestamp Setup18Trace Buffer Configuration19AGBT Off-chip Trace Configuration19Trace Sources19Example: Core Trace on TriCore AURIX20Example: Bus Trace on TriCore AUDO-MAX21Trace Control22Trace States 1989-2022 Lauterbach22MCDS User’s Guide 2
Trace Buffer Size and Usage23Trace Modes23Trace Trigger Configuration23Other Trace Configuration Commands24Basic Trace Usage24Trigger and Filter via Break.Set command25Trace Filter26Examples26Watchpoints30Example31Trace Decoding32Bus Trace Information34Searching the Trace35Specific Cycles35Special Events36Exception Decoding36Exception Decoding Using Tables37Exception Decoding Using DCU Messages37Trace Limitations and Restrictions38MCDS Unlocking39MCDS Special Features .40Benchmark Counters40Counting Chip-internal Signals41Example41Counting User-defined Events41Example41Example: Record BMC Counters in the Trace43Trace Through Resets and Power Cycles45Soft Resets45Hard Resets45Power Cycles45Reset Marker46Special Trace Sources via OTGM46Peripheral Trace48Example: Peripheral Trace for DMA of TC277TE49Trace Evaluation50Signal Options52Tracing the GTM53Example: GTM trace of TC265DE54miniMCDS60Known Issues and Recommendations61Clock System .62EEC Clock System 1989-2022 Lauterbach62MCDS User’s Guide 3
Maximum Clock Frequency63Allowed Clock Ratios63Verifying the Clock Setup63Device Specific Details64XC2000ED and C16664TriCore AUDO-NG (TC v1.3)65TriCore AUDO-F, AUDO-S and AUDO-MAX (TC v1.3.1)65TriCore AUDO-MAX (TC v1.6)66TriCore AURIX (TC v1.6.1)66MCDS Clock System67MCDS Sampling67MCDS Timestamps67Clock Counters68Timestamp Configuration68Timestamp Decoding69Periodic Trigger69MCDS Clock Configuration70Automatic Configuration with the CLOCK Commands70Manual Configuration71Deprecated Configuration72Emulation Memory .73Background Information73EMEM Partitioning74Memory Arrays and Tiles74Trace Buffer Configuration75GUI Integration76PRACTICE Functions77Co-operation with Third-party Usage77Configuration Example78Device Specific Details79TriCore AUDO-NG79TriCore AUDO-F79TriCore AUDO-S and AUDO-MAX80TriCore AURIX80AGBT High-speed Serial Trace .81Background Information81Xilinx Aurora82Requirements82TriCore Chip Requirements82Target Board Requirements83TRACE32 Requirements84AGBT Configuration87Trace Streaming88 1989-2022 LauterbachMCDS User’s Guide 4
Limitations and Restrictions88Advanced Emulation Device Access .90EEC Access90EEC EMEM Access91EEC Register Access91Impact of Direct EEC Access92Guarded MCDS Programming92Timestamp Usage93Trigger Program Example93Example Scripts95Known Issues and Application Hints .96Missing Instructions96Invalid Program Trace at the Beginning of the Trace Recording96No Trace Content Displayed96FIFOFULL error97Concurrent Usage of Different Trace Methods97PCP Channel ID98Workaround for the TASKING PCP C/C Compiler98Glossary .99Infineon Glossary99Lauterbach Glossary 1989-2022 Lauterbach100MCDS User’s Guide 5
MCDS User’s GuideVersion 09-Mar-2022 1989-2022 LauterbachMCDS User’s Guide 6
IntroductionThe MCDS (Multi-Core Debug Solution) is an on-chip trigger and trace solution from Infineon, available forthe Infineon TriCore and C166/ XC2000 devices. It is used during the development stage of an embeddedsystem for debugging, tracing, profiling, and verification.Using TRACE32, the user can set up the MCDS for performing on- and off-chip trace. Based on thegenerated trace recording, the user can analyze, profile, and verify the behavior of his application.Additionally, it is possible to program triggers for stopping program execution, redirecting them to device pinsor to influence the trace recording, e.g. for recording only the trace data of interest.The on-chip memory used for storing the trace data can also be used for calibration, a technique that allowsthe dynamic overlay of code and data memory with alternate code or parameters. Calibration is notsupported by Lauterbach tools. TRACE32 can be configured to cooperate with third-party tools to shareresources, e.g. the on-chip memory.For using these features, a special version of the chip is required, the Emulation Device. But also some ofthe Product Devices include the MCDS or at least a reduced variant of the MCDS, the so-called Mini-MCDS.For related information, refer to the documentation of your device.This MCDS User’s Guide is intended to guide the TRACE32 user through the configuration of the on-chiptrace, trigger and filter setup. Additionally it provides background knowledge. This User’s Guide is notintended to replace the available training manuals or the TRACE32 command references.Intended AudienceThe reader of this document is assumed to have basic knowledge in using TRACE32 and has gatheredexperience using it. Additionally specific knowledge of the architecture and the device is mandatory, see theInfineon documentation. The MCDS User’s Guide is not a replacement for the Infineon documentation of theEmulation Devices.How to read this DocumentIt is recommended to completely read the chapters Background Information and MCDS Basic Featuresbefore reading the other ones. Developers responsible for the PLL setup are expected to read the EECClock System chapter to understand why the application should program the EEC clocks.It is not necessary to read this documentation completely for using the MCDS. This User’s Guide isseparated into independent chapters handling different topics. These chapters can be read independentlyand in arbitrary order. Reading the first paragraph of a chapter gives the reader all the information to decidewhether it is important for his use case or not.Some of the TRACE32 features require a deeper understanding of the MCDS and the Emulation Deviceimplementation. The related parts and chapters of this User’s Guide are indicated to be for MCDS ExpertUsers only. 1989-2022 LauterbachMCDS User’s Guide 7
The MCDS on TriCore chips does not only support the TriCore cores, it also supports the PCP and the GTM.When referring to TriCore in general, the entire TriCore device is addressed. This includes the TriCore coresas well as the PCP or GTM cores.From the user’s point of view the MCDS implementation for C166 and XC2000 devices is identical. Withinthis document there is no differentiation between C166 and XC2000.Related DocumentsBefore using the MCDS it is mandatory to know the architecture under debug. The most importantinformation about the device can be found in the Infineon Documentation: User’s Manual and/or Target Specification Emulation Device Target Specification (for MCDS Expert Users) Data-, Delta- and Errata SheetsPlease contact Infineon for this documentation.This document assumes that the reader already knows how to use the TRACE32 debugger for thecorresponding device. The related information can be found in the Processor Architecture Manuals: “TriCore Debugger and Trace” (debugger tricore.pdf) “PCP Debugger Reference” (debugger pcp.pdf) “GTM Debugger and Trace” (debugger gtm.pdf) “XC2000/XC16x/C166CBC Debugger” (debugger 166cbc.pdf)For TriCore AURIX there is a trace training manual: “AURIX Trace Training” (training aurix trace.pdf)Detailed information about the commands can be found in the General Commands Reference Guides.For information about the MCDS commands, refer to the MCDS command group: “General Commands Reference Guide M” (general ref m.pdf) 1989-2022 LauterbachMCDS User’s Guide 8
Background InformationThis chapter gives an overview of the related terms and definitions. To provide the necessary backgroundinformation it explains the Emulation Device concept and introduces the MCDS and its components.It is highly recommended that every MCDS user reads this chapter prior to any other.The Glossary at the end of this User’s Guide provides a description of the most important terms andabbreviations.Trace SourceA trace source is a chip component that generates one or more types of trace data. For example, a coreprovides information about the executed instructions (program trace) or data accesses (data trace). A busprovides information about the bus transactions (data trace). Other information may be the ownership, achannel ID or status information.Each trace type within a trace source can be enabled separately. So it is possible to record only the dataaccesses to a variable without the corresponding program flow.Program TraceProgram trace can be recorded using different strategies, depending on the use case: Flow TraceA flow trace records the entire program flow, including all instructions. A trace message is onlygenerated in case the sequential execution of instructions is broken, e.g. in case of a jump orbranch instruction, a call or return or an exception. This reduces trace buffer consumption. Sync TraceA sync trace generates a trace message on every MCDS clock cycle. Depending on fCPU:fMCDSand the architecture (super-scalar or not) not all instructions will generate a dedicated tracemessage. This consumes much more trace buffer, but higher accuracy is achieved fortimestamps and event assignment. Compact Function Trace (CFT)The Compact Function Trace only generates trace messages on call and return instructions. Allintermediate jump instructions are omitted. In case the compiler uses regular jump instructionsfor function entry and exit (jump-linked functions) these function calls and exits are also notrecorded. Additionally very small functions can be omitted from recording.As timestamp information is only generated for a trace message, not all instructions have their owntimestamp information. The most accurate timing information is possible for the sync trace. 1989-2022 LauterbachMCDS User’s Guide 9
Trace SinkThe trace data generated by the trace sources are recorded by a trace sink. Depending on where thisinformation is stored, the technology for recording the data is called on-chip trace or off-chip trace. Off-chip TraceMicrocontroller chips implementing an off-chip trace provide the trace data continuously via portpins. An external tool, e.g. the PowerTrace II, constantly records this information in a huge tracememory where it can be accessed for display and analysis purposes.The off-chip trace is controlled using the Analyzer command group. On-chip TraceMicrocontroller devices implementing an on-chip trace store the trace data in a memory locatedon the SoC instead of transferring it directly to an external tool. The trace buffer is later read bythe tool. An on-chip trace buffer is usually much smaller than the trace buffer of an off-chip tracesolution. A common size is 4 KB, TriCore devices have up to 1 MB of on-chip trace buffer.The on-chip trace is controlled using the Onchip command group.The other trace sinks supported by TRACE32 are not related to MCDS. For more information refer tohttps://www.lauterbach.com/tracesinks.html and the Trace. METHOD command.The Trace. METHOD command allows to use the Trace commands as an alias either for Analyzer orOnchip. For MCDS the default trace method is Analyzer. If this is not available the default is Onchip.Trace Filter and TriggerWhile off-chip traces usually have enough memory for a long time recording, on-chip traces do not.Consequently for on-chip traces, it is important to limit the recording to the information of interest. This canbe achieved by programming triggers and filters. A trace trigger is an event that results in a termination of the trace recording. The termination canoptionally be delayed.For example, a trace trigger can be configured on an error condition to make sure thatinformation is recorded on how this error occurred. The optional delay between the event ant thetermination can be used to record how the application reacted on the error event. A trace filter only generates trace data for defined events.Defining trace filters reduces the trace buffer consumption.The configuration of a trace filter or trigger has an impact on the recorded data: In case no trace filter is programmed (unconditional trace) all enabled trace sources will generatetrace data. In case at least one trace filter is programmed (conditional trace), all enabled trace sources willgenerate trace data as long as the condition for the trace recording is true. 1989-2022 LauterbachMCDS User’s Guide 10
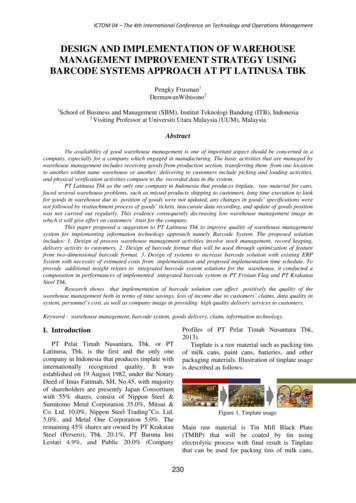
The Emulation Device ConceptFor cost and power saving reasons, the trace and trigger features are only implemented in special SoCversions, the Emulation Devices. The normal Product Devices for the mass-market do not contain them. The Product Device (PD) is for the mass production but also for development. It consists of asingle die, the Product Chip (PC), including all application and debug functionality. The Emulation Device (ED) is for development and field tests. It contains two dies, theunmodified Product Chip (PC) and the Emulation Extension Chip (EEC) offering the additionaltrace, trigger, and calibration features. Both dies are connected by bond wires.PCPCEECEmulation DeviceProduct DeviceThe packages of Product and Emulation Devices almost have the same pinout. A single debug port is usedto access the PC and the EEC.Product ChipProcessor BusIO32CPU 0Bus 0DAP/JTAGTrace SignalsIO32MCDSPMU/LMUDebug CableEMEMBack Bone BusAGBTPreprocessorEmulation Extension ChipThe EEC consists of the following main components: MCDS (Multi-core Debug Solution) for trace, trigger and filterThe MCDS is the basic module of the EEC, it collects status information from the various chipcomponents. Based on the status information, the MCDS generates debug events and tracedata.For an overview, see chapter MCDS Concept. 1989-2022 LauterbachMCDS User’s Guide 11
EMEM (Emulation Memory) for trace data storage and calibrationThe Emulation Memory is a dual-ported memory used for storing the generated on- and off-chiptrace data as well as calibration information. On some devices, the EMEM can be used asadditional application RAM via the LMU.The EMEM is discussed in chapter Emulation Memory. AGBT (Aurora GigaBit Trace) for serial high-speed off-chip traceThe Aurora GigaBit Trace module uses the Aurora serial protocol to transfer the generated tracedata to the TRACE32 preprocessor or the TRACE32 PowerTrace Serial. AGBT uses a part of theEMEM as FIFO.The AGBT off-chip trace is discussed in chapter AGBT High-speed Serial Trace. BBB (Back Bone Bus) for connecting the EEC modulesThe BBB is an FPI bus independent of the Product Chip for connecting all EEC components,memories, and registers. It can be accessed by the debugger via the debug port.On TriCore the application can also access the BBB using the MLI bridge (TriCore AUDO) or theLMU (TriCore AURIX). On XC2000 Emulation Devices the application cannot access the EECcomponents. Cerberus IO Client (IO32)The Cerberus IO Client (IO32) on the EEC enables the TRACE32 debugger to configure theEmulation Device and to read out the EMEM via the debug port of the Product Device. Other peripheralsDepending on the device, the EEC may provide additional peripheral components. They aremainly used for a specific purpose only, e.g. USB over Emulation Device or the Camera Interface(CIF), and are not covered by this document.Older TriCore devices up to AUDO-NG feature an OCDS-L2 off-chip trace port (parallel trace) to provideinformation about the program flow via a dedicated protocol. This obsolete trace protocol was part of theProduct Chip and is not related to the Emulation Device or MCDS. 1989-2022 LauterbachMCDS User’s Guide 12
TRACE32 Support for Emulation DevicesThis chapter describes how TRACE32 supports the various Emulation Device features, the requiredlicenses, and the physical device connection. All MCDS users are advised to read this chapter.The MCDS command group is used for configuring the MCDS, the AGBT, and the Emulation Memory.Feature OverviewWhen trace is available, TRACE32 provides an out-of-the box trace configuration: the program flow trace forthe first core of the architecture is selected by default. As soon as program execution starts, recording isstarted, too.NOTE:The MCDS of TriCore devices is restricted to generate trace and triggerinformation only for up to two cores, even if the devices have more cores.If the device supports off-chip trace and a suitable trace preprocessor or PowerTrace Serial is connected,off-chip trace is used is used automatically (Trace.METHOD Analyzer). Otherwise on-chip trace isconfigured automatically (Trace.METHOD Onchip).The most important and most frequently-used features can easily be selected and configured with thefollowing commands:MCDS.stateOpens the MCDS.state window, where you can quickly enable and disablethe different trace sources.Break.SetAllows you to easily configure commonly used trace triggers and filters,including OS-aware tracing (option /TraceData).CTSCTS (Context Tracking System) allows debugging an application based onits program trace recording.BMCBenchmark Counters are used to count important events, e.g. cache hits andmisses, the number of calls to a function or exceptions.Target InterfaceNo extra debug port is required for accessing and configuring the EEC. Only one debug cable is required fordebug and on-chip trace.The debug port connector, the debug cables and available adapters and converters are described in thefollowing application notes: “Application Note Debug Cable TriCore” (app tricore ocds.pdf) “Application Note Debug Cable C166” (c166 app ocds.pdf) 1989-2022 LauterbachMCDS User’s Guide 13
For the AGBT off-chip trace, the 22-pin ERF-8 trace connector or AGBT Trace Adapter for PowerTrace Serialis required. The trace connector also includes the debug signals, so the debug cable and the tracepreprocessor can be connected to the target via one connector. For the pinout and the signals, refer to: https://www.lauterbach.com/ad3829.html https://www.lauterbach.com/ad3556.html “ERF8 22-pin Power.org Connector” in Application Note Debug Cable TriCore, page 18(app tricore ocds.pdf) Infineon Application Note AP32186 “Aurora Connector & Cable”Lauterbach uses the Infineon TriBoards for development and verification. Their documentation containsschematics and additional information about the debug and trace interfaces. Lauterbach recommendsthat you use this information as reference for proprietary hardware.In addition to the break pins at the debug port, most TriCore Emulation Devices have further package pins toprovide an external trigger signal. These pins are often also available via the GPIO ports. For moreinformation, see the Infineon User’s Manual and Data Sheet of your device.MCDS LicensingThe use of the MCDS trigger features and the EEC access is covered by the architecture’s debug license.Decoding the MCDS trace data requires an extra license: TriCore-MCDS for TriCore, including PCP and GTM. C166-MCDS for XC2000ED and C166.The trace license is either stored in the debug cable, in the trace preprocessor or in the PowerTrace Serialmodule and can be used for on- and off-chip trace. For example, the TriCore-MCDS license stored in thepreprocessor connected to the trace module can be used for TriCore MCDS on-chip trace.NOTE: 1989-2022 LauterbachThe Serial Trace preprocessor is architecture independent. In case originally purchased for PowerPC or ARM it does not contain an MCDSlicense.The PowerTrace Serial is architecture independent. In case originally purchased for PowerPC or ARM it does not contain an MCDS license.The obsolete OCDS-L2 preprocessor (parallel trace) is not recognized asan MCDS trace license as the trace protocols are completely different.MCDS User’s Guide 14
The licenses available for your current setup are displayed in the VERSION.view window. A more detailedlist is displayed in the LICENSE.List window. The example below shows that the TriCore-MCDS license isstored in the debug cable and in the preprocessor.NOTE: 1989-2022 LauterbachFor order information and prices, please contact your local Lauterbachrepresentative.MCDS User’s Guide 15
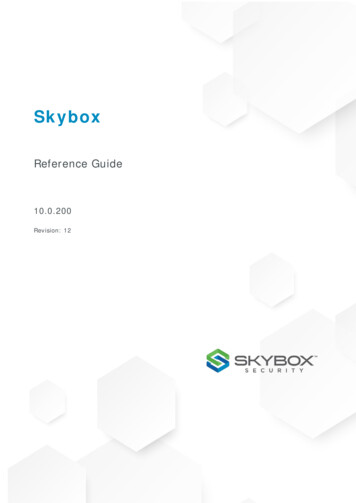
MCDS Basic FeaturesThis chapter introduces the basic features of the TRACE32 support for MCDS, especially the trigger andfilter configuration via the Break.Set command. All MCDS users using trace and trigger are strongly advisedto read this chapter.MCDS ConceptThe MCDS is the main module of the EEC, it collects status information of the various chip components.Based on the collected status information, the MCDS generates debug and trace events as well as tracedata. Understanding the MCDS concept helps understanding its behavior.The MCDS consists of one or more independent Observation Blocks receiving status and run-timeinformation from a core or bus. This information can be written to the trace buffer or used to generate debugand trace signals: Debug signals are used to generate signals to the SoC, e.g. to stop a core or to toggle a pin. Trace signals together with optional trace filters are used to enable or disable trace datageneration, to generate a watchpoint message, or to count events.-For information about watchpoint messages, see chapter Watchpoints.-For information about event counters, see chapter Benchmark Counters.The basic MCDS setup is identical for on- and off-chip trace.MCDS of XC2000ED and C166XC2000 and C166 Emulation Devices only have one observation block. Only the core can be observed.MCDS of TriCoreTriCore has up to two Processor Observation Blocks (POB) to observe the cores (TriCore, PCP and GTM)and two Bus Observation Blocks (BOB)) to observe the buses (LMB, SRI, SPB or RPB).Product ChipBus 0CPU 0POBxMCXBOBxMEM IFEmulation Extension Chip 1989-2022 LauterbachMCDS User’s Guide 16
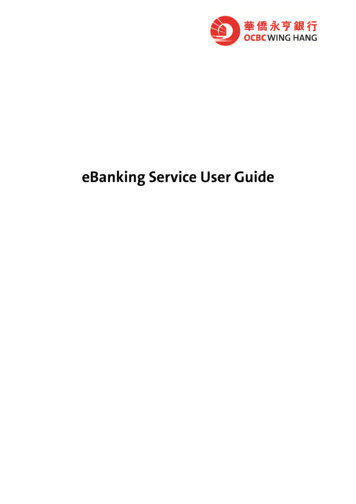
The trace data generated by the Observation Blocks is forwarded to the Memory Interface (MEM IF) whereall messages are sorted according their temporal order and then written to the Emulation Memory.The POBs observe the program execution as well as the data accesses of the core (program- and datatrace). The BOBs observe the data transactions on the buses (data trace), also containing meta informationabout the transaction, e.g. bus master, channel and priority.NOTE:Restrictions for TriCore AUDO-NG: LMB cannot be traced.Restrictions for TriCore AURIX: Only two out of four cores can be selected for trace and trigger. HSM cannot be traced, all related bus traffic is removed on SoC level. SCR cannot be traced, all related bus accesses available.The Multi-core Cross-connect (MCX) does not observe anything. It is used for generating the timestampmessages and contains counters. The counters can be used to count internal evens (see chapter Benchmark Counters).Alternatively counters can be used to implement state machines. This allows to implement tracefilters, e.g. record all bus transactions while a specific function is active. MCDS does not attach timestamp information to each trace message. Instead, the timestampsare dedicated messages. So several messages generated at the same time share onetimestamp message to reduce trace buffer consumption. Timestamps can be enabled continuously or on demand to tag dedicated events only. TheObservation Blocks can signal the MCX to generate a timestamp in case an event happened.NOTE:For TriCore AUDO this signal from the Observation Block to the MCX isdelayed, so the timestamp messages are generated asynchronously, resultingin incorrect timestamp information. To avoid this, TRACE32 only allowscontinuous timestamp generation for TriCore AUDO. For TriCore AURIX thisissue is fixed. See chapter No Trace Content Displayed for more information.MCDS ConfigurationThe MCDS command group is used to configure the MCDS. For a complete description of all MCDScommands, see chapter “MCDS” in General Commands Reference Guide M, page 33(general ref m.pdf).The MCDS.state window shows the most important configuration options available for the selected device.The following sections give an overview and introduction only, please refer to the corresponding chapters ofthis User’s Guide to get more information. 1989-2022 LauterbachMCDS User’s Guide 17
General SettingsGeneral MCDS configuration: The TRACE32 MCDS implementation has two states: ON and OFF.The default is MCDS.ON. It is required for tracing and programming any triggers and filters. Ifswitched off (MCDS.OFF), TRACE32 does not access any MCDS register. This can be used toavoid interference with third-party tools or applications. MCDS.RESet resets all MCDS configuration to the default. MCDS.CLEAR deletes all configuration made by the MCDS.Set command group. See chapterGuarded MCDS Programming for details. MCDS.INFO provides information about the availability of hardware resources. MCDS.Register opens a peripheral access to all MCDS registers.Buttons as shortcuts to MCDS related features: CLOCK: SoC clock configuration, required for using timestamps. BMC: Count MCDS generated events using the Benchmark Counters. Trace: Configure the currently selected Trace method.Timestamp SetupEnabling and using the MCDS-generated on-chip timestamps requires two steps: Enable the MCDS timestamp generation: MCDS.TimeStamp ON. Use the CLOCK commands to inform TRACE32 about the chip’s base clocks. CLOCK.ON tellsTRACE32 to use these clocks for calculating the timestamps. 1989-2022 LauterbachMCDS User’s Guide 18
Example:SYStem.CPU TC275TECLOCK.OSCillator 20.0MHzCLOCK.ON; frequency of on-boardoscillatorSYStem.Mode UpData.LOAD.Elf myapplication.elf /NoCODEGo PLL ConfigDoneCLOCK.view; manually verify clock setupMCDS.TimeStamp ON; enable timestamp generationNOTE:A correct programming of the on-chip clocks is mandatory for a correct operation ofthe MCDS hardware and timestamp generation. See chapter EEC Clock Systemfor details.Timestamp decoding requires the entire trace buffer to be processed. For huge trace buffers, e.g. off-chiptrace, this may take up to several minutes.Trace Buffer ConfigurationTRACE32 can be configured to share the EMEM with third-party tools or applications using theMCDS.TraceBuffer commands. See chapter Emulation Memory for details.As long as no sharing of the EMEM is required TRACE32 automatically chooses the most suitable EMEMconfiguration.NOTE:XC2000 Emulation Devices do not allow configuring the EMEM.AGBT Off-chip Trace ConfigurationThe commands MCDS.PortSIZE and MCDS.PortSPEED are used to configure the Aurora GigaBit Trace(AGBT). See chapter AGBT High-speed Serial Trace for more information.Trace SourcesSelecting a trace source enables the generation of the corresponding trace data. On TriCore, the tracesources of the different cores and buses can be enabled independently. On XC2000 only the core can betraced.For the program trace different variants exist: program trace, sync trace, and CFT. For details please refer tochapter Trace Sources. 1989-2022 LauterbachMCDS User’s Guide 19
TriCore AURIX is limited to tracing only two cores at the same time. Multiplexers are implemented to selectthe cores to be traced. Use the command MCDS.SOURCE.Set CpuMux[0 1].Core to configure them.The TriCore SRI is not a bus, it is a fabric that can perform more than one transaction per clock cycle. TheMCDS hardware is limited to tracing only two transactions in parallel. The command MCDS.SOURCE.SetSRI.[1 2].SLAVE is used to select the corresponding bus slave. All transactions to selected slaves arerecorded. The masters that initiated these transactions are available from the recorded trace data.The GTM peripheral module is implemented as a peripheral trace. So in addition to the executed instructionsand data accesses internal signals can be recorded, too. These signals can be displayed as a timingdiagram, implementing the feature of an on-chip logic analyzer. See “GTM Debugger and Trace”(debugger gtm.pdf) and the TriCore-related GTM demos in /demo/gtm/hardware/ for more i
Maximum Clock Frequency 63 Allowed Clock Ratios 63 Verifying the Clock Setup 63 Device Specific Details 64 XC2000ED and C166 64 TriCore AUDO-NG (TC v1.3) 65 TriCore AUDO-F, AUDO-S and AUDO-MAX (TC v1.3.1) 65 TriCore AUDO-MAX (TC v1.6) 66 TriCore AURIX (TC v1.6.1) 66 MCDS Clock System 67 MCDS Sampling 67 MCDS Timestamps 67 Clock Counters 68