Transcription
Tao et al. BMC Genomics (2018) EARCH ARTICLEOpen AccessIdentification of recombination events inoutbred species with next-generationsequencing dataShentong Tao, Jiyan Wu, Dan Yao, Yuhua Chen, Wenguo Yang and Chunfa Tong*AbstractBackground: Meiotic recombination events include crossovers and non-crossovers or gene conversions. Althoughthe rate of crossovers is often used for genetic mapping, the gene conversion events are not well studied especiallyin outbred species, which could produce distorted markers and thus affect the precision of genetic maps.Results: We proposed a strategy for identifying gene conversion events in Populus with the next-generationsequencing (NGS) data from the two parents and their progeny in an F1 hybrid population. The strategy firstinvolved phasing the heterozygous SNPs of the parents to obtain the parental haplotype blocks by NGS analyticaltools, permitting to identify the parental gene conversion events with progeny genotypes. By incorporatingavailable genetic linkage maps, longer haplotype blocks each corresponding to a chromosome can be created, notonly allowing to detect crossover events but also possibly to locate a crossover in a small region. Our analysisrevealed that gene conversions are more abundant than crossovers in Populus, with a higher probability togenerate distorted markers in the regions involved than in the other regions on genome. The analytical procedureswere implemented with Perl scripts as a freely available package, findGCO at https://github.com/tongchf/findGCO.Conclusions: The novel strategy and the new developed Perl package permit to identify gene conversion eventswith the next-generation sequencing technology in a hybrid population of outbred species. The new methodrevealed that in a genetic mapping population some distorted genetic markers are possibly due to the geneconversion events.Keywords: Crossover, Gene conversion, Haplotype block, Next-generation sequencing, PopulusBackgroundLinkage mapping plays an important role in genetic analysis, especially in the context of quantitative trait locus(QTL) identification [1, 2], comparative genomics [3, 4],and genome scaffold sequence assembly [5, 6]. Since thepublication of the first genetic map of Drosophila melanogaster [7], linkage maps have been constructed inmany animal and plant species. Generally, a linkage mapdisplays the linear order and genetic distance of molecularmarkers on chromosomes through analyzing the parentalrecombination events occurring during meiosis and passing on to the offspring. Thus, the precision and accuracyof linkage maps, which are crucial for applications, are* Correspondence: tongchf@njfu.edu.cnCo-Innovation Center for Sustainable Forestry in South China, College ofForestry, Nanjing Forestry University, No.159, Longpan Road, Xuanwu Qu,Nanjing 210037, Chinaaffected by several factors, such as the mapping population size, the number and quality of markers, and the approach for ordering markers within a linkage group. Intheory, the markers are required to be Mendelian factors,which segregate in a fixed ratio in a whole population.However, in practice, some markers were found not to follow Mendelian segregation, while the biological mechanicsis not well explained up to date.The Populus is a model system for forest trees. It hastremendous economic and ecological importance, and iswidely distributed in North Hemisphere [8, 9]. A largenumber of linkage maps of different Populus specieshave been built in the past two decades using traditionalmolecular markers such as RAPD, RFLP, AFLP and SSR.In most of these studies, distorted markers that deviatedfrom Mendelian segregation ratios were reported with frequencies varying from 10% [10–14] to 20% [15, 16]. The Author(s). 2018 Open Access This article is distributed under the terms of the Creative Commons Attribution 4.0International License (http://creativecommons.org/licenses/by/4.0/), which permits unrestricted use, distribution, andreproduction in any medium, provided you give appropriate credit to the original author(s) and the source, provide a link tothe Creative Commons license, and indicate if changes were made. The Creative Commons Public Domain Dedication o/1.0/) applies to the data made available in this article, unless otherwise stated.
Tao et al. BMC Genomics (2018) 19:398Different strategies were taken for distorted markers whenperforming linkage analysis. Some studies excludedseriously distorted markers at the 1% significant level (i.e.P 0.01) because these markers could bias linkage analysisand thereafter QTL identification [10, 13, 17, 18], whilethe others included all distorted markers as they wereconsidered to be possibly associated with genes of interest[11, 14, 15]. The segregation distortion in Populus wasgenerally believed to be related to many biological factors,such as genetic isolation, chromosome loss, genetic load,genome structural rearrangement, and linkage of markersto lethal genes [19, 20]. However, recent studies showedthat gene conversion (GC) events during meiosis could beone of the main reasons that can skew segregation rates,but were typically ignored in genetic mapping studies [21].It is well known that the result of meiotic recombination includes crossovers (COs) and non-crossovers(NCOs or GCs). COs reciprocally exchange DNA sequences between homologous chromosomes at a megabasescale, whereas GCs copy shorter sequences (less than a fewkilobases) from one homologous chromosome to the other,altering allelic frequency [22–24]. Ky et al. [25] inferred thatsome distorted traditional markers of AFLP or RFLP incoffee may be due to GC events, but there were no directevidences at genome-sequence scale. However, with thenext-generation sequencing technologies, recent studies revealed that there are abundant GC events occurred duringmeiosis in Arabidopsis. Lu et al. [23] detected that the number of GCs was almost the same as the number of COs inArabidopsis, like in yeast. Subsequently, however, Yanget al. [21] presented that more number of GC events wereidentified by sequencing 40 Arabidopsis plants and theirparents with high coverage, rejecting the former estimate ofequal numbers of CO and GC events.In the present study, we investigated CO and GC eventsin Populus in order to understand the implications in generating distorted markers in a mapping population. Weperformed high-throughput whole genome sequencing of10 progeny and their two parents in an F1 bybrid population of Populus deltoides and P. simonii. In a previous study[26], we have separately constructed the female P. deltoidesand the male P. simonii linkage maps with thousands ofsingle nucleotide polymorphisms (SNPs) generated by oneof the next generation sequencing technologies. Here, astrategy was proposed to identify the CO and GC events insuch a highly heterozygous tree species through the procedures: (1) phasing the parental haplotypes based on thereference genome of P. trichocarpa [9], (2) mapping thepaired-end (PE) reads of each progeny to the reference sequences, (3) calling SNP genotypes and phasing for haplotypes for each individual, (4) identifying GCs by comparingthe progeny haplotypes with the parents, (5) generatinglonger parental haplotypes with available linkage maps, and(6) finally forming progeny longer haplotypes with SNPPage 2 of 11genotypes and identifying COs in each progeny. The strategy was implemented with Perl scripts as a freely availablepackage, findGCO, at the website of https://github.com/tongchf/findGCO. Consequently, 34.8 COs from the female parent and 27.3 from the male were found on averagein progeny, while the numbers of GCs were 4055.6 and3564.0, respectively, over 100 times the number of COs.Furthermore, we investigated the relationship between GCsand distorted markers with SNP data from 299 progeny inthe same population, revealing that the distorted SNPsmore frequently occurred in the regions of GCs than in theother regions. The results facilitated to recognize the roleof GCs in forming distorted molecular markers andprovided essential information when dealing with thosemarkers in genetic mapping.MethodsPlant materials and whole genome sequencingAn F1 full-sib family of P. deltoides P. simonii was originally established as a mapping population. Approximately 500 progeny were planted in Xiashu Forest Farmof Nanjing Forest University, Jurong County, JiangsuProvince, China [26]. Ten progeny randomly chosenfrom the hybrid population as well as the two parentswere considered as the materials for identifying recombination events in this study. Genomic DNA was extracted from fresh leaf tissue of each individual with theCTAB protocol [27]. Next, the qualified DNA was randomly sheared by sonication and Illumina adaptors witha unique multiplex identifier (MID) were added byligation. A single library for the two parents with an insert size range of 300–500 bp was prepared and sequenced from both ends (paired-end, PE) with 101 bpread lengths in one lane of Illumina HiSeq 2000, whiletwo libraries for the 10 progeny with the same insert sizewere constructed and sequenced (PE, 126 bp) in twolanes of Illumina HiSeq 2500. The whole-genome sequencing was performed at different times in BiomarkerTechnologies Co. Ltd., Beijing, China (BMK).Quality control and aligning of PE readsThe raw sequence data generated from the Illumina sequencers were filtered to obtain high-quality (HQ) readswith procedures as described in Mousavi et al. [28].Briefly, we first discarded those PE reads that satisfy anyone of the following conditions: (1) containing primer/adapter sequence, (2) having more than 10% uncalledbases (N), or (3) more than half of the bases in either ofthe reads having Phred quality score less than 5. Thedata generated from this step are called clean data.Secondly, the clean data were further filtered withNGS QC toolkit [29] to generate HQ reads such that thequality score is greater than or equal to 20 for 70% basesin either of PE reads.
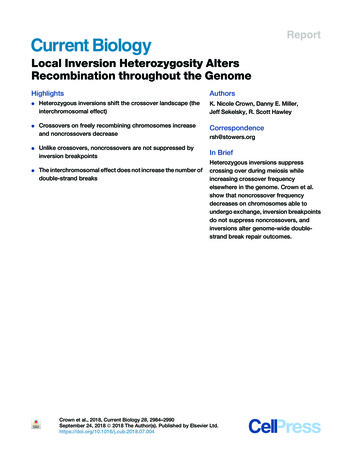
Tao et al. BMC Genomics (2018) 19:398In the process of haplotype phasing or SNP calling, PEreads of each sample including the two parents were required to align to the reference genome sequence of P.trichocarpa [9]. We used the command mem in thesoftware of BWA [30] with default parameters to mapthe reads to the reference sequence, resulting in a SAM(sequence alignment/map) [31] file for each sample. Toavoid to use those reads that are mapped to repeat regionsin the reference, each SAM file was filtered such that eachrecord in the file has an edit distance not more than 8% ofthe read length, with the best alignment score greater thanor equal to 60 and the second-best alignment score lessthan the best alignment. After this step, the SAM file wasconverted to BAM format with SAMtools [31] for savingstorage space and other subsequent analyses.Removal of duplicate reads is a usual filtering step in processing NGS data for high quality. Duplicate reads are considered to be caused by multiple PCR products from thesame DNA fragment, which may lead to false positive variant calls [32, 33]. We used the program MarkDupicaties inPicard package (http://broadinstitute.github.io/picard) toremove the duplicate reads contained in each BAM filegenerated above. The final processed BAM files were usedfor haplotype phasing analyses in the next sections.Parental haplotype constructionA haplotype is a linear set of bases from all SNPs in agiven chromosome [34], and here we defined a haplotype block as a subset of bases in a haplotype. In diploidorganisms, the recombination events at meiosis can bediscovered by comparing the haplotypes of an individualand its parents. We used the command phase in SAMtools [31] with a minimum base quality score of 20 inheterozygote to obtain the information of the parentalhaplotypes using the corresponding BAM files createdabove. The records of this step were filtered to generatehaplotype blocks for each parent. Each block must contain at least 5 SNPs with a coverage depth of at least 5reads at each site and at least 3 reads for each allele. Furthermore, the genotype of each SNP in a parental blockwas required to be heterozygous in the current parentand homozygous in the other, and each genotype qualitymust have a Phred-scaled score of at least 60. In the following steps, for simplicity, the allele of homozygote forall SNPs in these haplotype blocks is denoted by ‘a’ andthe other allele of heterozygote by ‘b’.In order to obtain longer haplotype blocks, we usedthe linkage phase information of SNPs on the twoparent-specific linkage maps constructed in the previousstudy [26] to merge two adjacent haplotype blocks ongenome. The merging procedures can be described as inFig. 1. When two SNPs on a linkage group with a knownlinkage phase (Fig. 1a) are found in two different haplotype blocks (Fig. 1b), the two haplotype blocks can bePage 3 of 11merged into a longer one, with another one on the homologous chromosome (Fig. 1c). Finally, each linkage group oftwo parental maps corresponded to a long haplotype block.Identification of recombination eventsWe called genotypes for each progeny at all SNPs contained in the haplotype blocks of the two parents. First,the command mpileup in SAMtools was used to generateBCF files, with each BAM file as input and the parameterof minimum base quality taking the value of 20. Second, aVCF file was produced with each BCF file using the command call of BCFtools (v1.1), which is accompanied withSAMtools, just skipping indels (insertions/deletions). Finally, each VCF file was filtered such that an SNP genotype has a sequence depth of at least 15 reads with thegenotype mapping quality of greater than 60 and each allele coverage of at least 5 reads.For each parental haplotype block, including the longer ones constructed with linkage information, we chosethose SNPs at which the genotypes of the other parentare all homozygous (Fig. 2a and b). Those SNPs have thecharacteristic of pseudo-testcross markers [35], whichcan be used to identify recombination events in theprogeny haplotypes as performed by Yang et al. [21](Fig. 2c, d and e). At those pseudo-testcross SNPs, if thegenotypes of a progeny are denoted by ‘aa’ or ‘ab’, thetwo haplotype blocks can be inferred, one of which isinherited from one parent with alleles of ‘a’s and theother from the other parent with alleles of ‘a’s and ‘b’s(Fig. 2c and d). Comparing the haplotype block containing ‘a’s and ‘b’s with the two in the heterozygous parent(Fig. 2b), the recombination events can be identified at meiosis in this parent. If a DNA fragment is less than 2 kb butgreater than 20 bases and replaces a homologous sequence,a GC is thought to occur during meiosis [24, 36]; however,when two DNA fragments in lengths of more than 10 kbcome from different homologous chromosomes and jointogether in a progeny haplotype block, a crossover is considered to exist at the junction [21, 22] (Fig. 2d).ResultsReads quality control, mapping and duplicates removingWe sequenced the whole genomes using the platformsof Illumina HiSeq 2000 for the two parents, P. deltoidesand P. simonii, and Ilumina HiSeq 2500 for the 10 progeny in BMK at different times. With the standard quality control (QC) pipeline at BMK, a total of 62.12 Gbclean data with a read length of 101 bp were obtainedfrom the two parents and an average of 13.77 Gb with aread length of 126 bp from the progeny (Table 1). Theseclean data are available under accession numbersSRP071167 for the parents and SRP125267 and SRP125268for the progeny at the NCBI Sequence Read Archivedatabase (http://www.ncbi.nlm.nih.gov/Traces/sra). After a
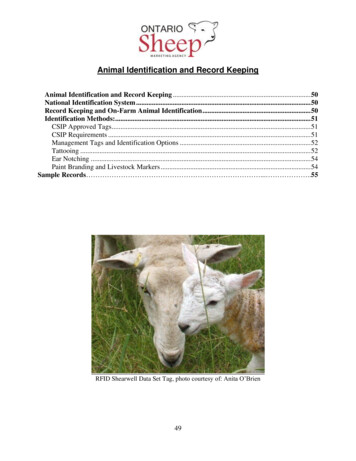
Tao et al. BMC Genomics (2018) 19:398Page 4 of 11Fig. 1 Merger of two haplotype blocks with linkage information. Two different alleles are denoted by ‘a’ and ‘b’ for all SNPs in the haplotypeblocks. a The two SNPs, namely C01 400706 and C01 666847 with a repulsion linkage phase, are found in (b) haplotype blocks 1 and 2. c Accordingto the linkage phase, the two blocks can be merged into a longer one (dark brown), with another one on the homologous chromosomeserious filtering process with NGS QC toolkit, the HQreads data were obtained with a reducing range from 6 to20%, in which over 96% bases have a Phred quality score ofat least 20 for each individual (Table 1).We mapped the HQ reads of each individual to thereference genome of P. trichocarpa. As a result, 96.15and 95.67% of the HQ reads from the female and maleparents were aligned to the reference, respectively, andthe mean percentage for the progeny was 98.33 with astandard deviation of 0.77. We filtered these mappedreads such that the edit distance is at most 8% of thesingle read length with the best alignment score of atleast 60 higher than the second-best alignment score.The remaining reads were considered to be almostuniquely mapped to the reference genome [26], occupying55.55–60.15% of the mapped reads of each sample. Afterthat, we further removed the duplicate reads from thesealmost uniquely mapped reads, leading to 3.92–33.99% ofFig. 2 Procedures for identifying recombination events with a haplotype block inherited from one parent. a The haplotype blocks at the sameSNP sites for two parents are shown. At these sites, the genotypes are all heterozygous in the female P. deltoides, but homozygous in the maleP. simonii. b The homozygous allele is denoted by ‘a’ and the other allele in a heterozygote by ‘b’ at each SNP. c One progeny is genotyped withnotations of ‘aa’ and ‘ab’ at those SNPs. d The haplotype blocks of this progeny can be discriminated, one (blue) from the male parent and theother (yellow/red) from the female. The haplotype block from the female carries recombinant information, in which the first red fragment ( 2 kb)from the top is considered to be a product of gene conversion and the junction between the second yellow and red fragments ( 10 kb) acrossover. e The alleles on the haplotype blocks of the progeny are labelled with base notations as they were
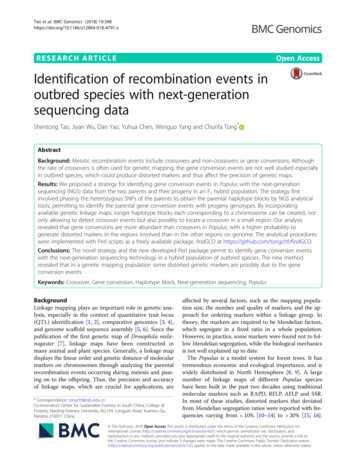
Tao et al. BMC Genomics (2018) 19:398Page 5 of 11Table 1 Summary of the sequencing data in aspects of quality, mapping results and duplicate reads for the two parents and their10 progenySample ID Clean PE Clean Bases (Gb) HQ PE reads (M) HQ bases (Gb) Mapped reads (%) Uniquely mapped Duplicate readsb (%) Remainedreads (M)readsa (%)reads 3aThe percentage of almost uniquely mapped reads in all mapped reads for a sampleThe percentage of duplicate reads in uniquely mapped reads for a sampleP1, the female parent P. deltoidesdP2, the male parent P. simoniibcthe reads discarded for each individual. Consequently,37.43–52.50% of the HQ reads of each individual, whichwere expectedly mapped to unrepeated regions with amaximum edit distance of 8 for the parents and 10for the progeny, were remained for inferring haplotype blocks and identifying recombination events inthe next section (Table 1).Construction of parental haplotype blocksWith the remained reads generated above, we used thecommand phase in SAMtools to call haplotype blocksfor each parent. After performing the filtering steps asdescribed in Materials and Methods, we obtained 54,753haplotype blocks containing 647,971 HQ SNPs in the female parent of P. deltoides, while in the male P. simonii thenumber of haplotype blocks was 35,458 with a total number of 427,863 HQ SNPs (in Additional file 1: Table S1).These female and male blocks have the average spannedlengths of 842 and 806 bp with the longest lengths of26,133 and 20,230 bp, totally covering 10.62 and 6.58% ofthe reference genome, respectively. By incorporating thegenetic linkage maps, 19 longer haplotype blocks wereconstructed for each parent. The female longer blockscontained 9942 SNPs, of which 1205 SNPs are included in the linkage map, whereas the male longerones contained 8149 SNPs with 700 from the male linkagemap (in Additional file 1: Table S2). On each of the femalehaplotype blocks, including the longer ones, all the SNPsegregation types are ab aa, i.e., the female parent genotype is a heterozygote ab, but the male is a homozygote aaat each SNP site. On the contrary, the segregation types ofall the SNPs on each male haplotype block are aa ab.Identification of recombination eventsWe compared the parental haplotype blocks with theblocks of each progeny to identify recombination events.As a result, 9247 (16.9%) of the maternal haplotypeblocks and 6841 (19.3%) of the paternal were found tohave recombination events detected in at least one progeny. We categorized these haplotype blocks accordingto the number of individuals in which one or more recombination events were detected in the same haplotypeblock. Figure 3 presented the bar charts of these categories for both parents. It can be seen that over 60% ofthese blocks have recombination events detected in atleast two individuals, with over 5% (488/508) having recombination events identified in all the 10 progeny.Table 2 presented the distribution of the number of recombination events identified in the progeny over fragmentlength. It is easily found that the over 95% of the recombination events belonged to GC (20 bp – 2 kb), while less than2% could result from crossover events ( 2 kb). Table 3 andin Additional file 1: Table S3 presented the numbers ofgene conversion events distributed on the reference genome sequences, which were identified in each of the 10progeny and occurred during meiosis in the female andmale parents, respectively. On average, we found 4055.6maternal GCs with an average length of 231.4 bp and3564.0 paternal GCs with almost the same average length(231.5 bp) in the progeny (in Additional files 2 and 3: ExcelSheets S1 and S3). Furthermore, we discovered thatthere existed strong correlations among the parentalGC numbers and the lengths of the reference chromosomes of P. trichocarpa, with coefficients of 0.9606between the female and the male, 0.9377 between the
Tao et al. BMC Genomics (2018) 19:398Page 6 of 11Fig. 3 Bar charts of the number of haplotype blocks against the number of individuals in which one or more GC events were detected in thesame haplotype block for the female (a) and male (b) parentsfemale and the reference and 0.9072 between themale and the reference.With the long haplotype blocks constructed by the parental linkage maps, CO events were identified from the SNPgenotypes of each progeny at the sites of those long haplotypes. The distribution of CO events on chromosome 1 perparental meiosis was shown in Fig. 4 for the two parents.For other chromosomes, the CO patterns were presentedin detail in Additional file 1: Figure S1 and S2. The spansformed by the two parental COs were given for all chromosomes of each progeny in Excel Sheets CD-B35–2 toCD-3-18 in Additional file 4 and Excel Sheets CS-B35–2 toCS-3-18 in Additional file 5. It can be calculated that anaverage number of CO events was 34.8 and 27.3 permeiosis in the female and male parents, respectively. Incontrast, these numbers of COs are less than 1% of the GCnumbers per meiosis.Implication of gene conversion for distorted SNPsIn order to investigate into the implication of GCs fordistorted SNP markers, we analyzed two SNP datasets ofdifferent segregation types of ab aa and aa ab, whichwere generated from 299 individuals in the same F1hybrid population of P. deltoides P. simonii in the previous study of ours [26]. We filtered those SNPs suchthat at least 100 individuals have been genotyped, andthe filtered SNPs were then classified into two categories, within or outside the GC regions that were identifiedin the 10 progeny in this study. Consequently, 367 SNPsin the ab aa dataset and 380 in the aa ab dataset werefound in the GC regions, and the ratios of seriously distorted SNPs (P 0.01) in these GC regions were 69.75and 74.74%, respectively (Table 4). If the GC regionswere limited to those that each was identified in at least5 different individuals, the ratios of the distorted SNPs
Tao et al. BMC Genomics (2018) 19:398Page 7 of 11Table 2 Distribution of the average number of recombination events occurred in the female (male) meiosis and identified in progenyover fragment length2 10 kb 10 kb14.2 (12.1)3.7 (3.4)0.0 (0.0)5.7 (4.9)3.2 (1.6)0.0 (0.0)70.4 (66.3)5.5 (5.9)0.8 (0.3)0.0 (0.0)68.5 (62.3)5.5 (4.4)1.5 (1.2)0.0 (0.0)145 (108.2)83.0 (54.8)6.3 (5.0)0.6 (0.5)0.0 (0.0)131.8 (115.6)69.2 (67.5)6.3 (3.9)3.0 (1.3)0.0 (0.0)Fragment length2 19 bp20 200 bp200 bp 1 kb1 2 kbChr0126.4 (19.4)373.9 (350.5)192.8 (192.8)Chr024.3 (9.4)135.1 (109.6)62.9 (53.7)Chr0310 .0 (10.0)131.3 (137.9)Chr048.9 (9.2)127.3 (129)Chr058.8 (8.4)Chr066.9 (7.0)Chr078.8 (4.8)110.0 (80.5)52.3 (34.6)2.9 (2)1.2 (0.6)0.0 (0.0)Chr088.8 (3.9)92.9 (86.3)62.1 (47.5)7.7 (5.6)0.8 (1.5)0.0 (0.0)Chr094.8 (4)56.5 (57.7)30.0 (31)1.5 (1.9)0.6 (0.1)0.0 (0.0)Chr105.1 (5.2)148.0 (87)80.6 (48.7)5.5 (3.2)1.5 (2.7)0.0 (0.1)Chr1110.8 (4.9)119.1 (110)61.1 (49.8)5.8 (2.9)0.6 (0.9)0.0 (0.0)Chr128.0 (2.1)103.6 (63.2)43.6 (39.2)4.4 (2.3)1.6 (0.4)0.0 (0.0)Chr135.5 (5.9)99.8 (93.8)59.0 (47.4)6.2 (5.2)2.0 (1.3)0.0 (0.0)Chr145.3 (9.3)129.7 (103.6)55.0 (84.9)4.1 (9.7)2.5 (1.1)0.0 (0.0)Chr156.8 (6.4)97.9 (86.3)46.0 (47.3)3.8 (2.3)1.1 (1.7)0.0 (0.0)Chr1626.4 (19.4)373.9 (350.5)192.8 (192.8)14.2 (12.1)3.7 (3.4)0.0 (0.0)Chr174.3 (9.4)135.1 (109.6)62.9 (53.7)5.7 (4.9)3.2 (1.6)0.0 (0.0)Chr1810.0 (10.0)131.3 (137.9)70.4 (66.3)5.5 (5.9)0.8 (0.3)0.0 (0.0)Chr198.9 (9.2)127.3 (129)68.5 (62.3)5.5 (4.4)1.5 (1.2)0.0 (0.0)Scaff.8.8 (8.4)145.0 (108.2)83.0 (54.8)6.3 (5)0.6 (0.5)0.0 (0.0)Total6.9 (7.0)131.8 (115.6)69.2 (67.5)6.3 (3.9)3.0 (1.3)0.0 (0.1)increased up to 84.84 and 76.38%, respectively. On theother hand, 17,640 of the filtered SNPs in the ab aadataset were found outside the GC regions with a distorted ratio of 31.35%, while in the aa ab dataset therewere 10,915 filtered SNPs outside the GC regions with adistorted ratio of 35.10%. Overall, the ratio of distortedSNPs within the GC regions was about two times greaterthan that outside the GC regions.DiscussionWe proposed a strategy for identifying recombinationevents during the meioses of the two parents in an F1hybrid population of P. deltoides and P. simonii with theNGS technology. Unlike in the previous studies in Arabidopsis [21, 23], where the SNP phases of parents wereknown due to the inbred lines available, this strategyfirst needed to phase the heterozygous SNPs of parentsto form the parental haplotype blocks by the NGS analytical tools such as BWA and SAMtools [30, 31]. Next,the specific parental haplotype blocks, in which all theSNP genotypes are heterozygous for one parent andhomozygous for the other, were chosen and comparedwith the progeny haplotype blocks to identify the recombination events. Therefore, the method presented herepermits us to explore especially the GC events inoutbred species, which could affect segregation ratio ofmolecular markers involved and totally ignored in mostprevious genetic linkage analyses. Most importantly, wedeveloped a Perl package to implement the complicatedcomputing procedures, making it easy to identify recombination events using NGS data with just one keystroke.The key step to implement the strategy is to phase theparental haplotype blocks of the outbred parents withNGS data and analytical tools. Here, as a primary workto investigate into the GC events in an outbred species,we directly applied the phase module in SAMtools toobtain the parental haplotypes, because this softwarecontains many powerful functions and meanwhile, wealso used it in this study for dealing with the readsmapping files in BAM format and calling SNPs, etc.Certainly, there are many other package tools availablefor haplotype phasing, such as fastPHASE [37], Beagle[38], SHAPEIT [39] and Eagle [40], which were mostlydeveloped for medical and population genetics. A few ofthese phasing packages can handle NGS data with areference sequence and could be utilized to improve accuracy of the parental phasing results in the current study.However, the phasing step for parental haplotypes wouldbe skipped if we had an hybrid population producedby crossing an F1 individual with one of its parents
Tao et al. BMC Genomics (2018) 19:398Page 8 of 11Table 3 Distribution of the number of gene conversion events detected in each of the 10 progeny and inherited from the femaleparent based on the reference genome sequencesRef.Progeny IDAver.B35–2C25–3C3–2C32–2C5–33 123 143 153 163 oss) or another F1 individual (F2). We noticed thatin the pr
with the next-generation sequencing technology in a hybrid population of outbred species. The new method revealed that in a genetic mapping population some distorted genetic markers are possibly due to the gene conversion events. Keywords: Crossover, Gene conversion, Haplotype block, Next-generation sequencing, Populus Background