Transcription
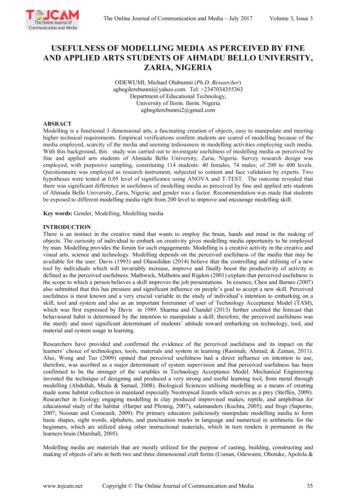
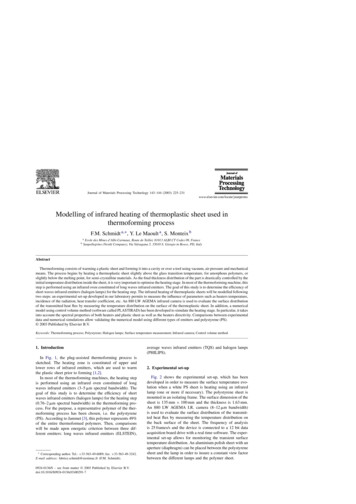
Journal of Materials Processing Technology 143–144 (2003) 225–231Modelling of infrared heating of thermoplastic sheet used inthermoforming processF.M. Schmidt a, , Y. Le Maoult a , S. Monteix babEcole des Mines d’Albi-Carmaux, Route de Teillet, 81013 ALBI CT Cedex 09, FranceSanpellegrino (Nestlé Company), Via Valsugana 5, 35010 S. Giorgio in Bosco, PD, ItalyAbstractThermoforming consists of warming a plastic sheet and forming it into a cavity or over a tool using vacuum, air pressure and mechanicalmeans. The process begins by heating a thermoplastic sheet slightly above the glass transition temperature, for amorphous polymers, orslightly below the melting point, for semi-crystalline materials. As the final thickness distribution of the part is drastically controlled by theinitial temperature distribution inside the sheet, it is very important to optimise the heating stage. In most of the thermoforming machine, thisstep is performed using an infrared oven constituted of long waves infrared emitters. The goal of this study is to determine the efficiency ofshort waves infrared emitters (halogen lamps) for the heating step. The infrared heating of thermoplastic sheets will be modelled followingtwo steps: an experimental set-up developed in our laboratory permits to measure the influence of parameters such as heaters temperature,incidence of the radiation, heat transfer coefficient, etc. An 880 LW AGEMA infrared camera is used to evaluate the surface distributionof the transmitted heat flux by measuring the temperature distribution on the surface of the thermoplastic sheet. In addition, a numericalmodel using control volume method (software called PLASTIRAD) has been developed to simulate the heating stage. In particular, it takesinto account the spectral properties of both heaters and plastic sheet as well as the heaters directivity. Comparisons between experimentaldata and numerical simulations allow validating the numerical model using different types of emitters and polystyrene (PS). 2003 Published by Elsevier B.V.Keywords: Thermoforming process; Polystyrene; Halogen lamps; Surface temperature measurement; Infrared camera; Control volume method1. IntroductionIn Fig. 1, the plug-assisted thermoforming process issketched. The heating zone is constituted of upper andlower rows of infrared emitters, which are used to warmthe plastic sheet prior to forming [1,2].In most of the thermoforming machines, the heating stepis performed using an infrared oven constituted of longwaves infrared emitters (3–5 m spectral bandwidth). Thegoal of this study is to determine the efficiency of shortwaves infrared emitters (halogen lamps) for the heating step(0.76–2 m spectral bandwidth) in the thermoforming process. For the purpose, a representative polymer of the thermoforming process has been chosen, i.e. the polystyrene(PS). According to Jammet [3], this polymer represents 49%of the entire thermoformed polymers. Then, comparisonswill be made upon energetic criterion between three different emitters: long waves infrared emitters (ELSTEIN), Corresponding author. Tel.: 33-563-49-6089; fax: 33-563-49-3242.E-mail address: fabrice.schmidt@enstimac.fr (F.M. Schmidt).0924-0136/ – see front matter 2003 Published by Elsevier B.V.doi:10.1016/S0924-0136(03)00291-7average waves infrared emitters (TQS) and halogen lamps(PHILIPS).2. Experimental set-upFig. 2 shows the experimental set-up, which has beendeveloped in order to measure the surface temperature evolution when a white PS sheet is heating using an infraredlamp (one or more if necessary). The polystyrene sheet ismounted in an isolating frame. The surface dimension of thesheet is 135 mm 100 mm and the thickness is 1.63 mm.An 880 LW AGEMA I.R. camera (8–12 m bandwidth)is used to evaluate the surface distribution of the transmitted heat flux by measuring the temperature distribution onthe back surface of the sheet. The frequency of analysisis 25 frames/s and the device is connected to a 12 bit dataacquisition board drive with a real time software. The experimental set-up allows for monitoring the transient surfacetemperature distribution. An aluminium polish sheet with anaperture (diaphragm) can be placed between the polystyrenesheet and the lamp in order to insure a constant view factorbetween the different lamps and the polymer sheet.
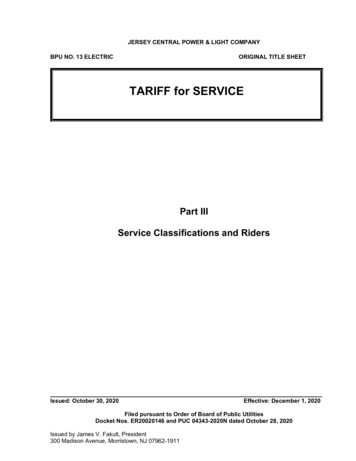
226F.M. Schmidt et al. / Journal of Materials Processing Technology 143–144 (2003) 225–231Fig. 1. Plug-assisted thermoforming process.Fig. 2. Experimental set-up overview. Side view of the infrared oven.2.1. Heat source characterisationThe halogen lamps used in the infrared oven (PHILIPS900 W) are composed of a coiled tungsten filament (length:300 mm), contained in a quartz tubular enclosure (diameter:10 mm) filled with a neutral gas (Argon) and coated on itsback with a ceramic reflector in order to increase the heatflux received by the product. This lamp as well as the ELSTEIN and the TQS lamps are presented in Fig. 3. Spectralproperties of these elements have already been measured inprevious works [4,5]. Using these data, the tungsten filamentand quartz tube temperatures are calculated using a net radiation method [6]:4P εFil (TFil )SFil σTFil 2πLQ kArgon (T )TFil TQ 0,ln(dQ /dFil )4 2πLQ kArgon (T )αQ (TFil )εFil (TFil )SFil σTFil εQ SQ σTQ4 hSQ (TQ T ) 0which is easier and saves time. The temperatures of the filament and the quartz tube are computed at steady state usinga Newton–Raphson method. The results of this computation are shown in Fig. 4. Additional curves are plotted onthe same graph, they are related to experimental measurements: colour temperature of the filament and temperatureTFil TQln(dQ /dFil )(1)where P is the electrical power of the lamps; the indices Filand Q refer, respectively, to the filament and the quartz tube,T the temperature, L the length of the lamp, d the filamentor the quartz tube diameter, ε, α the emissivity and absorptivity. T is assumed to be equal to (TFil TQ )/2. We havesimplified this model by computing directly total parameters instead of spectral ones (as emissivity and absorptivity) with polynomial functions depending on temperaturesFig. 3. PHILIPS (with and without reflector), ELSTEIN and TQS lamps.
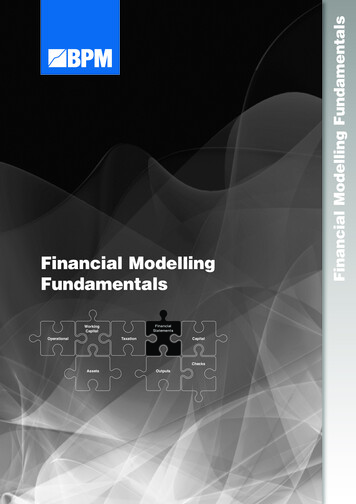
F.M. Schmidt et al. / Journal of Materials Processing Technology 143–144 (2003) 225–231227Fig. 4. Filament temperature vs. electrical power.computed with a resistivity method. At the nominal powerof 1 kW, the values are given in Table 1.As shown in Fig. 4, the discrepancy between the extremecurves is high: greater than 100 K around 2350 K. This factis due to the lack of knowledge on the properties of thisparticular kind of tungsten (coiled filament). On the otherhand, “colour” temperature remains difficult to measure atsuch level of power. In order to conclude, we have chosen thecomputed temperature as a “mean” temperature, lower andupper limits of the temperature, at 1 kW, will be consideredas the global uncertainty.Using experimental set-up described in [4,5], the efficiency factor of the ceramic reflector has been measured:kr (θ, Tr ) Φr (θ, Tr )Φw (θ, Tr )(2)The index r and w refer, respectively, to the lamp with a ceramic reflector and without reflector. The angle θ covered bya detector around the heater and Tr the temperature of thereflector. This value is obtained using a thermopile detectorwith a large spectral bandwidth [0.25, 26] m. The outputsignal delivered by the thermopile is related to the flux emitted by the lamp, so the ratio of the two fluxes measured bythe detector and introduced in (2) gives the efficiency of thecoating. We have checked that this efficiency is unaffectedby the variation of the temperature of the filament and thatTable 1Filament and quartz temperaturesFilament temperature (K)Quartz temperature (K)2360730the emission of the lamp is quasi isotropic. Therefore, wehave obtainedkr 1.36 0.02(3)2.2. PS spectral properties characterisationSpectra data will be used as a database in the numericalsimulation (see Section 3) as well as for the surface temperature distribution measurements. In the literature, we foundfew papers referring to polystyrene spectral properties measurements [7,8]. 1.63 mm white PS sheets were processedby extrusion moulding. In addition, the previous thick sheetswere polished in order to obtain samples of 0.07 mm thickness. Then, we have proceeded to spectral properties measurements (transmitivity, reflectivity) using a Perkin-ElmerFT-IR spectrometer. We have found that the polymer isopaque for wavelengths in the range of 8–12 m with an integrated emissivity of 0.95. This bandwidth corresponds tothe one of the infrared camera. In Fig. 5, the PS absorbtivityαλ is plotted versus wavelength both for the 1.63 mm sheet(a) and the 0.07 mm thin film (b).3. Numerical modelling3D control-volume software, called PLASTIRAD, hasbeen developed in order to compute heat transfer duringthe infrared-heating step. The sheet is meshed using cubicor hexahedral elements so-called control volumes [9]. Thetemperature balance equation including radiant heat transfer(thermal power absorbed by the semitransparent PS sheet
228F.M. Schmidt et al. / Journal of Materials Processing Technology 143–144 (2003) 225–231Fig. 5. Absorptivity vs. wavelength.and radiated from halogen lamps) is integrated over eachcontrol volume and over the time from t to t t Tρcp dΩ dt t t Ωe ( qc · n ) dΓ dt ( qr · n ) dΓ dt(4) tΓe tΓewhere Ωe is the control volume, qc and qr are the Fourier’sconductive and the radiated fluxes, respectively. The unknown temperatures are computed at the cell centres ofthe elements. The specific lamp geometry is also considered, taken into account from a view factor computation.In our model, we assume a constant filament temperatureand then a uniform source temperature. Thus the amountof radiation, reaching each front elements of the irradiatedsheet, is performed with the contour method using Stokestheorem [10]: 1FH p (5)ln r · d rH · d rrp2πSH ΓH Γrpwhere the subscripts H refers to the heater and p to thesheet front element under consideration, r is the distancebetween two elemental linear elements, issued from meshingthe entire heater boundary Γ H and Γrp for each surface ofcontrol element’s boundary reaching the irradiated sheet’sface. This contour method integration was chosen betweendifferent numerical view factor methods (Monte Carlo orgeometrical method). This method allows a good accuracywith a very low computational time. An efficient numericalmethod based on Gaussian quadrature has been applied inorder to perform the contour integration. The computation of
F.M. Schmidt et al. / Journal of Materials Processing Technology 143–144 (2003) 225–231the amount of incident radiation, for each surface element,is given in Eq. (6): SHΦ(rp ) kr FH rpελ (TFil )πL0λ (TFil ) dλ(6)Srp λwhere ελ is the spectral tungsten emissivity, TFil the filament temperature, L0λ the blackbody intensity, λ a givenwavelength between [0.2, 10] m and kr the efficiency factor of the ceramic reflector. In a first approximation, internalradiant heat transfer is assumed mono-dimensional acrossthe sheet thickness. The PS bulk temperature ( 450 K) isvery low in comparison to the source temperature (TFil 2000 K). Therefore, the assumption of cold material is convenient. This leads to express the transmitted flux acrossthe thickness of the material, for an homogenous and amorphous PS, using the Beer–Lambert’s law, if the coordinate ydescribe the thickness, we have, in a simple way, for the fluxΦλ (y) Φλ (y 0) e kλ y(7)where kr is the spectral absorption coefficient of our material.4. Discussion4.1. Model assessmentFirst of all, we proceed to a heating step of a white PSsheet during 70 s using one halogen lamp. The distancebetween the lamp and the sheet is 50 mm. It is to be notedthat in this case, the diaphragm is not taken into account.The dimensions of the sheet are the same as in Section2. The sheet is meshed using 2250 linear cubic elements(15 15 10). Fig. 6 shows characteristic back surfacetemperature distribution obtained by numerical simulation(a) and by experimental measurement (b). We obtained aqualitative agreement. More interesting is the temperaturevariation along the width and the height of the sheet from across-point located on the centre of the sheet (see Fig. 6a).The maximum relative error for the temperature distribution229Table 2Energy consumed by each lampEL 49.5188.5Table 3Energy consumed by each lampEL (kW)along width (Fig. 7a) is 2.5%. In this case, the agreementis fair. Moreover, the relative error in the case of the temperature distribution along height (Fig. 7b) increases from4% at the sheet centre up to 35% at the sheet border. Thisdiscrepancy is due to the mono-dimensional absorptionassumption in our model (see Section 3).4.2. Comparison between different emittersIn this section, we compare three different emitters: along wave infrared emitter (ELSTEIN 650 W), an averagewave infrared emitter (TQS 600 W) and a halogen lamps(PHILIPS 900 W) previously introduced in Section 2.We proceed to a heating step of 290 s for each emitterusing the experimental set-up described in Section 2. This isthe duration for the less efficient infrared emitter to achievea maximum temperature of 74 C. The aluminium polishsheet with an aperture (diaphragm) is placed between thepolystyrene sheet and the lamp in order to avoid geometriceffect. Then, the temperature evolution is recorded versustime at the sheet centre using the infrared camera (see Fig. 8).Then, we calculate a simple energetic criterionEL PL tL(8)where EL is the approximated energy consumed by eachlamp, tL the time required for each lamp to achieve the lessefficient infrared emitter maximum temperature, and PL theFig. 6. Back surface temperature distribution.
230F.M. Schmidt et al. / Journal of Materials Processing Technology 143–144 (2003) 225–231Fig. 7. Numerical and experimental temperature distribution along width (a) and along height (b).electrical power of each lamp. If we applied Eq. (8) to thecurves of Fig. 8a, we obtain the values refereed in Table 2.According to the criterion (Eq. (8)), the energy efficiencyof the halogen lamp is better than the long waves infraredemitters (i.e. ELSTEIN lamp). In addition, the PHILIPSlamp efficiency should be improved in comparison to that ofthe TQS lamp. For that, an aluminium reflector (IRZ 1000)has been placed in the back of the halogen lamp in order toincrease radiant heat flux. In Fig. 8b, the temperature evolutions of the different lamps are plotted versus time. Again,we calculate the energy consumed by each lamp (Table 3).Due to the presence of the aluminium reflector, the halogen lamp has now the best energy efficiency (i.e. lower energy consumed).
F.M. Schmidt et al. / Journal of Materials Processing Technology 143–144 (2003) 225–231231Fig. 8. Recorded temperature vs. time at the sheet centre.5. ConclusionReferencesAn experimental set-up has been developed in orderto measure the back surface temperature distribution of apolystyrene sheet using an infrared camera and has permitted to compare the energy efficiency of three different emitters (TQS, ELSTEIN, PHILIPS). The comparisons, basedupon a simple energetic criterion, allow demonstrating thatthe halogen lamp has the best energy efficiency. These preliminary results will be further improved and extended toother polymers, and particularly to polypropylene (PP).A 3D numerical model using control volume method hasbeen developed to simulate the heating stage and then validated by comparisons with experimental data. This numerical model has to be improved in order to take into accountthe transmitted flux across the thickness without geometricassumptions (i.e. Beer–Lambert mono-dimensional law).[1] A. Illig, Pratique du thermoformage (in French), HERMES SciencePublications, Paris, 1999, pp. 151–184.[2] J.L. Throne, in: Two-Day Seminar on Thermoforming Process and Design, Basel, Switzerland, Technomic Publisging AG,1998.[3] J.-C. Jammet, Thermoformage, Techniques de l’ingénieur (in French),vol. AM3, AM3660, 1997.[4] S. Monteix, F. Schmidt, Y. Le Maoult, in: Experimental Studyand Numerical Simulation of Sheet and Tubular Preform InfraredHeating, QIRT 2000, Eurotherm Seminar No. 64, Reims, France,2000.[5] S. Monteix, F. Schmidt, Y. Le Maoult, G. Denis, M. Vigny, in:Recent Issues in Preform Radiative Heating Modelling, PPS 2001,Montreal, 2001.[6] M. Petterson, Heat transfer and energy efficiency in infrared papersdryers, Ph.D. Thesis, Lund University, Sweden, 1999.[7] K. Esser, E. Haberstroh, U. Hüsgen, D. Weinand, Infrared radiationin the processing of plastics: precise adjustment—the key to productivity, Adv. Polym. Technol. 7 (1987) 89–128.[8] T. Miyanaga, Y. Nakano, Analysis of Infrared Radiation Heatingof Plastics, Central Research Institute of Electric Power Industry,Tokyo, Japan, 1990.[9] S.V. Patankar, Numerical Heat Transfer and Fluid Flow,McGraw-Hill, New York, 1980.[10] R. Rammohan, Efficient evaluation of diffuse view factors for radiation, Int. J. Heat Mass Transf. 39 (6) (1996) 1281–1286.AcknowledgementsPHILIPS LIGHTING and EDF-RENARDIERE Companies support this work. Special thanks go to R. Anbari forhis help on the experiments.
In most of the thermoforming machines, the heating step is performed using an infrared oven constituted of long waves infrared emitters (3-5 m spectral bandwidth). The goal of this study is to determine the efficiency of short waves infrared emitters (halogen lamps) for the heating step (0.76-2 m spectral bandwidth) in the thermoforming .