Transcription
THE SALESFORCE MARKETING CLOUDSOCIAL ENGAGEMENTBENCHMARK REPORTMetrics from 3 Million Twitter* MessagesSent Through Our Platform*All trademarks, service marks, and trade names arethe property of their respective owners.
Table of ContentsBenchmark Data3Recommendations21About the Data23Appendix24exacttarget.com2 Social Engagement Benchmark Report: TwitterFacebookTwitter Engagementsalesforce.com/marketingcloudBenchmark Report2
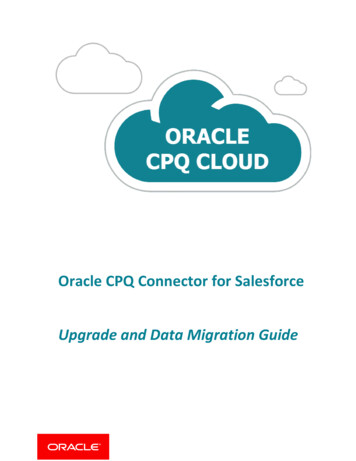
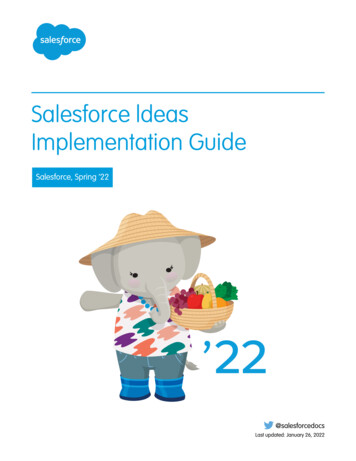
Benchmark DataEight years ago, a tech company forever changed the meaning of the word “tweet.” Now, you canuse Twitter to change the way your customers experience your brand.Since its launch in 2006, Twitter has matured into the social networkof choice for breaking news, early tech adopters, power influencers,and brands looking to engage with the growing number of Twitterusers. The size of Twitter’s user base and the platform’s ability toscale globally are encouraging an increasing number of brands tobuild a Twitter presence, 140 characters at a time.Twitter’s self-proclaimed mission is “to give everyone the power tocreate and share ideas and information instantly.”1 Millions of peopleand companies are taking advantage of that power and connectingTwitter with the customer journey, as these statistics show: As of August 2014, Twitter reported 271 million monthlyactive users.2 500 million tweets are sent per day and 78% of Twitter activeusers are on mobile.3 Seventy-two percent of Twitter users said they were morelikely to make future purchases from brands they follow orengage with on Twitter.4Twitter offers a wealth of ways for brands and customers to connect.The research conducted for this report, based on 3 million tweetssent from our platform, unearthed several key findings.Consumers gravitate towards tweets that include photos. Brandsand companies tweet photos only 8% of the time, although tweetscontaining a photo generate considerably higher reply and retweetvolumes than those without photos. On average, tweets containingphotos received 3.3 replies, while non-photo tweets received only1.7 replies. Consumers are more than twice as likely to retweet asalesforce.com/marketingcloudphoto tweet: on average, nine consumers will retweet a photo tweetcompared to five for a non-photo tweet. See the “Recommendations”section (p. 21) for more data on photo-based tweets.Follower numbers are trending up. In 2013, companies trackedan average 43% increase in Twitter followers, with four industriestracking percentages higher than the average: technology andmanufacturing (93%), retail and e-commerce (75%), CPG (55%), andfinancial services (55%).Few brands tweet on Sundays—the day with the highestengagement. During the work week, companies tweet the leastfrequently on Mondays and tweet more as the week goes on.Interestingly, companies aren’t engaging followers much duringweekends, although their followers continue to engage them:Sundays garner the most retweets and replies to brands, but thefewest companies tweet on Sundays.The charts in this report depict Twitter engagement rates by day ofweek, month, time of day, and industry, combining both paid andorganic tweets. Data collected across all industries represents morethan 3.6 million tweets from companies in 15 industries. Read ourrecommendations at the end of this report for data-inspired marketingtactics tailoring these findings to your strategy. See “About the Data” onp. 23 for further detail on graphed data.The data in this report shows the average number of replies andretweets per tweet that was sent in a given industry or time period.For example, on average, a tweet from a CPG brand garners 2.2replies and 8.8 retweets.Social Engagement Benchmark Report: Twitter3
Twitter Engagement Rates per Tweet by IndustryCPGMedia andEntertainmentFinancialServicesRetail andE-CommerceEducation andNon-ProfitTech andManufacturingTravel andHospitalityAverage Replies2.27.71.73.02.81.91.8Average Retweets8.823.617.111.515.34.05.6Includes paid and organic postsTweets Sent by IndustryEach icon 10 thousand tweets.39k47kConsumer Packaged Goods (CPG)Education and Non-Profit199k269kMedia and EntertainmentTech and Manufacturing94kFinancial Services303k287kTravel and HospitalityRetail andE-Commerce4Social Engagement Benchmark Report: Twittersalesforce.com/marketingcloud
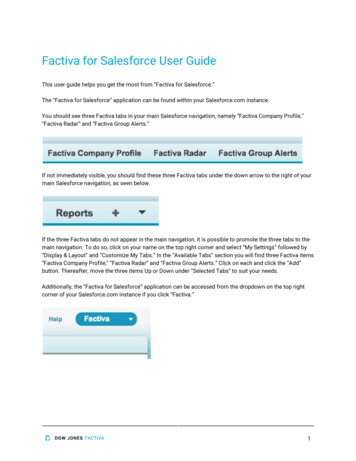
Twitter Engagement Rates per Tweet by Month: All IndustriesTweets SentAvg RepliesAvg Tweets Sent by .0K287.9K358.3K311.6K259.8KIncludes paid and organic postssalesforce.com/marketingcloudSocial Engagement Benchmark Report: Twitter5
Twitter Engagement Rates per Tweet by Day of Week: All IndustriesTweets SentAvg RepliesAvg 21.9SAT356.3K4.726.7Tweets Sent by Day of Week356.3K350.4K598.5K566.6K588.7K594.4KIncludes paid and organic posts588.0KTweets Sent by Time of DayTwitter Engagement Rates per Tweet by Time of Day (CST): All IndustriesTweets SentAvg RepliesAvg Retweets12 AM - 4 AM507.3K5.634.74 AM - 8 AM248.8K3.929.78 AM - 12 PM364.4K3.118.312 PM - 3 PM557.9K3.720.03 PM - 6 PM735.4K4.522.16 PM - 9 PM688.7K4.823.29 PM - 12 AM540.4K4.927.3Includes paid and organic posts6Social Engagement Benchmark Report: alesforce.com/marketingcloud
Twitter Engagement Rates per Tweet by Month: CPGTweets Sent by MonthTweets SentAvg RepliesAvg 3.3K3.9K3.5K3.4KIncludes paid and organic postssalesforce.com/marketingcloudSocial Engagement Benchmark Report: Twitter7
Twitter Engagement Rates per Tweet by Day of Week: CPGTweets SentAvg RepliesAvg Tweets Sent by Day of Week2.7K2.2K6.8K7.0K6.2K5.9KIncludes paid and organic posts7.8KTwitter Engagement Rates per Tweet by Time of Day (CST): CPGTweets Sent by Time of DayTweets SentAvg RepliesAvg Retweets12 AM - 4 AM4.8K2.39.94 AM - 8 AM2.1K2.08.68 AM - 12 PM3.5K1.64.812 PM - 3 PM6.1K1.611.73 PM - 6 PM9.3K2.07.16 PM - 9 PM8.3K2.68.39 PM - 12 AM4.5K2.712.4Includes paid and organic posts8Social Engagement Benchmark Report: marketingcloud
Twitter Engagement Rates per Tweet by Month: Media and EntertainmentTweets SentAvg RepliesAvg K7.524.2NOV14.7K9.526.1DEC14.5K8.821.0Tweets Sent by 18.7K17.5K18.6KIncludes paid and organic postssalesforce.com/marketingcloudSocial Engagement Benchmark Report: Twitter9
Twitter Engagement Rates per Tweet by Day of Week: Media and EntertainmentTweets SentAvg RepliesAvg AT21.5K8.127.0Tweets Sent by Day of Week21.5K33.3K29.8K31.0K34.0KIncludes paid and organic posts29.9KTweets Sent by Time of DayTwitter Engagement Rates per Tweet by Time of Day (CST): Media and EntertainmentTweets SentAvg RepliesAvg Retweets12 AM - 4 AM33.4K10.626.84 AM - 8 AM6.4K8.629.68 AM - 12 PM10.2K5.011.412 PM - 3 PM26.7K5.817.33 PM - 6 PM39.5K7.926.26 PM - 9 PM43.0K7.423.69 PM - 12 AM39.0K8.121.7Includes paid and organic posts1018.8KSocial Engagement Benchmark Report: e.com/marketingcloud
Twitter Engagement Rates per Tweet by Month: Financial ServicesTweets SentAvg RepliesAvg 1.69.8DEC11.8K1.55.5Tweets Sent by 8.7KIncludes paid and organic postssalesforce.com/marketingcloudSocial Engagement Benchmark Report: Twitter11
Twitter Engagement Rates per Tweet by Day of Week: Financial ServicesTweets SentAvg RepliesAvg K1.53.1Tweets Sent by Day of Week6.4K17.1K15.3K17.6K16.6K14.9KIncludes paid and organic postsTweets Sent by Time of DayTwitter Engagement Rates per Tweet by Time of Day (CST): Financial ServicesTweets SentAvg RepliesAvg Retweets12 AM - 4 AM15.4K10.324.04 AM - 8 AM8.3K8.125.98 AM - 12 PM7.1K4.610.512 PM - 3 PM12.3K5.615.03 PM - 6 PM17.5K7.520.56 PM - 9 PM18.6K6.820.29 PM - 12 AM14.8K7.217.1Includes paid and organic posts12Social Engagement Benchmark Report: orce.com/marketingcloud
Twitter Engagement Rates per Tweet by Month: Retail and E-CommerceTweets SentAvg RepliesAvg .5NOV33.1K3.513.7DEC41.9K4.127.1Tweets Sent by 23.6K24.0K 21.2KIncludes paid and organic postssalesforce.com/marketingcloudSocial Engagement Benchmark Report: Twitter13
Twitter Engagement Rates per Tweet by Day of Week: Retail and E-CommerceTweets SentAvg RepliesAvg 36.3K2.510.1Tweets Sent by Day of Week39.8K36.3K41.9K48.9K46.2K44.7KIncludes paid and organic posts45.6KTweets Sent by Time of DayTwitter Engagement Rates per Tweet by Time of Day (CST): Retail and E-CommerceTweets SentAvg RepliesAvg Retweets12 AM - 4 AM40.1K2.98.84 AM - 8 AM24.2K2.28.08 AM - 12 PM34.2K2.311.212 PM - 3 PM47.0K2.611.53 PM - 6 PM59.2K3.814.76 PM - 9 PM53.1K3.411.29 PM - 12 AM45.6K3.311.0Includes paid and organic posts45.6K40.1K53.1K24.2K34.2K59.2K47.0K14Social Engagement Benchmark Report: Twittersalesforce.com/marketingcloud
Twitter Engagement Rates per Tweet by Month: Education and Non-ProfitTweets SentAvg RepliesAvg 5.4K3.124.8DEC4.6K2.914.0Tweets Sent by .8KIncludes paid and organic postssalesforce.com/marketingcloudSocial Engagement Benchmark Report: Twitter15
Twitter Engagement Rates per Tweet by Day of Week: Education and Non-ProfitTweets SentAvg RepliesAvg .115.5Tweets Sent by Day of Week4.9K4.3K6.7K7.9K7.4K7.8KIncludes paid and organic posts7.7KTweets Sent by Time of DayTwitter Engagement Rates per Tweet by Time of Day (CST): Education and Non-ProfitTweets SentAvg RepliesAvg Retweets12 AM - 4 AM6.1K2.617.64 AM - 8 AM4.0K3.622.68 AM - 12 PM4.7K3.425.512 PM - 3 PM7.2K3.012.73 PM - 6 PM9.7K2.820.66 PM - 9 PM8.4K2.59.69 PM - 12 AM6.5K2.712.8Includes paid and organic posts16Social Engagement Benchmark Report: marketingcloud
Twitter Engagement Rates per Tweet by Month: Technology and ManufacturingTweets SentAvg RepliesAvg V31.5K1.54.1DEC24.9K1.74.9Tweets Sent by 25.8K22.9K21.1KIncludes paid and organic postssalesforce.com/marketingcloudSocial Engagement Benchmark Report: Twitter17
Twitter Engagement Rates per Tweet by Day of Week: Technology and ManufacturingTweets SentAvg RepliesAvg 1.93.9Tweets Sent by Day of Week15.6K43.4K43.9K50.3K47.7KIncludes paid and organic posts53.6KTwitter Engagement Rates per Tweet by Time of Day (CST): Technology and ManufacturingTweets SentAvg RepliesAvg Retweets12 AM - 4 AM30.1K1.43.94 AM - 8 AM19.7K1.73.28 AM - 12 PM27.1K1.93.212 PM - 3 PM40.1K1.74.13 PM - 6 PM60.3K2.34.16 PM - 9 PM52.3K2.03.99 PM - 12 AM39.1K1.84.3Includes paid and organic posts1814.2KSocial Engagement Benchmark Report: TwitterTweets Sent by Time of om/marketingcloud
Twitter Engagement Rates per Tweet by Month: Travel and HospitalityTweets SentAvg RepliesAvg V28.6K1.65.2DEC29.8K1.55.5Tweets Sent by 26.2K27.0K25.7KIncludes paid and organic postssalesforce.com/marketingcloudSocial Engagement Benchmark Report: Twitter19
Twitter Engagement Rates per Tweet by Day of Week: Travel and HospitalityTweets SentAvg RepliesAvg 1.55.4Tweets Sent by Day of Week36.5K26.5K40.4K44.3K46.2K47.1KIncludes paid and organic posts46.0KTweets Sent by Time of DayTwitter Engagement Rates per Tweet by Time of Day (CST): Travel and HospitalityTweets SentAvg RepliesAvg Retweets12 AM - 4 AM50.9K1.67.34 AM - 8 AM36.5K1.74.98 AM - 12 PM40.0K2.35.712 PM - 3 PM34.7K1.74.53 PM - 6 PM47.2K1.75.36 PM - 9 PM40.7K1.86.19 PM - 12 AM36.9K1.67.0Includes paid and organic posts50.9K36.9K36.5K40.7K40.0K47.2K34.7K20Social Engagement Benchmark Report: Twittersalesforce.com/marketingcloud
RecommendationsWith the right strategy, every tweet can become a valuable moment in the customer journey.Based on our benchmark findings, consider these insights to helpguide your Twitter strategy toward improved ROI and greater results.Overall RecommendationsPhotos incite higher rates of Twitter engagement. Tweets withphotos receive more replies and retweets than text-only tweets.Twitter Engagement Rates: Photo vs. Text liesCPG10.88.33.32.0Media .713.64.81.5Retail andE-Commerce26.48.58.02.5Education andNon-Profit18.914.83.82.7Tech andManufacturing6.43.72.91.8Travel andHospitality9.05.03.31.7Photo tweets encourage the user to click through and view a photo,which is a direct request for further engagement. Apply that principleto other tweets by including links to engaging content, while makingsure that all content you tweet is mobile-optimized, given that 78% ofmonthly active Twitter users access the network via mobile device.Designate someone to oversee Twitter every day, during allhours of the day. Our data shows that Twitter users are just asengaged outside of normal work hours as they are during the typical9–5 period. Consider how your brand might implement a round-theclock Twitter strategy, designating “on-call” Twitter managers (or onemanager) to oversee the Twitter customer journey at every momentof the day, depending on tweet volume and resources.Brands should align their Twitter strategy with their ownindustry. If there’s anything these numbers prove, it’s that Twitterstrategy isn’t one-size-fits-all. The media and entertainment, financialservices, and education and non-profit industries receive the mostretweets per tweet (23.6, 17.1, and 15.3, respectively), while the mostreplies go to media and entertainment, retail and e-commerce, andeducation and non-profit (7.7, 3.0, and 2.8, respectively).The bottom line: different industries perform better in different areasof engagement, and few industries rank highly in every engagementformat. Your customers may be more interested in retweeting yourcontent to their followers than replying, or they may rely on yourTwitter account for quick replies to help them solve problems.Regardless of your product or industry, it should be your goal to fillthe exact niche your customers need.Includes paid and organic postssalesforce.com/marketingcloudSocial Engagement Benchmark Report: Twitter21
Recommendations by Industry Consumer packaged goods (CPG): Customers who followCPG brands are most likely to reply and retweet your messagesbetween 9:00 p.m. and 12:00 a.m., so focus your attention onthis window of time. CPG brands will get the most retweets onSaturdays with more than double the activity of any other day ofthe week. Interestingly, photo tweets garner the most retweetsfor CPG brands with a dramatic peak in photo retweetson Wednesdays. Media and entertainment: Twitter followers of media andentertainment brands are highly engaged throughout the year.We see the most company tweets and consumer retweets onSaturdays and Sundays, followed closely by Thursdays—perhapsindicating that media and entertainment customers are the mostengaged with companies on Twitter during weekend activities.Focus on these days as your largest window of opportunity toconnect with Twitter followers. Financial services: Prime times to reach consumers whofollow financial services companies are from 12:00 a.m. to8:00 a.m. (the period with the most replies and retweets tocompany tweets) and from 6:00 p.m. to 9:00 p.m. (the secondhighest period for retweets). Mondays and Tuesdays are whenconsumers are most likely to retweet brands in this industry.Photos do especially well for retweets in the financial servicesindustry (see chart on preceding page). Retail and e-commerce: Given retail brands’ propensity forholiday marketing, it comes as no surprise that December seesthe most tweets from retail brands, with the number of tweetssteadily increasing from October through the end of the year.Consumers responded in December by nearly doubling theamount of replies. Consumers are most engaged with brands22Social Engagement Benchmark Report: Twitteron Thursdays and Fridays, so brands in this industry have aunique opportunity to capture consumer attention before theymake plans for weekend shopping trips. Although consumers areconsistently engaging with brands throughout the day, we see apeak from 3:00 p.m. to 6:00 p.m. Think about your brand’s uniquepeak shopping times when planning a Twitter content strategy. Education and non-profit: Education and non-profitorganizations get more consumer retweets than most otherindustries. Capitalize on this higher retweet rate by tweeting onweekends and in the morning hours (4:00 a.m. to 12:00 p.m.)—times when more consumers are engaged with education andnon-profit Twitter accounts. Technology and manufacturing: We tracked 93% followergrowth for technology and manufacturing brands over 2013,making this industry one of the fastest-growing on Twitter. Twitterusers and tech brands are a perfect match, as Twitter officiallylaunched in 2007 at the tech conference South by Southwest,with techies and early adopters alike swiftly embracing Twitter.However, tech and manufacturing brands are currently seeinglow rates of Twitter engagement. Consider superchargingtweet content with infographics, videos, and photos to boostengagement and provide further Twitter value within thecustomer journey. Travel and hospitality: Twitter marketers in travel and hospitalityare sending a relatively high number of tweets but seeingrelatively low engagement. Brands can foster more engagementby sending photo-based tweets to their followers, as consumersare more than twice as likely to retweet and reply to a phototweet. Additionally, followers of travel and hospitality brands aremore likely to retweet on Mondays and Thursdays and betweenthe hours of 9:00 p.m. to 4:00 a.m.salesforce.com/marketingcloud
About the DataWe collected the data in this report from the Salesforce Marketing Cloud platform according to thefollowing specifications.We extracted Twitter data from more than 3.6 million Twittermessages published through our platform in 2013, combining bothpaid and organic posts. We added further social insights from the2014 State of Marketing report and third-party studies as noted.Graphs combining overall industry data include these industries:Advertising and Consulting; Automotive; Clothing and Fashion;Consumer Packaged Goods; Media and Entertainment; FinancialServices; Food and Beverage; Retail and eCommerce; Health andBeauty; Education and Non-Profit; Publishing; Sports; Technologyand Manufacturing; Telecommunications; and Travel and Leisure.When reviewing pie-style charts in this report, note that numericallabels on pie charts show rounded values, and pie slices representtotal values.Let data help youlead the journey.salesforce.com/marketingcloudSocial Engagement Benchmark Report: Twitter23
Appendix(1) about.twitter.com/company(2) about.twitter.com/company(3) about.twitter.com/company(4) ocial Engagement Benchmark Report: Twittersalesforce.com/marketingcloud
Journey Builder empowers marketers to deliver exceptional,personalized customer experiences at scale. CMOs, digitalmarketers and customer experience teams use it to plan,personalize and optimize real-time 1:1 customer journeys acrossany channel or device. See how far you can go with the world’smost powerful 1:1 digital marketing platform.Salesforce Marketing Cloud empowers your business to: Build a single view of your customer Automate real-time customer journeys Connect to your customers with personalized content on anychannel or device Make the most of your data Build on the most trusted platformsLearn more about Journey Buildersalesforce.com/marketingcloud
Twitter offers a wealth of ways for brands and customers to connect. The research conducted for this report, based on 3 million tweets sent from our platform, unearthed several key findings. Consumers gravitate towards tweets that include photos. Brands and companies tweet photos only 8% of the time, although tweets