Transcription
Elliott WaveTheoryQuick Start GuideTraders Day Trading .comLearning about the Stock Market for Beginners &How to Start Day Trading Successfully!
Elliott Wave TheoryQuick Start GuideTraders Day Trading .comPrefacePagePage 2This eBook is an original publication fromTradersDayTrading.comA trader’s guide toLearning about the Stock Market for Beginners & How to Start Day Trading – Successfully!Visit us at our website to learn more about Elliott Wave Theory and much more.Copyright Copyright 2010: The content of this eBook is copyrighted material and is protected under the USCopyright Act of 1976 and all other applicable international, federal, state and local laws.All rights are reserved.You may freely distribute this eBook, provided all content including text, author credits, active linksand the copyright note remain intact.TradersDayTrading.com – Learning about the Stock Market for Beginners& How to Start Day Trading, Successfully!
Elliott Wave TheoryQuick Start GuideTraders Day Trading .comPagePage 3Table of Contents1. Front Page2. Preface3. Table of Contents4. An introduction to Elliott Wave Theory5. The Origins of The Elliott Wave Principle6. The Elliott Wave Theory - Basic Principle7. Impulse Waves8. Impulse Waves (continued)9. Corrective Waves10.Elliott Wave Triangles11.Elliott Wave and Fibonacci12.Application of Elliott Wave Theory13.Test Your Knowledge14. Learn More about Elliott Wave Theory15. Disclaimer, Copyright and Distribution RightsTradersDayTrading.com – Learning about the Stock Market for Beginners& How to Start Day Trading, Successfully!
Elliott Wave TheoryQuick Start GuideTraders Day Trading .comAn Introduction to Elliott Wave TheoryWhat is Elliott Wave TheoryPagePage 4Elliott Wave Theory is a commonly used form of technical analysis that is applied to stock marketcharts for the purposes of forecasting the future direction of prices.The Elliott Wave Principle is founded upon the concept that stock market price movements are not aresult of the latest news headline, but are in fact a direct product of the mass psyche of the marketparticipants.How many times do we see the market drop on supposedly ‘good’ news, or a stock’s price rise onthe announcement of some pretty disastrous results? Of course, the talking heads will always find anangle to explain away these discrepancies, ‘results were not as bad as expected’ or somethingsimilar, that is their job after all.For a technical analyst it is not the news that matters, or even the numbers in those results, it is themarket’s reaction to them that is the only thing that matters. Applying Elliott Wave theory is thestudy of the stock markets price data in the search for recognisable patterns in the behavior of themarkets prices. These price patterns can enable an Elliott Wave analyst to assess whether prices arelikely to rise or fall - ahead of the event.Elliott Wave Theory – an Invaluable Tool for Successful TradingAll technical analysis is based upon these cycles of mass human behaviour that is reflected in themovements of a stock’s price. Elliott Wave analysis is unlike most other forms of analysis in that it ispossible for an analyst to understand exactly where prices are within that cycle at any given point intime.This knowledge is invaluable to traders and investors, as using other forms of technical analysis suchas traditional support and resistance methods can tell traders where support is, but how do theyknow whether to expect that support to hold or break? Proper application of Elliott Wave Theorycan help them substantially increase successful trade results by helping them to assess theprobabilities of that support holding or breaking.Successful trading is about limiting risk and reducing losses incurred from bad trades. Byunderstanding where prices are in the Elliott Wave cycle, traders have a unique tool available tothem in their efforts to find low risk and high yielding entry and exit points for their trading.TradersDayTrading.com – Learning about the Stock Market for Beginners& How to Start Day Trading, Successfully!
Elliott Wave TheoryQuick Start GuideTraders Day Trading .comThe Origins of the Elliott Wave PrincipleThe Wave Principle was developed in the 1930’s by Ralph Nelson Elliott who had the view that:PagePage 5“Because, man is subject to rhythmical procedure, calculations having to do with hisactivities can be projected far into the future with a justification and certainty heretoforeunattainable.”A distinguished accountant to trade, Elliott suffered from periods of ill health and at a time ofhistorical stock market activity, spent much of his time studying the movements of the stock marketto occupy his mind. He observed that the markets often appeared to move in recurring andrecognisable patterns.R.N. ElliottElliott studied the charts of a number of stock market indexes spanning 75 years at various degreesof time, from Yearly down to 30mins. What he discovered was that these patterns were repetitiveand took the form of interlinking ‘waves’. These waves then went on to develop into larger waveswith similar patterns.RN Elliott’s work remained relatively unknown until the 1970s when A.J. Frostand Robert Prechter Jr. published Elliott Wave Principle which is now widelyregarded as the definitive guide to Elliott Wave Theory. It has since becomeone of the most popular and commonly used technical analysis tools.Robert Prechter Jr. then went on to create the world’s largest stock marketforecasting service, Elliott Wave International (EWI).Robert Prechter JrElliott Wave International’s team of analysts provide forecasts for every major market in the worldand through their free to join, Club EWI membership, offer an impressive range of very good qualityeducational materials such as videos, special reports, webinars.etc. Club EWI membership alsogives you access to a free Elliott Wave basics tutorial (50 pages) which covers all the basics in moredetail than we can in this “Elliott Wave Theory – Quick Start Guide” eBook.TradersDayTrading.com – Learning about the Stock Market for Beginners& How to Start Day Trading, Successfully!
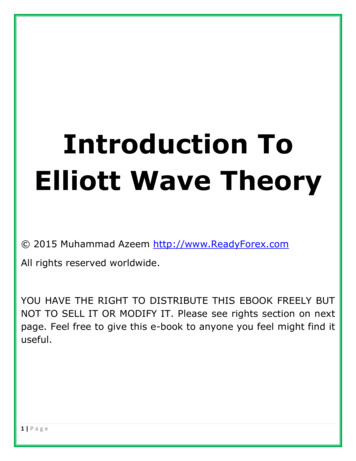
Elliott Wave TheoryQuick Start GuideTraders Day Trading .comThe Elliott Wave Theory Basic PrincipleWe have all heard the phrase ‘one step forward and two steps back’ to describe a situation wherePagePage 6 we feel as though we are going nowhere, or achieving nothing.R.N. Elliott’s observations were that as the market progresses, prices tend to ebb and flow in wavelike moves. Impulsive, flowing moves would consist of 5 waves followed by an ebbing back, in amore corrective period where prices seem to struggle to get anywhere, and consisting of 3 waves.Each wave then develops within part of a larger cycle. The complete cycle is composed by those 2parts and each cycle is part of an ever expanding matrix of interlinking cycles of various degrees oftrend.Chart Courtesy of Elliott Wave InternationalIn the basic wave formation, impulsive waves are labelled with the numbers 1,2,3,4,5, andcorrective waves are labelled with the letters a,b,c.As we can see in the chart above, impulsive waves will gain a lot of ground whereas in correctivewaves, prices tend to struggle to get anywhere. Corrective waves are more of a sidewaysconsolidation or range bound move that occurs when the market wants to hold on the price levelsthat have been gained.It is important to remember that these charts are showing 5 waves up and 3 waves down as in apositive market, but impulsive waves can also occur when markets are declining. An impulsive movein a declining market will take the form of 5 waves down and 3 waves up.TradersDayTrading.com – Learning about the Stock Market for Beginners& How to Start Day Trading, Successfully!
Elliott Wave TheoryQuick Start GuideTraders Day Trading .comImpulse WavesImpulse WavesPagePage 7Impulse waves are powerful moves composed of 5 sub waves that drive the market in the directionof the larger trend. Within the larger impulse wave, the 5 waves subdivide into 5,3,5,3,5 formationsand are labelled 1,2,3,4,5.Waves 1,3 and 5 are the impulse waves and are powerful, driving moves which are interrupted bythe waves 2 and 4 which are corrective and consolidating phases, creating the wave like structure.An impulse wave itself, always subdivides into 5 waves to a lesser degree, so the important factorfor an Elliott Wave analyst in recognising that the trend has reversed, is to be able to count 5 wavesin the internal sub divisions of the move.Wave construction is always the most important factor in wave recognition so let’s have a closerlook at the subdivisions within an impulse wave.Wave 1 (Impulse)First waves subdivide into 5 smaller waves and can be either, slow and steady, grinding away andrelentlessly moving against the trader convinced the previous trend is still underway, or they can besharp and decisive blowing those traders out of the water.First waves can also take the form of a Leading Diagonal which involves an overlap of waves 2 and 4but these must still subdivide into 5,3,5,3,5 structures.TradersDayTrading.com – Learning about the Stock Market for Beginners& How to Start Day Trading, Successfully!
Elliott Wave TheoryQuick Start GuideTraders Day Trading .comImpulse WavesWave 2 (Corrective)PagePage 8Second waves subdivide into 3 smaller waves and are often sharp and deep, retracing much of thegains of wave 1.Within second waves, many traders are still convinced that the previous trend is still in effect.Generally speaking, second waves will be very deep and are most likely to retrace much of the firstwave if that was a slow grinding move. Very sharp and powerful first waves can lead to a veryshallow wave 2.Wave 2s never retrace more than 100% of wave 1. If prices move beyond the origin of wave 1, it is aclear signal to the Elliott Wave analyst that his analysis is wrong.Wave 3 (Impulse)Third waves subdivide into 5 smaller waves and are typically the largest and most powerful wave.These waves occur on high volume and are broad ranging with mass participation as the new trendbecomes clear. Wave 3s are never the shortest impulse wave and are the most likely to extend.Wave 4 (Corrective)Fourth waves subdivide into 3 smaller waves and are often very complex moves. These tend to besideways and range bound moves frustrating bulls and bears.Wave 5 (Impulse)Fifth waves subdivide into 5 smaller waves and are distribution phases. These usually display aweakening of the trend in prices, breadth and volume. They can be long and drawn out phases asthe market tops or bottoms, but at times they can be very sharp ‘spike’ like moves.Fifth waves can take the form of an Ending Diagonal and involves the overlap of waves 2 and 4 butthey differ from a Leading Diagonal which can appear in the wave 1 position, in that they subdivideinto a 3,3,3,3,3 construction.TradersDayTrading.com – Learning about the Stock Market for Beginners& How to Start Day Trading, Successfully!
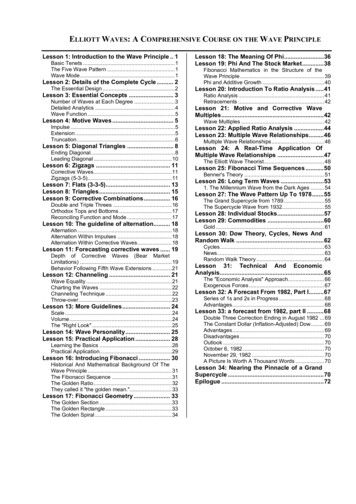
Elliott Wave TheoryQuick Start GuideTraders Day Trading .comCorrective WavesCorrective WavesPagePage 9Corrective waves retrace part of the previous trend but never move beyond the origin of theprevious impulse wave. In other words wave 2 never breaks the origin of wave 1 and wave 4 neverbreaks the origin of wave 3.Waves 2 and 4 within an impulse, and A,B,C are corrective wavesThe different types of corrective waves are a Zigzag, Flat, Triangle or a n WavesCombinations can occur when a corrective wave has not metits price target or needs to extend in time. Typicalcombination waves are double 3’s or triple 3’s where acombination of zigzags or flats, are joined together by an ‘X’wave. ‘X’ waves are 3 wave corrective moves.Double 3’s are labelled W,X,Y each of which can be a zigzag ora flat. W and Y are two 3 wave moves connected by the Xwave.Triple 3’s are labelled W,X,Y,X,Z each of which can be a zigzagor a flat. W,Y and Z are the Three 3’s connected by the Two X waves. The final wave in acombination can also be a triangle. E.g. A very shallow double 3 (WXY) could consist of a Flat (abc)for W and a Zigzag (abc) for X, ending in a Triangle (abcde) for Z.TradersDayTrading.com – Learning about the Stock Market for Beginners& How to Start Day Trading, Successfully!
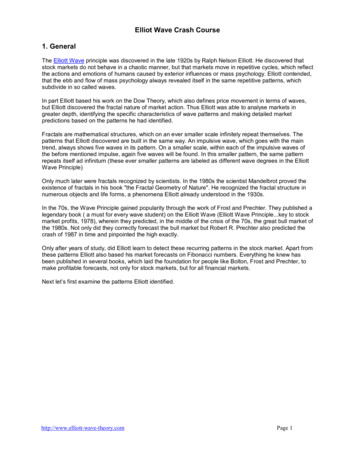
Elliott Wave TheoryQuick Start GuideTraders Day Trading .comElliott Wave TrianglesPagePage 1010Elliott Wave TrianglesAs with all Elliott Wave identification, the internal wave formationis the most important factor in identifying Triangles in Elliott WaveTheory. Triangles subdivide into 3,3,3,3,3 and are labelleda,b,c,d,e. In other words, each internal wave subdivides into a 3.It is important to remember that Elliott Wave triangles are notdetermined by shape, contracting price action in a convergingtriangular shape does not necessarily mean that it is an ElliottWave Triangle.A very common mistake we have found is that most of theformations that we see purported by analysts to be an Elliott WaveTriangle are not actually valid. We believe that this is throughwishful thinking rather than through reasoned analysis.An Elliott Wave Theory Triangle is a particularly special feature as they can only appear at certainpoints in the cycle. This means that they can be extremely good guide in confirming to the technicalanalyst where we are at that particular point in the cycle. The reliability offered by the price actionfollowing these patterns can lure to the analyst to see what he wants to see rather than what isactually there.“What we see depends mainly on what we look for.” (John Lubbock)Triangle Positioning in Elliott Wave TheoryA genuine Elliott Wave Triangle will only appear in the charts in certain positions within the cycle.They always occur in a position prior to the final wave in a move or as the final wave within acombination as mentioned earlier. Wave 4B waveX wave (final X wav
Elliott Wave Theory is a commonly used form of technical analysis that is applied to stock market charts for the purposes of forecasting the future direction of prices. The Elliott Wave Principle is founded upon the concept that stock market price movements are not a result of the latest news headline, but are in fact a direct product of the mass psyche of the market participants. How many .