Transcription
The most understandableexplanation of the Elliott WaveTheory you will ever findAnd how to use it to become a consistentlyprofitable stock market investorby Ryan Henry from TrendLizard.com
What is the Elliott Wave Theory?The Elliott Wave Theory is a stock market investment strategy thatdetermines if a potential investment is in a sustainable (and thereforetradable) trend. The theory is based on the fact that when you get abunch of people together (the stock market is, after all, just a bunch ofpeople), they take on a mob or herd mentality.Everyone who ever analyzed a stock or any other potential investmentwants to know only one thing. They want to know where the price of theinvestment – stock, real estate, whatever - is going to go. If they canconsistently find a way to identify the investments that are going toincrease in value, then they will be a successful investor.There are a lot of different strategies investors useto try to identifyinvestments that will go up. For example, a lot ofinvestors look at thefinancial statements of a company to determine if that company ismaking an increasing amount of money every quarter (amonghundreds of other financial health statistics).A herd mentality is when people in a group tendto act similarly to oneanother. It’s been proven thatherd behavioris real, repetitive, andpredictable.The predictable and repetitive nature of herd mentality can be found intrends in birth rates, changes in fashion, or the types of movies that aremost popular at any given point in time. The Elliott Wave Theoryapplies this concept to the stock market. It tries to identify where thestock market is in the predictable, repetitive pattern that is created byherd mentality.Sometimes, the stocks of companies who are making an increasingamount of money go up. Sometimes, the stock price has alreadyaccounted for the growth in earnings so the stock price doesn’t go up.Short of having information that others don’t already have, it’s difficultto look at companies financial statistics and consistently find winninginvestments.
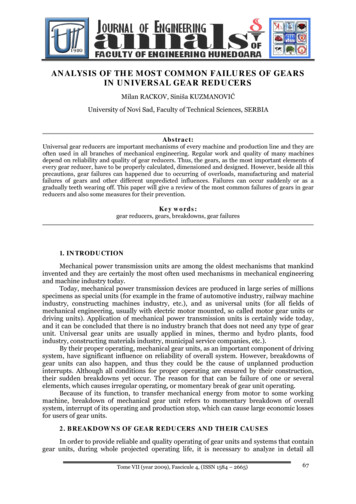
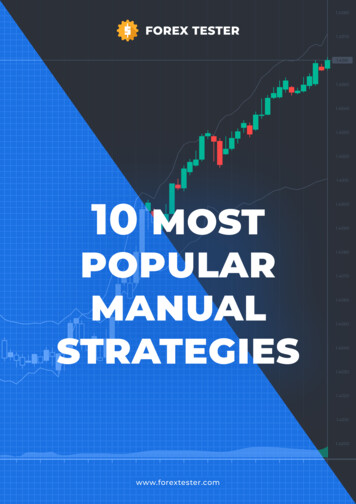
Finding investments that will go upThe Elliott Wave Theory uses a different approach. Using what it knowsabout the unavoidable behavior of a large group of people, it looks atthe price movement of a potential investment to determine where thatinvestment is in the predictable pattern that is created by herdmentality. If that can be determined, then it can be determined if it is agood investment that will increase in value. That’s the basis of theElliott Wave Theory, and it works. Let’s get into how this theory worksin the real world so that you can use it to consistently find investmentsthat will go up.Let’s look at an example of a five-wave move. This is a chart that tracksthe price movement of the Nasdaq-100, which is a market index just likethe S&P 500 or Dow. Market indexes give us a very good gauge of thedirection of the overall stock market, as well as the market’s herdmentality. Can you see the five-wave move on this chart?Elliott Wave in real timeWe talked about the predictable, repetitive pattern that is created by aherd mentality. So what is this pattern? Great question.When a stockor other potential investment is in a trend, its price moves in a fivephase pattern. Someone who is familiar with Elliott Wave will call thisfive-phase pattern a five-wave move, a trendy move or an impulsewave. These are the moves that we want to find and invest inbecause they are the moves that are going to continue.Investing earlyin five-wave moveswill yield us massive returns on our investmentand therefore make us successful investors.The same price chart is now labeled to show all five phases of this bigadvance. The first phase or “wave” moves in the direction of the newuptrend and is labeled with a black one. This is the infancy of a newtrend.At this point, not many investors buy into the idea that a new trendhas begun. The second wave moves in the opposite direction of the
new trend and often gives the impression that a new trend has notbegun; it throws a lot of investors off the scent of the new trend. Nextcomes the third wave of the advance. This is when the advance reallyfinds its groove, and more and more investors become interested in thisdynamic price move. The fourth wave moves against the dominanttrend; it essentially provides a chance to refuel and get ready for thenext move. By this time, most investors are aware of the trend and areexcited about partaking in the festivities – everyone else is. The finalmove is the fifth wave. Everyone who is going to invest in this trend isnow invested. And that is precisely when the trend ends.moves) are smaller five-wave patterns themselves. Now look againand note the small blue numbers. They show that each move in thedirection of the trend has five waves itself. So any time the price of aninvestment is moving in the direction of its trend, it will give us fivewave patterns. This tells us every step of the way if we are trading withthe trend or against it, and that is incredibly valuable information.Every big advance that was ever worth investing in played out in fivewaves like this one. If we can identify investments that are in trendymoves, then we can buy the investment early and ride the trend to itscompletion. That’s the best part; price action will constantly tell us ifwe’re on the right track with our investment so that we can stick with atrend until its end. Here’s why:Look again at this chart and note that the first, third, and fifth moves ofthis five-wave pattern move with the uptrend, and the second andfourth waves move against the uptrend. What keeps us on the righttrack is that the moves that go with the trend (the first, third and fifthI could spend the next week showing youdifferent examples of trendyfive-wave moves; they are everywhere. Instead, look for yourself. Lookat some price charts (I recommend using stockcharts.com for pricecharts – no affiliation), find some big moves, and look for five-wavepatterns. Note that downtrends play out in five waves too.
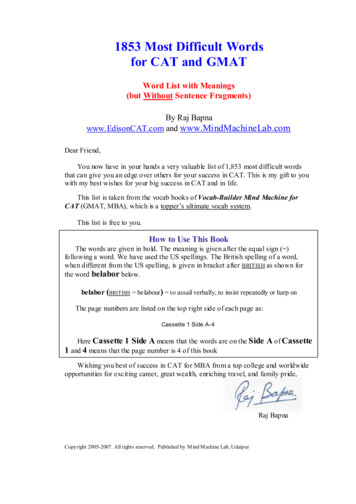
It’s not always rainbows and butterflies?Of course if the price of every investment was always moving in atrendy way, investing would be easy.When an investment is not in atrend, it is in a countertrend or corrective price move. No one likesthese moves; price doesn’t move in any meaningful way so it is reallyhard to make any money during corrective moves. But these pricemoves are just as important as trendy moves because they tell uswhich direction the trend isnot headed.corrective price move; it simply puts the trend on hold. You can seethat it would have been difficult to make any money during thiscorrective move; price moved sideways in spastic fashion. Still, acorrective move gives us really good information. It tells us that thetrend is still up. If you can find an investment that had previously beenin an uptrend and is now about to complete a corrective pullback, theodds are very much in your favor that the uptrend is about to continue.Corrective moves don’t happen just anywhere.Unlike trendy moves that play out in five phases, corrective moves playout in three phases. And while trends are purposeful and directionalprice moves, corrections are lesspurposeful and more indecisive.Recall that in a five-wave trend, the second and fourth waves moveagainst the direction of the trend. These are corrective moves. You cansee on the chart that the highlighted second and fourth waves of a fivewave advance play out in three waves. The other time you will see acorrective price move is when the entire trendy five-wave movecompletes. Look again at the chart and note that once the five-waveadvance completed, a corrective three-wave pullbackplayed out.Here is a good example of a corrective move. The trend was up beforethis corrective price move started. And the uptrend continued once thecorrective price move ended. That is what happens with everyOn a side note, you might notice that corrective waves are labeled ABCinstead of 123. Corrective price moves are always labeled with letterswhile trendy moves are labeled with numbers.
Together in perfect harmonyThese trendy and corrective price moves don’t just pop up on occasionlike the price patterns other investors try to identify (such as a head andshoulders pattern). Instead, every piece of price action on a price chartis either in a trendy move or a corrective move – we just have to figureout which one. Here’s a good way to think about it;if we recorded andcharted price action from the very first day the stock market opened tothe day it shut its doors and ultimately closed, the price pattern wouldbe one massive five-wave trend. All price action in between wouldeither be part of a trend or part of a corrective move. Massive bearmarkets that last years are just really big corrective three-wave moves.Remember the devastating bear markets that played out from 2000 to2002 and from 2007 to 2009? It didn’t feel like the market was in someuneventful corrective pattern at the time, but that’s exactly what it was –just on a really large scale. The trend was up going into that nearlydecade-long correction, and the trend is up again now that thecorrection completed. As you can see, the market (or anything else youare analyzing) is always somewhere in the Elliott Wave pattern.So let’s circle back to the beginning.The Nasdaq-100 just gave us a big trendy advance. It was followed bya corrective pullback. What’s next? This five-wave advance told us thetrend was up because only trends play out in five waves. The correctivethree-wave pullback confirmed that the trend was still up. Let’s seewhat happened from there:The uptrend continued with purpose. The five-wave pattern we’ve beenlooking at is only the first wave of an even larger five-wave pattern (seethe red labeling). This is how all trends unfold.
Keep it simpleThere are other rules that provide some framework for how to properlyidentify five-wave moves. The big one is that a second wave (acountertrend move) can never move below the starting point of the firstwave and similarly a fourth wave can’t move below the starting point ofthe third wave. Learning some of the other nuances of the Elliott WaveTheory is likely in your best interest, and it’s not hard to find informationout there on the subject. But just as important is to keep yourapplication of the theory really simple. Too many users of this theory tryto turn it into a science. They might watch the minute-by-minute pricemovement of an investment, expecting to find clean, useful Elliott Wavepatterns. I hate to break it to you, but it’s not going to be perfect on areally small time frame; there are humans involved, after all.Another problem I’ve seen is that people try to use this theory to predictthe future. At the sight of a strong move, they confidently announce thatthe next great bull market (aka the next big five-wave move) is at hand.Then they fight tooth and nail to support that claim, even when itbecomes long beyond obvious that things have changed and theirclaim is wrong. You can’t fall victim. This theory provides us constantfeedback; constantly listen to it. If you are trying to invest in a stock’suptrend and it falls into a corrective pullback, this is a great indicationthat you are on the right side of that investment. If instead the stockunexpectedly reverses its uptrend and suddenly gives you trendy downmoves, exit the investment. Never get married to what you think isgoing on; instead simply let price action and the search for trendy vs.corrective price moveskeep you on the right side of the trend.The best advice I can give you is to find stocks that have been in astrong and well-established trend. Look for trendy (five-wave) pricemovement that is occurring in the same direction as the wellestablished trend. If you find it, buy the investment and allow priceaction to guide you from there.Cash moneyBelieve what you want about the reasoning behind it, but plain andsimple, the Elliott Wave Theory works. Go look at the price charts ofsome of the stocks in the S&P 500, on any time frame over a fewmonths, and you’ll see the “waves” at work. Not only is this the simplest,it’s also the most effective way I have found to consistently andaccurately identify a trend while gaining some concept of how long thattrend might continue. And at the end of the day, the whole purpose ofany trading strategy is to identify and trade the trend.Ryan Henry is the co-founder and lead analyst at TrendLizard.com.Every day they apply the Elliott Wave Theory to 37 Exchange-TradedFunds (ETFs) to identify the strongest and most tradable trends. Thenthey tell you exactly how to trade those trends, from start to finish.TrendLizard.com
The Elliott Wave Theory uses a different approach. Using what it knows about the unavoidable behavior of a large group of people, it looks at the price movement of a potential investment to determine where that investment is in the predictable pattern that is created by herd mentality. If that can be determined, then it can be determined if it is a good investment that will increase in value .