Transcription
CHI 2009 Using Tabletops for Education, Science, and MediaApril 8th, 2009 Boston, MA, USATabletop Displays for Small Group Study:Affordances of Paper and Digital MaterialsAnne Marie Piper and James D. HollanDistributed Cognition and Human-Computer Interaction LaboratoryDepartment of Cognitive Science, University of California, San Diego9500 Gilman Dr., La Jolla, CA 92093{apiper, hollan}@hci.ucsd.eduABSTRACTIn this paper we compare the affordances of presentingeducational material on a tabletop display with presentingthe same material using traditional paper handouts. Tenpairs of undergraduate students used digital or papermaterials to prepare for exams during four one-hour studysessions over the course of a term. Students studying withthe tabletop display solved problems on their own beforeresorting to answer keys and repeated activities more oftenthan students studying with paper documents. Wesummarize study activities and discuss the benefits anddrawbacks of each medium.Author KeywordsTabletop, paper, education, affordance, collaboration, studyACM Classification KeywordsH5.2. User Interfaces, H.5.3. Collaborative ComputingINTRODUCTIONThere is growing interest in exploring multiuser multitouchtabletop displays. This is driven by the decreasing cost ofprojection technology, increasing availability of multitouchfacilities, and the resulting potential to support naturalsimultaneous interaction of multiple individuals with digitalmaterials. Research has demonstrated that tabletop displaysare useful for gaming and entertainment [35], manipulatingphotos [2], communication [20], and education [10, 21, 28].Educational applications are especially promising becauseof the potential benefits of shared equable interaction.Although multiuser tabletop display systems are a commoncomponent of visions [4, 16, 17] for the “classroom of thefuture,” their pedagogical benefits remain unclear.Relatively few studies have addressed the tradeoffs betweenpaper and digital materials on tabletops (see [32]), but nonehave addressed these tradeoffs in the context ofcollaborative learning. This paper presents a research studyPermission to make digital or hard copies of all or part of this work forpersonal or classroom use is granted without fee provided that copies arenot made or distributed for profit or commercial advantage and that copiesbear this notice and the full citation on the first page. To copy otherwise,or republish, to post on servers or to redistribute to lists, requires priorspecific permission and/or a fee.CHI 2009, April 4–9, 2009, Boston, MA, USA.Copyright 2009 ACM 978-1-60558-246-7/09/04. 5.00.that compares how pairs of students interact with digitaland paper materials on a tabletop display. Specifically, weexamine interactions of students studying neurosciencediagrams in preparation for exams to address the followingquestions: How do large, horizontal, multiuser displays affectcognitive and social activities in a shared studyenvironment? What pedagogical benefits do tabletop displays providebeyond a motivating context for activity?We conducted a comparative study with ten pairs ofundergraduate students from an introductory cognitivescience course at our university. We collected over 40 hoursof observations as these students discussed, annotated, andstudied using digital and paper diagrams. Our research teamworked closely with the course professor in preparation ofmaterials and to ensure an authentic context for evaluationof how tabletop displays affect group study in an on-goingclass. We implemented a simplified tabletop applicationwith limited features as a way to collect initial data onwhich features might be useful for future educationaltabletop applications. Findings address issues of taskparticipation, engagement with study material, and generalgroup work dynamics.BACKGROUNDWhile the focus of this study is the affordances of paper anddigital study materials in one specific situation, the longterm goal of our work is to understand the cognitiveecology of physical and digital media. Here we brieflyreview tabletop applications for education and singledisplay groupware, as well as our motivation for selectingpair study groups and issues associated with learning withdigital and physical materials.Tabletop Applications for EducationThe benefits of presenting educational content on a tabletopdisplay are currently unclear. Within the domain of tabletopresearch, few applications are designed with expliciteducational goals or evaluated for educational outcomes.The educational applications that have been created focusalmost exclusively on younger populations, mainly childrenfrom age 4 to 13, and are primarily exploratory in nature.1227
CHI 2009 Using Tabletops for Education, Science, and MediaFor example, research has examined how tabletop displaysfacilitate learning numbers, sorting, and patterns [10],learning to read [28], and social skill development [21].Findings from these studies emphasize the motivatingnature of tabletop displays and report higher taskengagement compared to other mediums. While thesefindings are valuable and suggestive, the pedagogicalbenefits of cooperative tabletop activities need furtherexploration.The main body of research on tabletop displays examinesinteraction techniques (e.g., [19,39]), with someinvestigation of issues of territoriality [25] and socialprotocols [15] around tabletops. While undergraduatestudents are a common choice for participants in tabletopresearch studies, there is little research that addresses theeducational implications of tabletop displays for this userpopulation. In addition to wanting to better understand thepedagogical benefits of tabletop displays for undergraduateeducation, we decided to focus on pair study groups ofcollege students for several reasons.First, collaborative learning is strongly encouraged by mostuniversities, and this study practice differs from what manystudents experienced in high school. While college studentstypically need to turn in individual assignments, manyprofessors encourage students to form study groups, seekhelp from teaching assistants, and work with moreadvanced students to learn course material. Thecollaborative nature of tabletop technology has potential tonaturally support this form of small group study.Second, implementing tabletop educational activities withina university setting is logistically easier and more feasiblethan other educational settings. Most college courses haveteaching assistants who can help with activity design andsetup. College students can be expected to completetabletop activities independently with minimal supervision.Finally, tabletop systems are able to record how studentsinteract with projected materials during joint study sessions.This provides the course instructor with data about theprocess of engaging with course material in a social studysetting outside the classroom, a new and potentiallyvaluable source of data about mastery.Single Display GroupwareUnlike traditional computer workstations with a singlekeyboard and mouse, tabletop displays allow multiplelearners to have equal access and shared ownership over theactivity. The broader category of display technology thataccommodates multiple users is called single displaygroupware (SDG) [30]. SDG has been shown to lead togreater task engagement and activity participation [31] (alsosee [34] for an interesting SDG toolkit). Active engagementand equitable participation in a task are necessary aspects ofcollaborative learning. Multiuser multitouch tabletopdisplays seem inherently well-suited for facilitating thistype of behavior. Compared to vertical displays theirApril 8th, 2009 Boston, MA, USAhorizontal form factor provides a more neutral andequitable surface for collaboration [24]. The physical sizeof the tabletop provides ample area for multiple people tointeract with content. Finally, multitouch capabilities allowmultiple people to simultaneously discuss, annotate, andmanipulate digital artifacts.Digital and Paper MediaSellen and Harper, in their seminal work on the myth of thepaperless office [26], document key affordances of paper.They note that a simple dichotomy of paper versus digital isinsufficient as a framework for understanding the cognitiveecology of real-world activity with paper and digitalartifacts. While ultimately we need to understand thiscomplex tradeoff space, it is still vitally important todelineate specific advantages, disadvantages, anddifferences between media. Terrenghi et al. conducted anexploratory study that examined the affordances ofinteracting with physical and digital media on tabletops[32]. Their observations provide insights for designersinterested in creating digital interactions that mirrorinteraction with real-world objects. Previous research hasalso demonstrated that social protocols typically employedaround traditional tables with paper materials areinsufficient for group work around shared digitaldocuments. Collaboration with digital documents requirescoordination policies at the software-level [7, 15, 29].Within educational research, substantial attention is givento the difference between learning with virtual versusphysical materials, e.g., [5, 12, 33]. This research focuseson the pedagogical benefits of manipulating physicalobjects instead of two-dimensional virtual objects on acomputer screen. While this body of work is relevant, ourprimary focus concerns the affordances of paper and digitalmaterials presented on tabletops.Differences in ApproachOur evaluation builds on earlier work but is different inseveral respects. We examine how digital and papermaterials affect study practices including studentparticipation and cooperation. Our tabletop application(described in detail below) is not the focus of this research.It is purposely minimalistic. We created a basic applicationthat would be quick to learn and simple to use. While wehave plans to explore a variety of facilities, we wanted tofirst look at how using a basic application compared withusing paper materials. Another difference from earliertabletop research studies is that we study interactions overmultiple sessions to ensure that observed behaviors are notan artifact of first-time use.CONTEXT OF STUDYWe examine how pairs of undergraduate students worktogether to discuss and interact with diagrams provided in aneuroscience class at our university. This course was ofparticular interest because of the professor’s instructionaltechniques and classroom practices. The professor has1228
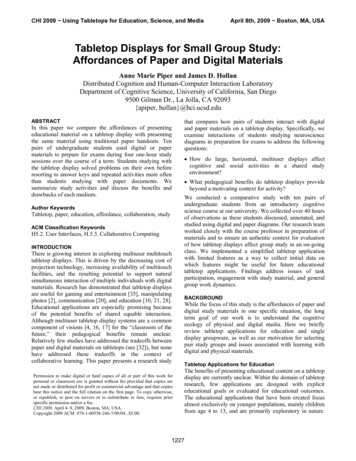
CHI 2009 Using Tabletops for Education, Science, and MediaApril 8th, 2009 Boston, MA, USAtaught this class in the same format for seven years. Toexplain course concepts she uses a combination of handdrawn and computer-generated diagrams on overheadtransparencies. During lecture, the professor beginsexplaining a topic by placing a single transparency on theoverhead. Throughout her explanation she adds layers ofcomplexity with additional overheads and moveable cutoutparts.We selected this course as a focus for understandingcooperative group study with tabletop displays for severalreasons. First, diagrams and visuals are pervasivethroughout all course lectures, handouts, and textbooks.Digital tables are well suited for displaying this type ofhighly visual information. Second, the tabletop display canbe used as a digital analog to the professor’s overheadprojector and transparencies, allowing students tomanipulate multiple layers of information just as theprofessor does in class. Third, there is a low cost to transferinstructional materials (i.e., diagrams for labeling, graphs todraw) to a digital format for the tabletop display. This wasdone in a few hours by one researcher, but an instructorcould easily adapt future overhead transparencies orPowerPoint slides to tabletop activities. Fourth, this courserequires substantial out-of-class study time. Students in theclass were motivated to participate in our study because itprovided them with course materials and cooperative studytime.TABLETOP TECHNOLOGYWe implemented a basic tabletop application using aMERL DiamondTouch table [4] and the DiamondSpintoolkit [27]. The tabletop application was designed so thatthe students’ experience would mirror interaction withpaper materials as well as the professor’s practices withmaterials in class. Prior to each study session, a set ofactivities was preloaded into the tabletop system. Theinterface allows students to view one activity at a time,much like the professor does with an overhead projectorand diagrams in class. Also similar to the professor’stechniques, our tabletop application lets students addadditional layers of information by stepping through phasesof a process or turning on an answer layer to check theirwork. The activity content is a static diagram; that is,students are unable to rotate, resize, or move images. Chairsnext to the tabletop and interface controls are positioned sothat students would sit side-by-side instead of across fromeach other. This allows for ease of sharing text-basedmaterial. Each student has their own “draw” and “erase”buttons that allow them to mark on the diagrams with theirfinger (see Figure 1). They can also erase each other’sannotations. This mirrors paper interactions where studentscan erase each other’s drawings with a pencil eraser.Students have access to a shared menu that allows them tonavigate between activities (including previous weeks’activities), view activity answers, and clear all annotationson the current document. When students display the answerlayer, the answers appear in green on top of theirFigure 1: Screenshot of tabletop application with labelingactivity; users have individual draw and erase controls anda centralized menu; currently in view answer mode.annotations so they can check their work. We designed thetabletop application so that annotations and notes wouldpersist over multiple sessions in a way similar to how pencilmarkings persist on paper. Our system exports each group’sannotations and reloads them when the pair returns for asubsequent session.METHODTo assess the tradeoffs of supporting group study with adigital table, we conducted an evaluation with 20undergraduate students from an introductory neurosciencecourse. Successful students in this course need to memorizebrain anatomy, understand and describe complex systems(e.g., firing of a neuron), and be able to generate graph andcircuit drawings of various brain activity.Participants and ProcedureTen pairs of undergraduate students (n 20, meanage 20.15, 15 females) participated in the five week study.All students were enrolled in the same undergraduatecourse on neuroscience at our university. Each studentpicked a partner at the beginning of the quarter and workedwith this person throughout the study. None of theparticipants had worked with their partner nor used tabletoptechnology prior to the study. All pairs of students attendedfour one-hour “study sessions” over the five-weekcondensed summer term. We observed over 40 hours ofstudy time with this group of students. Experimentsinvolving tabletop displays rarely examine repeated use bythe same participant group. We chose to conduct multipletrials with the same students to observe behavioral patternsover time. Students in this class were highly motivated toparticipate, and we had a remarkable attendance rate—all20 students attended all four sessions. For participating,they received either extra credit or a cash incentive of 50.Each study session was comprised of the three activitiesthat had been selected by the course professor: (1) ananatomical labeling activity, (2) discussion of a dynamic1229
CHI 2009 Using Tabletops for Education, Science, and Mediasystem, and (3) a drawing activity involving a graph orcircuit. The goal of each study session was to preparestudents for an upcoming exam by reviewing relevantdiagrams. Study sessions were held the two days prior toeach exam. At the beginning of Study Session 1, allstudents were given three practice exercises (one for eachactivity type listed above) so they could become familiarwith the activities they would see and the way in whichthey would be presented.Our goal was to keep the students’ experience as authenticand relevant to the course as possible. Students wereinformed that their professor selected all study activitiesspecifically to prepare them for the upcoming exam.Before Study Session 1, students were told that they coulduse this time however they choose and could use personalnotes or books. If requested, we provided color copies ofdiagrams for students to take home. All study sessions wereconducted in our laboratory around a DiamondTouch tableto keep the environment and workspace consistent acrossconditions.ConditionsPairs of students were randomly assigned to the paper ordigital condition. In the paper condition, students receivedone set of paper diagrams to share and erasable coloredpencils. Students in the digital condition worked withdigital images on a DiamondTouch table (79cm diagonal,4:3 aspect ratio) where they annotated images by touchingwith their finger. In both conditions students had access totheir materials from previous study sessions as well as theirpersonal notes and textbooks. To distinguish the notes andannotations each participant made on the diagrams, onestudent in each pair was the “red user” and the other wasthe “blue user” for the entire study. The activity contentwas identical in both paper and digital conditions; however,the size of diagrams varied. In the paper condition,diagrams were printed in color on an 8 ½” x 11” sheet ofpaper. Diagrams in the digital condition wereapproximately twice that size and unlike the paper versionare not rotatable or resizable. We considered givingstudents in the paper condition diagrams equal in size to thedigital diagrams but chose to provide handouts of standardsize to reflect classroom practices. Variations in diagramsize and rotatability between the two conditions providedinteresting results that are discussed below. Students in thepaper condition received folders with activities and answerswhile students in the digital condition had access to a menuon the interface that opens activities and answers.RESULTSThe following results are based on observations of 40testing sessions observed live and reviewed on video. Weused two-sample multivariate t-tests for planned statisticalcomparisons with α 0.05. Error bars on graphs representstandard error. Most coding was straight forward (e.g.,students either repeated an activity or they did not) andApril 8th, 2009 Boston, MA, USAperformed by one researcher. Coding methods and scoreswere cross-checked by a second researcher.Integration with Current Study PracticesOne open question concerning digital study materials ishow students learn to use the tabletop application andintegrate it into their current study practices.Learning to Use the Tabletop ApplicationStudents in the digital condition did not have problemslearning to use the tabletop application. All studentsreceived five minutes of training before starting the threeclass-related activities. During the training period, studentsquickly learned how to turn on and off drawing and erasing,navigate between different activities, view answers, andclear annotations. We conducted a brief survey withparticipants in the digital condition just before Session 2.Eight of ten students said learning to use the table was“easy” and two others said it was “very easy” (five-pointLikert scale; zero neutral with “very hard” and “very easy”as endpoints). Similarly, eight of ten students reported thatit took them less than five minutes to learn to use thesystem. The other two students said it took 5-10 minutes tolearn to use the system.Novelty EffectsOne aspect of tabletop displays is the novelty of the device.We anticipated that the newness of the technology woulddistract participants from the task, resulting in some offtask behavior, but there was actually limited off-taskbehavior during the study session. Most off-task behavioroccurred at the end of a session after students completed allstudy activities. Overall, the novelty of the device did notappear to interfere with the task.Incorporating Existing Paper MaterialsStudents in both conditions were told that they could usetheir own materials during the study session. We expectedstudents in the digital condition to be less likely toincorporate paper notes, notebooks, and textbooks becausethe materials might obscure the tabletop display space. Ourobservations indicate exactly the opposite; just as manystudents in the digital condition used personal studymaterials (2 pairs during week 1, 4 pairs week 2, 2 pairsweek 3, 0 pairs week 4) as those in the paper condition (2pairs week 1, 2 pairs week 2, 1 pair week 3, 1 pair week 4).Students in the digital condition did face problemsnegotiating tabletop space and organizing their materials onthe top-projected display surface. Students fumbled withmaterials, often setting them on their lap or on a nearbystool. Several students placed notebooks and loose sheets ofpaper on the tabletop surface, even though the overheadprojector projected onto these materials.Activity Participation and Work FlowWe requested that students stay at least 15 minutes for eachstudy session, but they could leave anytime thereafter.Figure 2 indicates the average time students stayed and1230
CHI 2009 Using Tabletops for Education, Science, and Mediaprovides a breakdown of average time spent on eachactivity type. Time-on-task data were collected based onvideo timestamps according to when students started andstopped each activity. We did not include time spent in offtask behavior (e.g., student breaks from activity to answer acell phone). Average weekly study time was approximatelyequal for both mediums (paper overall mean 24.8,stdev 9.4; digital overall mean 24.5, stdev 8.8), but therewere differences in how long students worked on eachactivity depending on condition. The average time spent onthe discussion activity was greater in the paper condition.We observed two contributing factors to this difference.First, the tabletop display was more efficient for managingmaterials, and students with paper documents had to flipthrough and sort discussion slides by hand. Second,students using paper documents made more detailed noteson the discussion diagrams (we address this in thediscussion activity section below).April 8th, 2009 Boston, MA, USA454035Minutes30252015105DrawingDiscussionOther StudyingReviewing Prev ActsDitigal AvgPaper AvgW4 PaperW4 DigitalW3 PaperW3 DigitalW2 DigitalW2 PaperW1DigitalW1 Paper0LabelingFigure 2: Average time students attended each study sessionwith breakdown for each activity.Repeating ActivitiesInterestingly, students with digital diagrams went back andrepeated activities more often than students with paperdiagrams. All pairs in the study completed each activity atleast once, but some pairs went back to an activity, erasedtheir answers, and tried it again. Figure 3 illustrates howmany pairs in each condition performed an activity morethan once. On average students in the digital conditionrepeated an activity twice as often as students in the papercondition (paper overall mean 1.3, stdev 0.96; digitaloverall mean 3.0, stdev 2.0).642DrawingDiscussionDigital AvgPaper AvgW4 PaperW4 DigitalW3 DigitalW3 PaperW2 DigitalW2 PaperRepeating an activity often required students to eraseprevious answers, and this was more easily done in thedigital condition. One student working with digitaldocuments said, “Want to try to redraw it?” Their partnerresponded, “I mean, we could just for memorizing it.” Thepair quickly cleared the annotations and began drawingagain. Most students working with paper documents whowanted to repeat an activity spent time erasing previousannotations. On several occasions it took one full minute toerase annotations on a single diagram. Other groups flippedthe paper document over and redrew the diagram on theback of the paper instead of erasing.W1Digital0W1 PaperNumber of Instances8LabelingFigure 3: Number of instances an activity was repeated.Labeling ActivityBeing able to label items on a diagram is an importantcourse objective. We anticipated that students working withdigital documents would more equally share the labelingtask. Equal participation means that on average studentswould each contribute 50% of the answers. We found thaton average a student in the paper condition contributed 76%while their partner contributed 24% (stdev 18). Amongstudents working with digital documents, one partner onaverage contributed 63% while the other contributed 37%(stdev 7.9). This is not a statistically significant difference,but it has implications for how students organizethemselves to complete this shared activity.Figure 4: (left) student labels items on the paper diagramwhile partner crosses off items; (right) both students labeldigital diagram at the same time.The two mediums provide contrasting use cases (see Figure4). First, students working with paper documents most oftenfollowed a serial strategy when labeling the diagram. Thesestudents tended to divide up the task labor; one studentwrote down answers while the other student crossed offitems from the numbered list of parts to label. Whileadopting this work pattern means that one student does the1231
CHI 2009 Using Tabletops for Education, Science, and Mediamajority of the labeling, it allows students to jointly focuson all of the aspects of the diagram. An alternate pattern ofwork was observed with digital diagrams. Here, bothstudents performed labeling and crossing off tasks, oftenreaching across the surface to interact at the same time.This approach allows both students to engage with thestudy material and practice labeling the diagram, butstudents may miss part of the activity if they do notcarefully attend to their partner’s actions.Discussion ActivityA central question is how the mediums support andconstrain discussion between students. In both conditions,the typical flow of work during the discussion activityinvolved one student explaining the concept to their partner.We categorized the way in which students used the paperand digital mediums during discussion: all verbal (noannotations made), sketching, written words, or bothsketching and writing. As summarized in Figure 5, studentsin the digital condition used sketching most often (65% ofthe time) while students given paper handouts were morevaried in the techniques used to support discussion.PaperWrittenProse30%All Verbal25%Sketching30%augment dialog. One issue is that current finger trackingcapabilities and resolution of the tabletop display madewriting legible sentences challenging (although there areinteresting techniques [1] being explored to minimize thisissue). Future evaluations should consider including stylusor pen based entry as well as handwriting recognition thattranscribes notes into text.Another key difference between the paper and digitaldiscussion activities is the amount and frequency of erasingannotations. We observed students in the digital conditionfrequently erasing all of their annotations after explaining aconcept to their partner. In contrast, and in agreement with[11], students in the paper condition crossed out annotationsinstead of completely erasing them, creating a rich historyof learning. Instances of erasing in the paper conditionoccurred when students wanted to re-label a diagram orredraw a graph for extra practice, whereas erasing was thenormal course of action after students in the digitalcondition finished an activity. An erase feature in digitalmedia has both positive and negative consequences. Wedescribed these tradeoffs in the discussion section.Drawing ActivityDigitalBoth5%Both 15%April 8th, 2009 Boston, MA, USAAll Verbal30%Sketching65%Figure 5: Techniques students used to augment discussion.In the paper condition, students used pencils to makedetailed notes on the diagrams, thus resulting in more timespent on this activity. When students sketched on paper,they did it lightly, perhaps so as not to leave a dark hard toerase mark on the paper. Notes and drawings in the papercondition appeared much more planned and structured. Incontrast, students in the digital condition rarely wrote outfull words or sentences during discussion. More often theiranswers were abbreviations, symbols, or numbers (seeFigure 6, right). There was heavy use of sketching toThe main difference between conditions for the drawingactivity involves single-user versus multi-user drawing.Remember that students in the paper condition were able tomove and rotate study materials, while students in thedigital condition did not have that option. As expected,students in the paper condition moved diagrams closer tothemselves when annotating, especially during the drawingactivity (Figure 7, left). Paper diagrams were rarelypositioned in the middle of the table for both students toannotate. Again, we observed a serial work strategy aroundpaper documents. In practice this means that one studentdrew on the paper diagram while the other student watched,thus taking on a more passive role in the activity. Onoccasions, however, students in the paper conditionswitched roles and passed the paper between them so eachcould draw.Figure 7: (left) student orients paper towards her whendrawing; (right) one student draws the first three curves onthe graph, then the partner reaches in to correct a mistake.Figure 6: (left) written words in bullet points on a paperdiagram; (right) rough sketches that accompany verbalexplanation on digital diagram.The digital medium affords multi-user drawing. Even if onestudent does most of the drawing, the digital table allowsthe partner to reach in and add to the solution. We observedat least one instance of this multi-user drawing behavior ineach study session with digital documents (F
nature of tabletop displays and report higher task engagement compared to other mediums. While these findings are valuable and suggestive, the pedagogical benefits of cooperative tabletop activities need further exploration. The main body of research on tabletop displays examines interaction techniques (e.g., [19,39]), with some