Transcription
Contribution of Micro- and Macro-Texture for PredictingFriction on Pavement SurfacesFINAL PROJECT REPORTbyNatalia Zuniga-Garcia, M.Sc.andJorge A. Prozzi, Ph.D.SponsorshipU.S. Department of Transportation’s University Transportation Centers ProgramforCenter for Highway Pavement Preservation(CHPP)In cooperation with US Department of Transportation-Office of the Assistant Secretary forResearch and Technology (OST-R)December, 2016i
DisclaimerThe contents of this report reflect the views of the authors, who are responsible for the facts andthe accuracy of the information presented herein. This document is disseminated under thesponsorship of the U.S. Department of Transportation’s University Transportation CentersProgram, in the interest of information exchange. The Center for Highway PavementPreservation (CHPP), the U.S. Government and matching sponsor assume no liability for thecontents or use thereof.ii
Technical Report Documentation Page1. Report No.CHPP Report-UTA#3-20162. Government Accession No.3. Recipient’s Catalog No.4. Title and SubtitleContribution of Micro- and Macro-Texture for Predicting Friction onPavement Surfaces5. Report DateDecember 20166. Performing Organization Code7. Author(s)Natalia Zuniga-GarciaJorge A. Prozzi8. Performing Organization Report No.9. Performing Organization Name and Address10. Work Unit No. (TRAIS)CHPPCenter for Highway Pavement Preservation,11. Contract or Grant No.Tier 1 University Transportation CenterUSDOT DTRT13-G-UTC44Michigan State University, 2857 Jolly Road, Okemos, MI 4886412. Sponsoring Organization Name and Address13. Type of Report and Period CoveredUnited States of AmericaDepartment of Transportation14. Sponsoring Agency CodeResearch and Innovative Technology Administration15. Supplementary NotesReport uploaded at http://www.chpp.egr.msu.edu/16. AbstractCurrent methodologies to measure road friction present several disadvantages that make them impractical for field datacollection over large highway networks. Thus, it is important to study different ways to estimate surface frictioncharacteristics based on other properties that are easier to measure. The main objective of this study was to quantify theeffect of macro and micro-texture and to observe their influence on friction. A high-definition Line Laser Scanner (LLS)was implemented to make an improved characterization of the road macro- and micro-texture description using differenttexture parameters.Field measurements of friction and texture were collected using different tests methods. The friction characterization testsincluded the British Pendulum test (BPT), the Dynamic Friction test (DFT), and the Micro GripTester. Thirty-six differentpavement sections were evaluated, including different surface types such as hot-mix asphalt (HMA), surface treatment,and concrete sidewalk.Among the principal conclusions, it was found that there is not a unique relationship between texture and friction. Therelationship between texture and friction is strong but it is different for each type of surface, thus, cross-sectional analysiscannot be utilized to quantify the relationship. Additionally, the prediction of friction measures obtained using the BPTand the DFT significantly improved when including information of both macro- and micro-texture into the predictionmodel. Therefore, a measure of micro-texture should be included into friction models based on texture. Finally, among thestudy of different texture parameters, the mean profile depth (MPD) was the most significant parameter for macro- and formicro-texture to explain the distinct friction measures.17. Key WordsFriction, Skid Resistance, Macro-Texture, Micro-Texture, Laser Scanner19. Security Classification (of this20. Security Classification (of thisreport)page)Unclassified.Unclassified.Form DOT F 1700.7 (8-72)18. Distribution StatementNo restrictions.21. No. of Pages22. Price106NAReproduction of completed page authorizediii
Table of ContentsCHAPTER 1 - INTRODUCTION .11.1 BACKGROUND .11.2 MAIN OBJECTIVES .21.3 SCOPE AND METHODOLOGY .21.4 DESCRIPTION OF CONTENT .3CHAPTER 2 - LITERATURE REVIEW .42.1 TEXTURE .42.1.1 Pavement Texture Components . 52.1.2 Measuring Texture of Pavement Surfaces . 72.1.3 Texture Characterization . 132.2 FRICTION AND SKID RESISTANCE .182.2.1 Slip Speed Effect. 192.2.2 Friction Mechanisms . 212.2.3 Measuring Skid Resistance of Pavements . 222.3 RELATIONSHIP BETWEEN PAVEMENT TEXTURE AND SURFACE FRICTION .282.3.1 Macro-Texture and Micro-Texture Testing Using Laser Sensors . 282.3.2 Incorporating Surface Micro-texture in the Prediction of Skid Resistance . 29CHAPTER 3 - CHARACTERIZATION AND PROCESSING OF TEXTURE DATA .313.1 LINE LASER SCANNER (LLS) CHARACTERIZATION .313.1.1 Laser Scanner . 313.1.2 Translation Stage (TS) . 333.2 LINE LASER SCANNER (LLS) SETUP .343.2.1 Laser Scanner Setup . 373.2.2 Translation Stage (TS) Setup . 383.2.3 Comparison with Other Laser Systems. 393.3 DATA PROCESSING .403.3.1 Processing Invalid and Erroneous Data . 403.3.2 Filtering Macro- and Micro-Texture Profiles . 443.3.3 Characterization of Pavement Texture. 47CHAPTER 4 - Friction and Texture Data Collection .494.1 EXPERIMENT DESIGN .494.2 TEST SECTIONS .504.3 DATA COLLECTION PROCEDURE .54CHAPTER 5 - ANALYSIS OF FRICTION AND TEXTURE MEASUREMENTS .585.1 FRICTION.585.2 TEXTURE .615.2.1 Sand Patch Test and Circular Track Meter (CTM) . 62ii
5.2.2 Line Laser Scanner (LLS) . 635.3 FRICTION AS A FUNCTION OF TEXTURE .64CHAPTER 6 - CONCLUSIONS AND RECOMMENDATIONS.776.1 SUMMARY .776.2 IMPORTANT FINDINGS CONCLUSIONS .786.3 RECOMMENDATIONS .80REFERENCES .81APPENDIX A – BUTTERWORTH FILTERS PYTHON CODE .85APPENDIX B – SAMPLES DESCRIPTION .86APPENDIX C – FRICTION MODEL USING DIFFERENT TEXTURE PARAMETERS .90iii
List of FiguresFigure 2-1 Texture profile basic terminology . 5Figure 2-2 Texture components (Sandburg, 1998) . 6Figure 2-3 Texture wavelength influence on tire/pavement interactions (Henry, 2000) . 7Figure 2-4 (a) Sand Patch test equipment, and (b) field data collection . 9Figure 2-5 Mean profile depth (MPD) procedure (ASTM E 1845, 2009). 10Figure 2-6 (a) Circular Track Meter (CTM), and (b) CTM segments . 11Figure 2-7 (a) Laser Texture Scanner (LTS), and (b) 3D plot of a measured surface. . 12Figure 2-8 Aggregate Imaging System (AIMS) equipment (Mahmoud et al., 2010). 13Figure 2-9 Positive and negative texture (McGhee and Flintsch, 2003). . 15Figure 2-10 Texture profiles with (a) different skewness values, and (b) different kurtosis values(ASME B46, 2010). . 16Figure 2-11 Friction coefficient and slip speed curve (Hall et al., 2009) . 20Figure 2-12 Effect of texture on tire/pavement friction at different sliding speeds (Ueckermanand Wang, 2014; Flinstch et al., 2002 cited by Hall et al., 2009). . 21Figure 2-13 Key mechanism of tire/pavement friction (Hall et al., 2009) . 22Figure 2-14 (a) British Pendulum Tester (BPT), and (b) field operation. . 23Figure 2-15 (a) Dynamic Friction Tester (DFT) and (b) field operation . 24Figure 2-16 (a) GripTester, and (b) field operation . 26Figure 2-17 (a) Micro GripTester, and (b) field operation . 26Figure 2-18 Relationship between (a) BPN and macro-texture MPD and, (b) BPN and microtexture MPD (Serigos et al., 2014). . 29Figure 3-1 Axis convention and direction of movement . 33Figure 3-2 Linear translation stage (TS) . 34Figure 3-3 (a) Line Laser Scanner (LLS), and (b) field data collection . 35Figure 3-4 Longitudinal profiles and sampling rate . 36Figure 3-5 (a) 3D plot of original 800 transverse readings, and (b) 3D plot of 700 readings aftertrimming. 41Figure 3-6 (a) Dropouts in series, and (b) processed profile example . 42Figure 3-7 Example of negative values (a) 3D plot of original profiles, (b) histogram of originalprofiles, (c) 3D plot of processed profiles, and (b) histogram of processed profiles . 43Figure 3-8 Example of reflective pavement surface (a) 3D plot of original profiles, (b) histogramof original profiles, (c) 3D plot of processed profiles, and (b) histogram of processed profiles . 43Figure 3-9 (a) Macro-texture low-pass filter, (b) average PSD of macro-texture filtered profiles,(c) micro-texture band-pass filter, and (d) average PSD of micro-texture filtered profiles . 45Figure 3-10 Original profile and filtered profiles . 46Figure 3-11 (a) Micro-texture noise in valleys, and (b) Micro-texture processed profile . 47Figure 3-12 Micro-texture for the active area . 48Figure 3-13 Final profiles . 48Figure 4-1 Surface combination of macro- and micro-texture . 50Figure 4-2 Location of test sections . 51Figure 4-3 Typical gradation curves per asphalt surface type (based on TxDOT, 2014) . 53Figure 4-4 Field test sampling method . 56Figure 4-5 Location of the Line Laser Scanner (LLS) . 57Figure 5-1 Dynamic Friction Test (DFT) results . 59iv
Figure 5-2 British Pendulum Test (BPT) and Dynamic Friction Test (DFT) results . 60Figure 5-3 Micro GripTester and Dynamic Friction Test (DFT) results . 61Figure 5-4 Micro GripTester and British Pendulum Test (BPT) results . 61Figure 5-5 Mean texture depth (MTD) as a function of the mean profile depth (MPDCTM). . 62Figure 5-6 (a) Standard deviation of the mean profile depth (MPDCTM), and (b) standarddeviation of the root mean square (RMSCTM) . 63Figure 5-7 (a) Mean profile depth (MPD) from the CTM and from the LLS, and (b) root meansquare (RMS) from the CTM and from the LLS . 64Figure 5-8 (a) British pendulum number (BPN) as a function of the mean profile depth(MPDLLS), and its (b) description per surface type. 65Figure 5-9 (a) British pendulum number (BPN) as a function of the mean profile depth for themicro-texture component (MPDµ), and its (b) description per surface type. . 65Figure 5-10 BPN as a function of MPDLLS per flexible pavement type (a) limits, and (b)proposed pavement types groups . 67Figure 5-11 BPN as a function of MPDµ per flexible pavement type (a) limits, and (b) proposedpavement types groups . 67Figure 5-12 Representation of the (a) Model 1, and (b) Model 2 . 69v
List of TablesTable 2-1 Texture components . 5Table 2-2 Texture parameters used for pavement texture characterization . 15Table 3-1 Laser specifications (Keyence, 2015). 32Table 3-2 Linear translator specifications. 33Table 3-3 Comparison of laser systems used to characterize pavement texture. 39Table 4-1 Test sections . 52Table 4-2 Summary of samples per surface type . 52Table 4-3 Asphalt surface type description . 54Table 4-4 Texture and friction tests and parameters . 55Table 5-1 Friction Models Using Mean Profile Depth (MPD) as a Texture Parameter . 72Table 5-2 Friction models for different texture parameters . 74Table 5-3 Proposed friction models as a function of texture and HMA-type . 76vi
AcknowledgmentsWe want to acknowledge the support and sponsorship of the Center for HighwayPavement Preservation (CHPP), sponsored by the U.S. Secretary of Transportation under theUniversity Transportation Center (UTC) Program and the provision of matching funds by theCenter for Accelerating Innovation in Partnered Pavement Preservation of the University ofTexas at Austin, sponsored by the Texas Department of Transportation (TxDOT).vii
Executive SummaryHighway surface skid resistance has a significant influence on the number of wet weatheraccidents. For this reason, monitoring and managing skid resistance properties is crucial toreduce the number of highway accidents and fatalities. Current methodologies to measure roadfriction present several disadvantages that make them impractical for field data collection overlarge highway networks. Thus, it is important to study different ways to estimate surface frictioncharacteristics based on other properties that are easier to measure. It is widely recognized thatsurface texture is the primary pavement property controlling skid resistance. Therefore, the mainobjective of this study was to analyze surface macro- and micro-texture characteristics and toobserve their influence on friction.A Line Laser Scanner (LLS) was implemented to obtain an improved characterization ofthe pavement texture which includes the characterization of macro- and micro-texture usingdifferent parameters. Field measurements of friction and texture were collected in the field usingdifferent tests methods. Thirty-six pavement sections were evaluated, including different surfacetypes. The influence of texture on friction was assessed using various models including themacro- and micro-texture and the surface type. A series of statistical analyses using hypothesistesting were applied to evaluate these models.Among the main conclusions, it was found that there is not a unique relationship betweentexture and friction. The relationship between texture and friction is strong, but it is different foreach type of surface. Thus, regression analysis pooling all data cannot be utilized to quantify therelationship. Panel data analysis should be applied. Additionally, the prediction of friction issignificantly improved when incorporating information of both macro- and micro-texture into theprediction model. Therefore, a measure of micro-texture should be included into friction modelsbased on texture. Finally, among the study of different texture parameters, the mean profile depth(MPD) was the most significant parameter for macro- and for micro-texture to explain thedistinct friction measures.viii
CHAPTER 1 - INTRODUCTION1.1 BACKGROUNDAccording to the Federal Highway Administration (FHWA), in 2015, there were 18,695 fatalitiesas a result of roadway departure crashes in the United States (US), which was 53.3% of all thetraffic fatalities in the US Poor road conditions, especially wet pavement surface, have beenidentified as a major contributing factor in roadway departure crashes. Research conducted bythe National Transportation Safety Board (NTSB) and FHWA in 1980 indicates that about 70%of wet pavement crashes can be prevented or minimized by improving pavement friction.Pavement surfaces should be designed, constructed, and maintained to provide durable andadequate skid resistance properties for drivers.The texture of the pavement surface and the surface texture of the aggregate play a leading rolein providing high skid resistance to a pavement surface. Surface texture is the primary pavementproperty affecting the skid resistance. Micro-texture and macro-texture are the two key pavementsurface characteristics necessary for the development of a good skid resistance. Pavementsurface texture is influenced by many factors, such as aggregate type and size, mixture gradation,and texture orientation among others. Micro-texture refers to the small-scale texture of thepavement aggregate component, which controls contact between the tire rubber and thepavement surface. Macro-texture relates to the large-scale texture of the pavement due to theaggregate particle arrangement, which controls the flow of water from under the tire and, hence,the potential loss of skid resistance with increased speed under wet conditions.The effect of the aggregate texture (micro-texture) and the effect of the pavement surface macrotexture on the skid resistance of a highway surface are well recognized. However, there is a lackof fundamental understanding and quantification of the individual effect that each of theseproperties, micro- and macro-texture, have on the final skid properties of the road. Most researchstudies in this regard have been based on theory, assumptions and sound engineering judgment.The individual effects have not been quantified and their contribution to skid under differentconditions of moisture, speed and highway conditions are not well understood. Recentdevelopments in optics and computers allowed the collection of high definition 3-D images ofthe surface of the highway pavement. In particular, it is now possible to quantify micro-texture in1
the field in an effective and efficient manner. This can be done with the use of laser-basedtechnology that allows measurements below 0.5 mm (500 m).The subject of this report is the investigation of surface texture, focused on the influence oftexture on the friction of the road pavement, separating the effects of macro- and micro-texture.1.2 MAIN OBJECTIVESThe goal of this research effort was to study the effect of different texture components and theirparametric description on the skid resistance of a pavement surface. The main technicalobjectives were to: Develop a methodological framework to collect and process surface texturemeasurements using a high-resolution Line Laser Scanner (LLS), developed by theUniversity of Texas at Austin (UT Austin). Characterize highway pavement macro- and micro-texture using the LLS, to model andestimate friction. Analyze the influence of macro- and micro-texture in the development of surface skidresistance.1.3 SCOPE AND METHODOLOGYField measurements of friction and texture on different surfaces were collected on Texashighway network using various technologies. A high-resolution LLS was used to characterizesurface macro- and micro-texture. Signal processing techniques were used to separate the effectof the different texture components, i.e. macro- and micro-texture. Distinct surface textureparameters were evaluated. These parameters were then compared to determine the betterpredictors of friction. The effect of each of the surface texture component on the friction wasalso analyzed and quantified.The present study is limited to the prediction of friction based on texture information. Frictionmeasures were collected using different tests performed mainly at low speed such as the BritishPendulum test, the Dynamic Friction Test (DFT), and Micro GripTest.2
1.4 DESCRIPTION OF CONTENTThis report is divided into six chapters. The present chapter introduced the research problem, themain objectives and the methodology used to achieve the objectives. Chapter 2 presents aliterature review regarding texture and friction properties, characterization and measuringtechniques. Chapter 3 describes the development of characterization and processing of thetexture data using the LLS. Chapter 4 consists of the description of the friction and texture datacollection process. Chapter 5 presents the analysis of the measurements of texture and the effecton friction prediction. Finally, Chapter 6 provides a summary and the main findings andconclusions obtained in the study, along with recommendations for future work.3
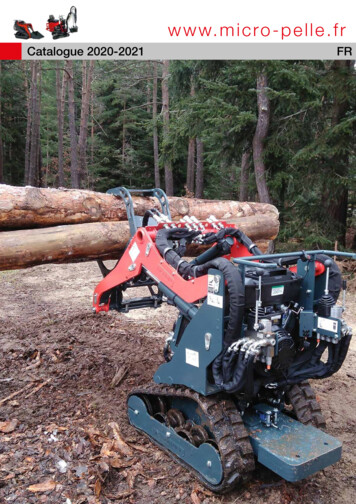
CHAPTER 2 - LITERATURE REVIEWPavement surfaces should be designed, constructed, and maintained with durable and adequatefriction and texture properties to achieve a good pavement performance and provide a safe ride.This chapter provides definitions for texture and friction, as well as the description of mostcommon methods used to measure and test these surface properties.2.1 TEXTUREPavement texture is the result of the deviations of the surface layer from a true planar surface(ASTM E867, 2012). Pavement texture is the most important feature of the road surface thatultimately determines most tire/pavement interactions, including friction, noise, splash-andspray, rolling resistance, and tire wear (Henry, 2000).A profile is a general description of the surface obtained using a sensor device, such as a needleor a laser. It is usually a two-dimensional sample of the surface texture described by twocoordinates: distance (longitudinal or transversal), and height. However, new technologies arenow allowing 3-D measurements of texture. This profile is considered as a stationary, randomfunction of the distance along the surface (Sandberg, 1998). Using Fourier analysis, this functioncan be mathematically represented as a series of sinusoidal components of various spatialfrequencies or texture wavelengths.The texture wavelength is the spatial period of a wave, as shown in Figure 2-1. Typically, thewavelength is given in longitude units (m or mm) and uses a lambda (λ) as a symbol. The spatialfrequency (f) is defined as the inverse of the wavelength; it is given in units of cycle/m. Thetexture amplitude is defined as the peak-to-peak height difference, as shown in Figure 2-1.4
Figure 2-1 Texture profile basic terminology2.1.1 Pavement Texture ComponentsThe World Road Association, previously Permanent International Association of RoadCongresses (PIARC), presented the first proposal for texture geometric-classification during theXVII World Road Congress (PIARC, 1983). This first classification includes three differentorders of surface irregularities based on pavement surface features: first order (micro-texture),second order (macro-texture), and third order (mega-texture).PIARC refined the first classification in order “to convert the study of pavement surface qualitieswith respect to phenomena affecting the road user into a study of the geometric characteristics ofpavement surfaces – more precisely the amplitudes and wavelengths of their irregularities”(PIARC, 1987). This classification includes a range of wavelength and amplitudes for eachtexture component, as presented in Table 2.1. Later, standard specifications such as AmericanSociety of Testing Materials (ASTM E867), International Organization for Standardization (ISO13473-1), and German Institute for Standardization (DIN on ISO 13473-1), accepted andincorporated these definitions. The ISO 13473-1 refined the terms by incorporating typicalamplitudes (Sandberg, 1998), as shown in Table 2.1.Micro-texture refers to the small-scale texture of the aggregate surface, which controls thecontact between the tire rubber and the pavement surface. Micro-texture is a function ofaggregate particle mineralogy and petrology, the aggregate source (natural or manufactured), andis affected by the environmental effects and the action of traffic (Hall et al., 2009; AASHTO,2008).Table 2-1 Texture componentsComponentWavelengthAmplitude (PIARC, 1987)Mega-textureMacro-textureMicro-texture50 to 500 mm0.5 to 50 mm0 to 0.5 mm1 to 50 mm0.2 to 10 mm0 to 0.2 mmTypical Amplitude ISO 13472-1(Sandberg, 1998)0.1 to 50 mm0.1 to 20 mm0.0001 to 0.5 mmMacro-texture refers to the large-scale texture of the pavement surface due to the aggregateparticle arrangement. In asphalt pavements, the mixture properties (aggregate shape, size, andgradation), which define the type of mixture and control the macro-texture. In concrete5
pavements, the method of finishing, such as dragging, tinning, grooving width and spacing, anddirection of the texturing, controls the macro-texture (Hall et al., 2009).Mega-texture has wavelengths in the same order of size as the tire/pavement interface. Examplesof mega-texture include ruts, potholes, and major joints and cracks. It affects vibration in the tirewalls, and it is therefore strongly associated with noise and rolling resistance (PIARC, 1983; Hallet al., 2009; AASHTO, 2008).A fourth level can also be considered: roughness or unevenness, with longer wavelengths thanmega-texture ( 500 mm). Roughness
Field measurements of friction and texture were collected using different tests methods. The friction characterization tests included the British Pendulum test (BPT), the Dynamic Friction test (DFT), and the Micro GripTester. Thirty-six different