Transcription
Bootstrap and SplinesSYS 6018 Spring 2021bootstrap.pdfContents1Introduction to the Bootstrap1.1 Required R Packages . . . . . . . . . . . . . . . . . . . . . . . . . . . . . . . . . . . . . .1.2 Uncertainty in a test statistic . . . . . . . . . . . . . . . . . . . . . . . . . . . . . . . . . .2222Bootstrapping Regression Parameters2.1 Bootstrap the β’s . . . . . . . . . . . . . . . . . . . . . . . . . . . . . . . . . . . . . . . .553Basis Function Modeling73.1 Piecewise Polynomials . . . . . . . . . . . . . . . . . . . . . . . . . . . . . . . . . . . . . 83.2 B-Splines . . . . . . . . . . . . . . . . . . . . . . . . . . . . . . . . . . . . . . . . . . . . 83.3 Bootstrap Confidence Interval for f (x) . . . . . . . . . . . . . . . . . . . . . . . . . . . . . 124More Bagging134.1 Out-of-Bag Samples . . . . . . . . . . . . . . . . . . . . . . . . . . . . . . . . . . . . . . 134.2 Number of Bootstrap Simulations . . . . . . . . . . . . . . . . . . . . . . . . . . . . . . . 165More Resources165.1 Variations of the Bootstrap . . . . . . . . . . . . . . . . . . . . . . . . . . . . . . . . . . . 17
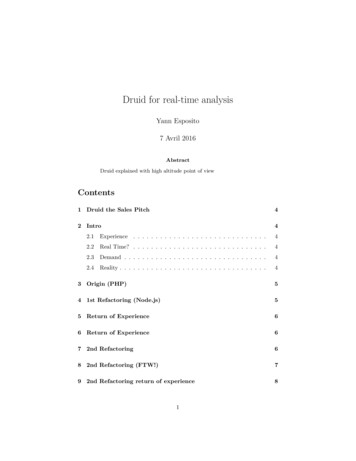
Bootstrap and Splines1SYS 6018 Spring 20212/17Introduction to the Bootstrap1.1Required R PackagesWe will be using the R packages of: boot for help with bootstrappingbroom for tidy extraction of model componentssplines for working with B-splinestidyverse for data manipulation and lines)library(tidyverse)1.2Uncertainty in a test statisticThere is often interest to understand the uncertainty in the estimated value of a test statistic. For example, let p be the actual/true proportion of customers who will use your company’s coupon. To estimate p, you decide to take a sample of n 200 customers and find that x 10 or p̂ 10/200 0.05 5% redeemed the coupon.1.2.1Confidence Interval It is common to calculate the 95% confidence interval (CI)CI(p) p̂ 2 · SE(p̂)sp̂(1 p̂)n 0.05 0.03 p̂ 2 This calculation is based on the assumption thatq p̂ is approximately normally distributed with the meanequal to the unknown true p, i.e., p̂ N (p,1.2.2p(1 p)n ).Bayesian Posterior DistributionIn the Bayesian world, you’d probably specify a Beta prior for p, i.e., p Beta(a, b) and calculate theposterior distribution p x 10 Beta(a x, b n x) which would fully characterize the uncertainty.
Bootstrap and SplinesSYS 6018 Spring 20213/17Prior Beta(1,1) [Uniform]20densitymodelCIposteriorprior1000.00 0.02 0.04 0.06 0.08 0.10 0.12 0.14 0.16 0.18 0.20 0.22 0.24 0.26p1.2.3The Bootstrap The Boostrap is a way to assess the uncertainty in a test statistic using resampling. The idea is to simulate the data from the empirical distribution, which puts a point mass of 1/n at eachobserved data point (i.e., sample the original data with replacement).original5.0sample 14.7sample 25.1sample 3– It is important to simulate n observations (same size as original data) because the uncertainty inthe test statistic is a function of n4.8012345678910value Then, calculate the test statistic for each bootstrap sample. The variability in the collection of bootstraptest statistics should be similar to the variability in the test statistic.
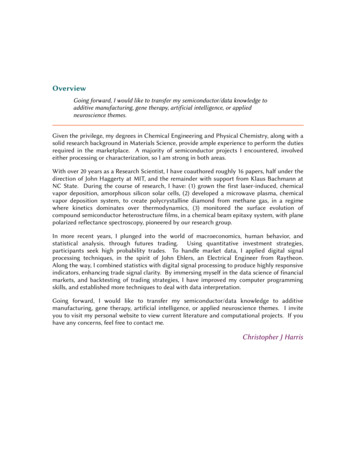
Bootstrap and SplinesSYS 6018 Spring 20214/17Algorithm: Nonparametric/Empirical BootstrapObserve data D [X1 , X2 , . . . , Xn ] (n observations).Calculate a test statistic θ̂ θ̂(D), which is a function of D.Repeat steps 1 and 2 M times:1. Simulate D , a new data set of n observations by sampling from D with replacement.2. Calculate the bootstrap test statistic θ̂ θ̂(D ) can be used to estimate the distribution of θ̂.The bootstrapped samples θ̂1 , θ̂2 , . . . , θ̂M Or properties of the distribution, like standard deviation (standard error), percentiles, etc.#-- Original Datax c(rep(1, 10), rep(0, 190))n length(x)# 10 successes, 190 failures# length of observed data#-- Bootstrap DistributionM 2000# number of bootstrap samplesp numeric(M)# initialize vector for test statisticset.seed(201910)# set random seedfor(m in 1:M){#- sample from empirical distributionind sample(n, replace TRUE)# sample indices with replacementxboot x[ind]# bootstrap sample#- calculate proportion of successesp[m] mean(xboot)# calculate test statistic}#-- Bootstrap Percentile based confidence Intervalsquantile(p, probs c(.025, .975))# 95% bootstrap interval# 2.5% 97.5%# 0.02 0.08Prior Beta(1,1) 00.00 0.02 0.04 0.06 0.08 0.10 0.12 0.14 0.16 0.18 0.20 0.22 0.24 0.26p
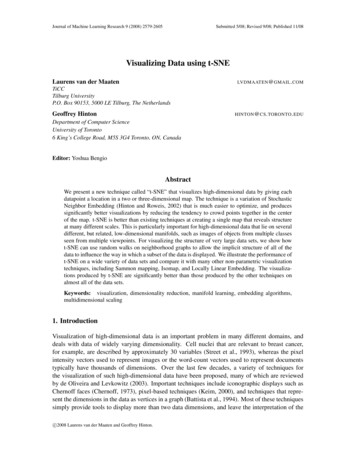
Bootstrap and SplinesSYS 6018 Spring 20215/17 Notice that in the above example the bootstrap distribution is close to the Bayesian posterior distribution(using the uninformative Uniform prior). This is no accident, it turns out there is a close correspondence between the bootstrap derived distributionand the Bayesian posterior distribution under uninformative priors– See ESL 8.4 for more details2Bootstrapping Regression ParametersThe bootstrap is not limited to univariate test statistics. It can be used on multivariate test statistics.Consider the uncertainty in estimates of the parameters (i.e., β coefficients) of a regression model.10y50 50.00.20.40.60.81.0xm1 lm(y x, data data train) # fit simple OLSbroom::tidy(m1, conf.int TRUE)# OLS estimated coefficients# # A tibble: 2 x 7# termestimate std.error statistic p.value conf.low conf.high# chr dbl dbl dbl dbl dbl dbl # 1 (Intercept)6.480.58411.1 5.39e-195.327.64# 2 x-7.371.06-6.97 3.69e-10-9.47-5.27vcov(m1) % % round(2)# variance matrix# (Intercept)x# (Intercept)0.34 -0.54# x-0.54 1.122.1Bootstrap the β’s#-- Bootstrap DistributionM 2000beta matrix(NA, M, 2)set.seed(201910)for(m in 1:M){# number of bootstrap samples# initialize vector for test statistics# set random seed
Bootstrap and SplinesSYS 6018 Spring 20216/17#- sample from empirical distributionind sample(n, replace TRUE)# sample indices with replacementdata.boot data train[ind,]# bootstrap sample#- fit regression modelm.boot lm(y x, data data.boot) # fit simple OLS#- save test statisticsbeta[m, ] coef(m.boot)}#- convert to tibble (and add column names)beta as tibble(beta, .name repair "unique") % %setNames(c('intercept', 'slope'))#- Plotggplot(beta, aes(intercept, slope)) geom point() geom point(data tibble(intercept coef(m1)[1],slope coef(m1)[2]), color "red", size 4)slope 5.0 7.5 10.045678intercept#- bootstrap estimatevar(beta) % % round(2)# intercept slope# intercept0.58 -0.87# slope-0.87 1.49apply(beta, 2, sd) % % round(2)# interceptslope# 0.761.22# varaince matrix# standard errors (sqrt of diagonal)9
Bootstrap and Splines3SYS 6018 Spring 20217/17Basis Function ModelingFor a univariate x, a linear basis expansion isfˆ(x) Xθ̂j bj (x)jwhere bj (x) is the value of the jth basis function at x and θj is the coefficient to be estimated. The bj (x) are usually specified in advanced (i.e., not estimated)Examples: Linear Regression Polynomial Regressionfˆ(x) β̂0 β̂1 xfˆ(x) dXβ̂j xjj 1b1 (x) 1bj (x) xjb2 (x) x2.081.56basisb1basis1.0b1 y1.52.0xx 5 5 10y 6.48 7.37x 100.000.250.50x0.751.00y 0.16 48.96x 108.29I(x 2) 57.43I(x 3)0.000.250.50x0.751.00
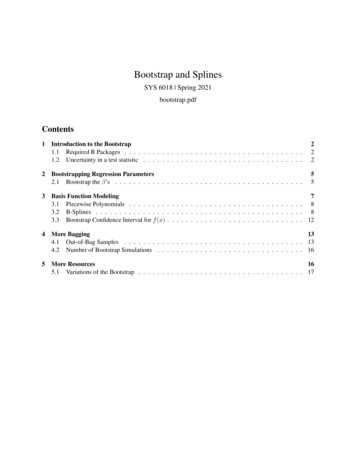
Bootstrap and Splines3.1Piecewise Polynomials3.2B-SplinesSYS 6018 Spring 20218/17 A degree 0 B-spline is a regressogram basis. Will lead to a piecewise constant fit. A degree 3 B-spline (called cubic splines) is similar in shape to a Gaussian pdf. But the B-spline hasfinite support and facilitates quick computation (due to the induced sparseness).3.2.1Parameter EstimationIn matrix notation,fˆ(x) Xj B θ̂θ̂j bj (x)
Bootstrap and SplinesSYS 6018 Spring 20219/17B splines of degree 01.000.750.500.250.00B splines of degree 11.000.750.500.250.00B splines of degree 21.000.750.500.250.00B splines of degree 9xFigure 1: Like ESL Fig 5.20, B-splines (knots shown by vertical dashed lines)where B is the basis matrix. For example, a polynomial matrix is 1 X1 . . . X1J 1 X2 . . . X2J B . . .1 Xn . . . XnJ More generally, b1 (x1 ) b2 (x1 ) . . . bJ (x1 ) b1 (x2 ) b2 (x2 ) . . . bJ (x2 ) B . . .b1 (xn ) b2 (xn ) . . . bJ (xn ) Now, its in a form just like linear regression! Estimate with OLSθ̂ (B T B) 1 B T Y1.0
Bootstrap and SplinesSYS 6018 Spring 202110/1710model525 knots: deg 3y6 knots: deg 06 knots: deg 3truth0 50.000.250.500.751.00x It may be helpful to think of a basis expansion as similar to a dummy coding for categorical variables.– This expands the single variable x into df new variables. In R, the function bs() can be put directly in formula to make a B-spline.#- fit a 5 df B-spline# Note: don't need to include an intercept in the lm()# Note: the boundary.knots are set just a bit outside the range of the data#so prediction is possible outside the range (see below for usage).#You probably won't need to set this in practice.kts.bdry c(-.2, 1.2)model bs lm(y bs(x, df 5, deg 3, Boundary.knots kts.bdry)-1,data data train)tidy(model bs)# # A tibble: 5 x 5# termestimate std.error statistic p.value# chr dbl dbl dbl dbl # 1 bs(x, df 5, deg 3, Boundary.knots -2.501.51-1.65 1.02e- 1# 2 bs(x, df 5, deg 3, Boundary.knots 10.91.278.61 1.53e-13# 3 bs(x, df 5, deg 3, Boundary.knots -0.2411.53-0.157 8.76e- 1# 4 bs(x, df 5, deg 3, Boundary.knots -4.713.07-1.53 1.28e- 1# 5 bs(x, df 5, deg 3, Boundary.knots 1.456.900.211 8.34e- 1ggplot(data train, aes(x,y)) geom point() geom smooth(method 'lm', formula 'y bs(x, df 5, deg 3, Boundary.knots kts.bdry)-1')
Bootstrap and SplinesSYS 6018 Spring 202111/1710y50 50.000.250.500.751.00x Setting df 5 will create a B-spline design matrix with 5 columns– So there are 5 basis functions The number of (internal) knots is equal to df-degree and at equally spaced quantiles of the data– With df 5 and deg 3, there are 2 internal knots at the 33.33% and 66.66% percentiles of x105basis10y234 55 10 150.000.250.500.75x1.001.25
Bootstrap and Splines3.3SYS 6018 Spring 202112/17Bootstrap Confidence Interval for f (x)Bootstrap can be used to understand the uncertainty in the fitted values#-- Bootstrap CI (Percentile Method)M 100# number of bootstrap samplesdata eval tibble(x seq(0, 1, length 300)) # evaluation pointsYHAT matrix(NA, nrow(data eval), M)# initialize matrix for fitted values#-- Spline Settingsfor(m in 1:M){#- sample from empirical distributionind sample(n, replace TRUE)# sample indices with replacement#- fit bspline modelm boot lm(y bs(x, df 5, Boundary.knots kts.bdry)-1,data data train[ind,])# fit bootstrap data#- predict from bootstrap modelYHAT[,m] predict(m boot, newdata data eval)}#-- Convert to tibble and plotdata fit as tibble(YHAT) % %bind cols(data eval) % %gather(simulation, y, -x)# convert matrix to tibble# add the eval points# convert to long formatggplot(data train, aes(x,y)) geom smooth(method 'lm',formula as.formula('y bs(x, df 5, deg 3, Boundary.knots kts.bdry)-1')) geom line(data data fit, color "red", alpha .10, aes(group simulation)) geom point()10y50 50.000.250.500.75x#-- Calculate Confidence intervals## for a 90% CI, find the upper and lower 5% values at every x location## Homework Exercise1.00
Bootstrap and Splines4SYS 6018 Spring 202113/17More Bagging4.1Out-of-Bag SamplesYour Turn #1 : Observations not in bootstrap sampleWhat is the expected number of observations that will not be in a bootstrap sample? Suppose nobservations.
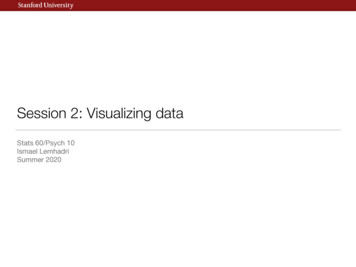
Bootstrap and SplinesSYS 6018 Spring 202114/17Let’s look at a few bootstrap fits:B Spline with df 10Red dots are out of bag5Original100 55Boot 110n0y12 531045Boot 250 55Boot 3100 50.000.250.500.751.00x Notice that each bootstrap sample does not include about 37% of the original observations. These are called out-of-bag samples and can be used to assess model fit– The out-of-bag observations were not used to estimate the model parameters, so will be sensitiveto over/under fitting Below, we evaluate the oob error over the spline complexity (df number of estimated coefficients)
Bootstrap and SplinesSYS 6018 Spring 2021M 500DF seq(4, 15, by 1)results tibble()set.seed(2019)15/17# number of bootstrap samples# edfs for spline#-- Spline Settingsfor(m in 1:M){#- sample from empirical distributionind sample(n, replace TRUE)# sample indices with replacementoob.ind which(!(1:n %in% ind))# out-of-bag samples#- fit bspline modelsfor(df in DF){if(length(oob.ind) 1) next#- fit with bootstrap datam boot lm(y bs(x, df df, Boundary.knots kts.bdry)-1,data data train[ind,])#- predict on oob datayhat.oob predict(m boot, newdata data train[oob.ind, ])#- get errorssse sum( (data train y[oob.ind] - yhat.oob)ˆ2 )n.oob length(oob.ind)#- save resultsresults bind rows(results,tibble(m, df, sse, n.oob))}}results % % group by(df) % % summarize(mse sum(sse)/sum(n.oob)) % %ggplot(aes(df, mse)) geom point() geom line() geom point(data . % % filter(mse min(mse)), color "red", size 3) scale x continuous(breaks 1:20)mse6.05.65.24.8456789101112131415df The minimum out-of-bag error occurs at df 5. This matches the optimal complexity in a polynomialfit from the previous lecture notes.
Bootstrap and SplinesSYS 6018 Spring 202116/1710model5bspline 5yknn 15poly 4true0 50.000.250.500.751.00x4.2Number of Bootstrap SimulationsHesterberg recommends using M 15,000 for real applications to remove most of the Monte Carlovariability. For the examples in class I used much less to demonstrate the principles.5More Resources Bootstrap– ISL 5.2– ESL 7.11 Splines– ISL 7.2-7.5– ESL 5.1-5.4 What Teachers Should Know About the Bootstrap: Resampling in the Undergraduate StatisticsCurriculum, by Tim C. Hesterberg The boot package and boot() function provides some more advanced options for bootstr
Bootstrap and Splines SYS 6018 Spring 2021 3/17 0 10 20 0.00 0.02 0.04 0.06 0.08 0.10 0.12 0.14 0.16 0.18 0.20 0.22 0.24 0.26 p density model CI posterior