Transcription
Q4Quarterly Market ReviewFourth Quarter 2018
Quarterly Market ReviewFourth Quarter 2018This report features world capital market performance and aOverview:timeline of events for the past quarter. It begins with a globaloverview, then features the returns ofMarket Summarystock and bond asset classes in the US andinternational markets.World Stock Market PerformanceThe report also illustrates the impact of globally diversifiedWorld Asset Classesportfolios and features a quarterly topic.US StocksInternational Developed StocksEmerging Markets StocksSelect Country PerformanceSelect Currency Performance vs. US DollarReal Estate Investment Trusts (REITs)CommoditiesFixed IncomeGlobal Fixed IncomeImpact of DiversificationQuarterly Topic: Why Should You Diversify?2
Quarterly Market SummaryIndex ReturnsUS StockMarketInternationalDevelopedStocksQ4 dMarketex USUS %4.6%4.6%2009 Q22009 Q22009 Q22009 Q32001 Q32008 Q4-22.8%-21.2%-27.6%-36.1%-3.0%-2.7%2008 Q42008 Q42008 Q42008 Q42016 Q42015 Q2Since Jan. 2001Avg. Quarterly ReturnBestQuarterWorstQuarterPast performance is not a guarantee of future results. Indices are not available for direct investment. Index performance does not reflect the expenses associated with the management of an actual portfolio.Market segment (index representation) as follows: US Stock Market (Russell 3000 Index), International Developed Stocks (MSCI World ex USA Index [net div.]), Emerging Markets (MSCI Emerging Markets Index [net div.]),Global Real Estate (S&P Global REIT Index [net div.]), US Bond Market (Bloomberg Barclays US Aggregate Bond Index), and Global Bond Market ex US (Bloomberg Barclays Global Aggregate ex-USD Bond Index [hedged toUSD]). S&P data 2019 S&P Dow Jones Indices LLC, a division of S&P Global. All rights reserved. Frank Russell Company is the source and owner of the trademarks, service marks, and copyrights related to the RussellIndexes. MSCI data MSCI 2019, all rights reserved. Bloomberg Barclays data provided by Bloomberg.3
Long-Term Market SummaryIndex ReturnsUS StockMarketInternationalDevelopedStocks1 YearEmergingMarketsStocksGlobalRealEstateUS BondMarketSTOCKSGlobalBondMarketex 3.98%5 Years10 YearsPast performance is not a guarantee of future results. Indices are not available for direct investment. Index performance does not reflect the expenses associated with the management of an actual portfolio.Market segment (index representation) as follows: US Stock Market (Russell 3000 Index), International Developed Stocks (MSCI World ex USA Index [net div.]), Emerging Markets (MSCI Emerging Markets Index [net div.]),Global Real Estate (S&P Global REIT Index [net div.]), US Bond Market (Bloomberg Barclays US Aggregate Bond Index), and Global Bond Market ex US (Bloomberg Barclays Global Aggregate ex-USD Bond Index [hedged toUSD]). S&P data 2019 S&P Dow Jones Indices LLC, a division of S&P Global. All rights reserved. Frank Russell Company is the source and owner of the trademarks, service marks, and copyrights related to the RussellIndexes. MSCI data MSCI 2019, all rights reserved. Bloomberg Barclays data provided by Bloomberg.4
World Stock Market PerformanceMSCI All Country World Index with selected headlines from Q4 2018270260250240230220210Sep 30“US UnemploymentRate Falls toLowest LevelSince 1969”Oct 31“MortgageRates FastApproaching5%, a FreshBlow toHousingMarket”“IMF Lowers GlobalGrowth Forecastsfor 2018 and 2019”“US GovernmentDeficit Grew 17%in Fiscal 2018”“Eurozone GrowthStutters as USEconomy PowersAhead”Nov 30“Midterm ElectionsProduce a DividedCongress”“Wages Rise atFastest Rate inNearly a Decadeas Hiring Jumps”“US Stocks HitHard as TechWorries Deepen”“Japanese EconomyShrinks as NaturalDisasters Take aToll”“US, Mexico,and CanadaSign Pact toReplaceNAFTA”“Existing-HomeSales SufferLargest AnnualDrop in Four Years”Dec 31“Oil Prices DropSharply asOPECStruggles toAgree on Cuts”“FrenchAntigovernmentProtest PlungesParis in Havoc”“May Survives aParty Revolt, ButBrexit’s Path IsUnclear”“Small-Cap StocksTeeter on theEdge of a BearMarket”“US Indexes Closewith Worst YearlyLosses Since 2008”These headlines are not offered to explain market returns. Instead, they serve as a reminder that investors should view daily events from a long-term perspective and avoid makinginvestment decisions based solely on the news.Graph Source: MSCI ACWI Index [net div.]. MSCI data MSCI 2019, all rights reserved.It is not possible to invest directly in an index. Performance does not reflect the expenses associated with management of an actual portfolio. Past performance is not a guarantee of future results.5
World Stock Market PerformanceMSCI All Country World Index with selected headlines from past 12 monthsLONG TERM (2000-Q4 2018)300SHORT TERM (Q1 2018–Q4 2018)200Last ec 31“Nasdaq Crests7000 as TechGiants RoarInto 2018”“US ImposesNew Tariffs,Ramping Up'America First'Trade Policy”Mar 31“Congress PassesMammothSpending Bill,Averts Shutdown”Jun 30“Trump PullsUS Out ofIran Deal”“Yield on 10-YearUS GovernmentBond Hits 3% forFirst Time in Years”“Inflation RateHits Six-YearHigh in May”“US, China TariffsHit AmericanMade Productsfrom Chips toCars”Sep 30“Profits Surgeat Big USFirms”“US JoblessClaims HitLowest Levelsince 1969”“China’s TradeSurplus withUS Hits NewRecord”Dec 31“USUnemploymentRate Falls toLowest LevelSince 1969”“Nasdaq Crosses “Fed Raises8000 Threshold Interest Rates,for First Time”Signals OneMore IncreaseThis Year”“Midterm“Oil Prices DropElectionsSharply asProduce a OPEC StrugglesDividedto Agree onCongress” Cuts”“EurozoneGrowthStutters asUS EconomyPowersAhead”“Existing-HomeSales SufferLargest AnnualDrop in FourYears”“US IndexesClose withWorst YearlyLosses Since2008”These headlines are not offered to explain market returns. Instead, they serve as a reminder that investors should view daily events from a long-term perspective and avoid makinginvestment decisions based solely on the news.Graph Source: MSCI ACWI Index [net div.]. MSCI data MSCI 2019, all rights reserved.It is not possible to invest directly in an index. Performance does not reflect the expenses associated with management of an actual portfolio. Past performance is not a guarantee of future results.6
World Asset ClassesFourth Quarter 2018 Index Returns (%)Equity markets around the world posted negative returns for the quarter. Looking at broad market indices, emerging markets outperformed developedmarkets, including the US.Value stocks were positive vs. growth stocks in all markets, including the US. Small caps underperformed large caps in the US and non-US developedmarkets but outperformed in emerging markets.REIT indices outperformed equity market indices in both the US and non-US developed markets.Bloomberg Barclays US Aggregate Bond Index1.64One-Month US Treasury Bills0.56S&P Global ex US REIT Index (net div.)-4.68Dow Jones US Select REIT Index-6.61MSCI Emerging Markets Value Index (net div.)-6.75MSCI Emerging Markets Small Cap Index (net div.)-7.18MSCI Emerging Markets Index (net div.)-7.47MSCI All Country World ex USA Index (net div.)-11.46Russell 1000 Value Index-11.72MSCI World ex USA Value Index (net div.)-12.05MSCI World ex USA Index (net div.)-12.78S&P 500 Index-13.52Russell 1000 Index-13.82Russell 3000 Index-14.30MSCI World ex USA Small Cap Index (net div.)Russell 2000 Value Index-16.16-18.67Russell 2000 Index -20.20Past performance is not a guarantee of future results. Indices are not available for direct investment. Index performance does not reflect the expenses associated with the management of an actual portfolio. TheS&P data is provided by Standard & Poor's Index Services Group. Frank Russell Company is the source and owner of the trademarks, service marks, and copyrights related to the Russell Indexes. MSCI data MSCI 2019, allrights reserved. Dow Jones data 2019 S&P Dow Jones Indices LLC, a division of S&P Global. All rights reserved. S&P data 2019 S&P Dow Jones Indices LLC, a division of S&P Global. All rights reserved. BloombergBarclays data provided by Bloomberg. Treasury bills Stocks, Bonds, Bills, and Inflation Yearbook , Ibbotson Associates, Chicago (annually updated work by Roger G. Ibbotson and Rex A. Sinquefield).7
US StocksFourth Quarter 2018 Index ReturnsUS equities underperformed both non-US developed andRanked Returns for the Quarter (%)emerging markets.Value outperformed growth in the US across large and smallLarge Value-11.72Large Capcap stocks.Small caps underperformed large caps in the US.-13.82Marketwide-14.30Large Growth-15.89Small ValueSmall CapSmall GrowthWorld Market Capitalization—US-18.67-20.20-21.65Period Returns (%)Asset Class54%US Market 25.1 trillion* Annualized1 Year3 Years**5 Years** 10 Years**Large Growth-1.5111.1510.4015.29Large arge Value-8.276.955.9511.18Small Growth-9.317.245.1313.52Small Cap-11.017.364.4111.97Small Value-12.867.373.6110.40Past performance is not a guarantee of future results. Indices are not available for direct investment. Index performance does not reflect the expenses associated with the management of an actual portfolio.Market segment (index representation) as follows: Marketwide (Russell 3000 Index), Large Cap (Russell 1000 Index), Large Cap Value (Russell 1000 Value Index), Large Cap Growth (Russell 1000 Growth Index), Small Cap(Russell 2000 Index), Small Cap Value (Russell 2000 Value Index), and Small Cap Growth (Russell 2000 Growth Index). World Market Cap represented by Russell 3000 Index, MSCI World ex USA IMI Index, and MSCIEmerging Markets IMI Index. Russell 3000 Index is used as the proxy for the US market. Frank Russell Company is the source and owner of the trademarks, service marks, and copyrights related to the Russell Indexes. MSCIdata MSCI 2019, all rights reserved.8
International Developed StocksFourth Quarter 2018 Index ReturnsIn US dollar terms, developed markets outside the USRanked Returns for the Quarter (%)Local currencyUS currencyoutperformed the US equity market but underperformedemerging markets during the quarter.-11.24-12.05ValueValue outperformed growth across large and small cap stocks.Small caps underperformed large caps in non-US-12.05-12.78Large Capdeveloped markets.-12.81-13.48GrowthSmall CapWorld Market Capitalization—International Developed34%InternationalDeveloped Market 16.0 trillion-15.71-16.16* AnnualizedPeriod Returns (%)Asset Class1 Year3 Years**5 Years**10 Years**Growth-13.142.841.366.74Large Cap-14.093.110.346.24Value-15.063.36-0.735.69Small Cap-18.073.852.2510.06Past performance is not a guarantee of future results. Indices are not available for direct investment. Index performance does not reflect the expenses associated with the management of an actual portfolio.Market segment (index representation) as follows: Large Cap (MSCI World ex USA Index), Small Cap (MSCI World ex USA Small Cap Index), Value (MSCI World ex USA Value Index), and Growth (MSCI World ex USAGrowth Index). All index returns are net of withholding tax on dividends. World Market Cap represented by Russell 3000 Index, MSCI World ex USA IMI Index, and MSCI Emerging Markets IMI Index. MSCI World ex USA IMIIndex is used as the proxy for the International Developed market. MSCI data MSCI 2019, all rights reserved. Frank Russell Company is the source and owner of the trademarks, service marks, and copyrights related to theRussell Indexes.9
Emerging Markets StocksFourth Quarter 2018 Index ReturnsIn US dollar terms, emerging markets outperformed developedRanked Returns for the Quarter (%)Local currencyUS currencymarkets, including the US.Value outperformed growth across large and small cap stocks.-6.68-6.75ValueSmall caps outperformed large caps.-7.29-7.18Small Cap-7.43-7.47Large CapGrowthWorld Market Capitalization—Emerging Markets12%Emerging Markets 5.4 trillion-8.19-8.22Period Returns (%)* AnnualizedAsset Class1 Year3 Years**5 Years**10 Years**Value-10.749.520.516.99Large Cap-14.589.251.658.02Growth-18.268.892.678.97Small Cap-18.593.680.959.87Past performance is not a guarantee of future results. Indices are not available for direct investment. Index performance does not reflect the expenses associated with the management of an actual portfolio.Market segment (index representation) as follows: Large Cap (MSCI Emerging Markets Index), Small Cap (MSCI Emerging Markets Small Cap Index), Value (MSCI Emerging Markets Value Index), and Growth (MSCIEmerging Markets Growth Index). All index returns are net of withholding tax on dividends. World Market Cap represented by Russell 3000 Index, MSCI World ex USA IMI Index, and MSCI Emerging Markets IMI Index. MSCIEmerging Markets IMI Index used as the proxy for the emerging market portion of the market. MSCI data MSCI 2019, all rights reserved. Frank Russell Company is the source and owner of the trademarks, service marks,and copyrights related to the Russell Indexes.10
Select Country PerformanceFourth Quarter 2018 Index ReturnsIn US dollar terms, New Zealand and Hong Kong recorded the highest country performance in developed markets, while Austria and Norway posted thelowest returns for the quarter. In emerging markets, Brazil and Indonesia recorded the highest country performance, while Columbia and Pakistan postedthe lowest performance.Ranked Developed Markets Returns (%)New ZealandHong orway -20.48Ranked Emerging Markets Returns ppinesTurkeyIndiaPoland-2.88Peru-3.05South .04Czech bia-19.69Pakistan -21.0214.288.287.545.805.463.443.20Past performance is not a guarantee of future results. Indices are not available for direct investment. Index performance does not reflect the expenses associated with the management of an actual portfolio.Country performance based on respective indices in the MSCI World ex US IMI Index (for developed markets), MSCI USA IMI Index (for US), and MSCI Emerging Markets IMI Index. All returns in USD and net of withholdingtax on dividends. MSCI data MSCI 2019, all rights reserved. UAE and Qatar have been reclassified as emerging markets by MSCI, effective May 2014.11
Select Currency Performance vs. US DollarFourth Quarter 2018In developed markets, currencies mostly depreciated vs. the US dollar with a few exceptions, including the Japanese yen, which appreciated over 3.5%. Inemerging markets, currencies were mixed against the US dollar, ranging from 12% to –10%.Ranked Developed Markets (%)Ranked Emerging Markets (%)Japanese yen (JPY)3.53New Zealand dollar (NZD)1.15Swedish krona (SEK)0.31Turkish lira (TRY)12.92Indian rupee (INR)3.83Indonesia rupiah (IDR)3.63Brazilian real (BRL)3.04Philippine peso (PHP)Singapore dollar (SGD)0.25Hong Kong dollar (HKD)-0.062.75Chinese yuan (CNY)0.22Malaysian ringgit (MYR)0.15Egyptian pound (EGP)Swiss franc (CHF)-0.91Euro (EUR)-1.58Danish krone (DKK)-1.65British pound (GBP)-2.34Israel shekel (ILS)-2.69Australian dollar (AUD)-2.70Canadian dollar (CAD)Norwegian krone (NOK)-5.36-5.960.00South Korean won (KRW)-0.59Taiwanese NT dollar (TWD)-0.66Thailand baht (THB)-0.68Hungary forint (HUF)-0.77Czech koruna (CZK)-1.41South African rand (ZAR)-1.62Poland zloty (PLN)-1.88Peru sol (PEN)-2.36Chilean peso (CLP)-4.96Mexican peso (MXN)-5.05Russian ruble (RUB)Colombian peso (COP)Pakistani rupee (PKR)-5.59-8.56-10.53Past performance is not a guarantee of future results. Indices are not available for direct investment. Index performance does not reflect the expenses associated with the management of an actual portfolio.MSCI data MSCI 2019, all rights reserved.12
Real Estate Investment Trusts (REITs)Fourth Quarter 2018 Index ReturnsNon-US real estate investment trusts outperformed US REITsRanked Returns for the Quarter (%)in US dollar terms.Global REITS (ex US)US REITSTotal Value of REIT StocksWorld ex US 436 billion245 REITs(22 othercountries)-6.61* AnnualizedPeriod Returns (%)Asset Class42%-4.6858%1 Year3 Years**5 Years** 10 Years**US REITS-4.221.977.8912.05Global REITS-7.423.353.398.94US 601 billion97 REITsPast performance is not a guarantee of future results. Indices are not available for direct investment. Index performance does not reflect the expenses associated with the management of an actual portfolio.Number of REIT stocks and total value based on the two indices. All index returns are net of withholding tax on dividends. Total value of REIT stocks represented by Dow Jones US Select REIT Index and the S&P Global ex USREIT Index. Dow Jones US Select REIT Index used as proxy for the US market, and S&P Global ex US REIT Index used as proxy for the World ex US market. Dow Jones and S&P data 2019 S&P Dow Jones Indices LLC, adivision of S&P Global. All rights reserved.13
CommoditiesFourth Quarter 2018 Index ReturnsThe Bloomberg Commodity Index Total Return declined 9.41%Ranked Returns for Individual Commodities (%)during the fourth quarter of 2018, bringing the total annualSugarreturn to –11.25%.7.41GoldSugar led quarterly performance with a gain of 7.41%. Energywas the worst-performing complex, with WTI crude oil andunleaded gas declining by 37.87% and 37.78%, e cattle1.33Natural gas-0.63Soybean meal-1.07Lean hogs-2.96Wheat-3.08Coffee-3.73Zinc-4.38Soybean oil* AnnualizedCopper5 Years** 10 Years**CottonPeriod Returns (%)Asset ClassQTR1 Year 3 .77-7.50Kansas wheat-8.50Aluminum-11.43Nickel-15.66Heating oilBrent crude oil-28.38-34.99Unleaded gas -37.78WTI crude oil -37.87Past performance is not a guarantee of future results. Index is not available for direct investment. Index performance does not reflect the expenses associated with the management of an actual portfolio.Commodities returns represent the return of the Bloomberg Commodity Total Return Index. Individual commodities are sub-index values of the Bloomberg Commodity Total Return Index. Data provided by Bloomberg.14
Fixed IncomeFourth Quarter 2018 Index ReturnsInterest rate changes across the USUS Treasury Yield Curve (%)Bond Yield across Issuers (%)fixed income market were mixed duringthe fourth quarter of 2018. The yield on4.004.36the 5-year Treasury note declined 43basis points (bps), ending the quarter at9/28/20183.0012/31/20182.51%. The yield on the 10-yearTreasury note decreased 36 bps to12/31/20173.303.52State andLocalMunicipalsAAA-AACorporates2.692.002.69%. The 30-year Treasury bond yielddecreased 17 bps to finish at 3.02%. For1.002018, yields on the 10-year Treasuryand 30-year Treasury increased 29 bpsand 28 bps, respectively.0.001Yr5Yr10Yr30Yr10-Year USTreasuryA-BBBCorporatesIn terms of total returns, short-termcorporate bonds increased 0.78% duringthe quarter. Intermediate-term corporate*AnnualizedPeriod Returns (%)Asset ClassQTR1 YearBloomberg Barclays US Government Bond Index Long4.16-1.792.635.904.15Total returns for short-term municipalBloomberg Barclays Municipal Bond Index1.691.282.303.824.85bonds were 1.10% for the quarter.Bloomberg Barclays US Aggregate Bond Index1.640.012.062.523.48FTSE World Government Bond Index 1-5 Years (hedged to USD)1.532.121.581.531.69FTSE World Government Bond Index 1-5 Years0.94-0.761.56-0.820.29ICE BofAML 1-Year US Treasury Note Index0.781.861.060.700.62ICE BofAML US 3-Month Treasury Bill Index0.561.871.020.630.37Bloomberg Barclays US TIPS Index-0.42-1.262.111.693.64Bloomberg Barclays US High Yield Corporate Bond Index-4.53-2.087.233.8311.12bonds had a total return of 0.58%.Intermediate-term municipal bondsreturned 2.00%.3 Years** 5 Years** 10 Years**One basis point equals 0.01%. Past performance is not a guarantee of future results. Indices are not available for direct investment. Index performance does not reflect the expenses associated with themanagement of an actual portfolio. Yield curve data from Federal Reserve. State and local bonds are from the S&P National AMT-Free Municipal Bond Index. AAA-AA Corporates represent the Bank of America Merrill LynchUS Corporates, AA-AAA rated. A-BBB Corporates represent the ICE BofAML Corporates, BBB-A rated. Bloomberg Barclays data provided by Bloomberg. US long-term bonds, bills, inflation, and fixed income factor data Stocks, Bonds, Bills, and Inflation (SBBI) Yearbook , Ibbotson Associates, Chicago (annually updated work by Roger G. Ibbotson and Rex A. Sinquefield). FTSE fixed income indices 2019 FTSE Fixed Income LLC, all rightsreserved. ICE BofAML index data 2019 ICE Data Indices, LLC. S&P data 2019 S&P Dow Jones Indices LLC, a division of S&P Global. All rights reserved.15
Global Fixed IncomeFourth Quarter 2018 Yield CurvesUSInterest rates in the global developedUKmarkets generally decreased during4.0the quarter.4.09/30/201812/31/20183.03.0global developed markets.2.0Yield (%)outperformed shorter-term bonds in theYield (%)Longer-term bonds generally1.00.09/30/201812/31/20182.01.00.0For the year, longer-term bonds-1.0underperformed shorter-term bonds in-1.01Y5Y10Y20Y30Y1Y5Y10Y20Y30Ythe US but generally outperformedYears to Maturityshorter-term bonds in the non-USYears to Maturitydeveloped .09/30/201812/31/20181.00.0-1.0Yield (%)Changes in Yields (bps) since 9/30/2018Yield 0YYears to MaturityOne basis point equals 0.01%. Source: ICE BofAML government yield. ICE BofAML index data 2019 ICE Data Indices, LLC.30Y1Y5Y10Y20Y30YYears to Maturity16
Impact of DiversificationFourth Quarter 2018 Index ReturnsThese portfolios illustrate the performance of different globalRanked Returns (%)stock/bond mixes and highlight the benefits of diversification.Mixes with larger allocations to stocks are considered riskier0.56100% Treasury Billsbut have higher expected returns over time.25/75-2.8150/50-6.1475/25100% Stocks-9.42-12.65Growth of Wealth: The Relationship between Risk and Return 120,000 100,000Period Returns (%)Asset Class100% Treasury BillsStock/Bond Mix100% Stocks* Annualized10-Year1 Year 3 Years** 5 Years**10 Years** 510.98100% Stocks-8.937.184.8210.0514.65 80,00075/25 60,00050/50 40,00025/75100% Treasury Bills 20,000 1. STDEV (standard deviation) is a measure of the variation or dispersion of a set of data points. Standard deviations are often used to quantify the historical return volatility of a security or portfolio.Diversification does not eliminate the risk of market loss. Past performance is not a guarantee of future results. Indices are not available for direct investment. Index performance does not reflect expenses associated with themanagement of an actual portfolio. Asset allocations and the hypothetical index portfolio returns are for illustrative purposes only and do not represent actual performance. Global Stocks represented by MSCI All Country WorldIndex (gross div.) and Treasury Bills represented by US One-Month Treasury Bills. Globally diversified allocations rebalanced monthly, no withdrawals. Data MSCI 2019, all rights reserved. Treasury bills Stocks, Bonds,Bills, and Inflation Yearbook , Ibbotson Associates, Chicago (annually updated work by Roger G. Ibbotson and Rex A. Sinquefield).17
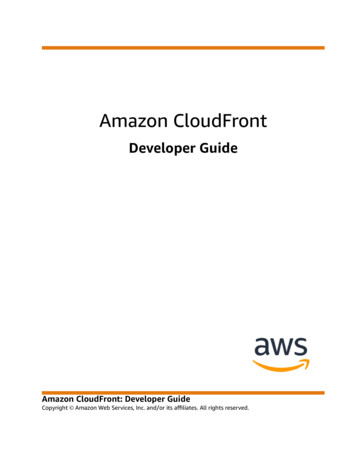
Why Should You Diversify?Fourth Quarter 2018As 2019 approaches, and with US stocks outperforming non-US stocks in recent years,some investors have again turned their attention towards the role that global diversification plays in their portfolios.For the five-year period ending October 31, 2018,the S&P 500 Index had an annualized return of11.34% while the MSCI World ex USA Indexreturned 1.86%, and the MSCI Emerging MarketsIndex returned 0.78%. As US stocks haveoutperformed international and emerging marketsstocks over the last several years, some investorsmight be reconsidering the benefits of investingoutside the US.THERE’S A WORLD OF OPPORTUNITY INEQUITIESThe global equity market is large and represents aworld of investment opportunities. As shown inExhibit 1, nearly half of the investmentopportunities in global equity markets lie outsidethe US. Non-US stocks, including developed andemerging markets, account for 48% of worldmarket capitalization¹ and represent thousands ofcompanies in countries all over the world. Aportfolio investing solely within the US would notbe exposed to the performance of those markets.Exhibit 1. World Equity Market CapitalizationWhile there are many reasons why a US-basedinvestor may prefer a degree of home bias in theirequity allocation, using return differences over arelatively short period as the sole input into thisdecision may result in missing opportunities thatthe global markets offer. While international andemerging markets stocks have delivereddisappointing returns relative to the US over thelast few years, it is important to remember that: Non-US stocks help provide valuablediversification benefits. Recent performance is not a reliable indicatorof future returns.As of December 31, 2017. Data provided by Bloomberg. Market cap data is free-float adjusted and meets minimum liquidity and listingrequirements. China market capitalization excludes A-shares, which are generally only available to mainland China investors. For educationalpurposes; should not be used as investment advice.1. The total market value of a company’s outstanding shares, computed as price times shares outstanding.18
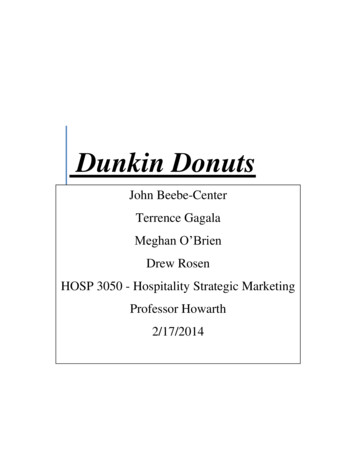
Why Should You Diversify?(continued from page 18)THE LOST DECADEPICK A COUNTRY?We can examine the potential opportunity cost associated with failing todiversify globally by reflecting on the period in global markets from 2000–2009.During this period, often called the “lost decade” by US investors, the S&P 500Index recorded its worst ever 10-year performance with a total cumulativereturn of –9.1%. However, looking beyond US large cap equities, conditionswere more favorable for global equity investors as most equity asset classesoutside the US generated positive returns over the course of the decade. (SeeExhibit 2.) Expanding beyond this period and looking at performance for eachof the 11 decades starting in 1900 and ending in 2010, the US marketoutperformed the world market in five decades and underperformed in theother six.² This further reinforces why an investor pursuing the equity premiumshould consider a global allocation. By holding a globally diversified portfolio,investors are positioned to capture returns wherever they occur.Are there systematic ways to identify which countries will outperform others inadvance? Exhibit 3 illustrates the randomness in country equity marketrankings (from highest to lowest) for 22 different developed market countriesover the past 20 years. This graphic conveys how difficult it would be toexecute a strategy that relies on picking the best country and the resultingimportance of diversification.Exhibit 2. Global Index Returns, January 2000–December 2009In addition, concentrating a portfolio in any one country can expose investorsto large variations in returns. The difference between the best- andworst-performing countries can be significant. For example, since 1998, theaverage return of the best-performing developed market country wasapproximately 44%, while the average return of the worst-performing countrywas approximately –16%. Diversification means an investor’s portfolio isunlikely to be the best or worst performing relative to any individual country,but diversification also provides a means to achieve a more consistentoutcome and more importantly helps reduce and manage catastrophic lossesthat can be associated with investing in just a small number of stocks or asingle country.A DIVERSIFIED APPROACHOver long periods of time, investors may benefit from consistent exposure intheir portfolios to both US and non-US equities. While both asset classes offerthe potential to earn positive expected returns in the long run, they mayperform quite differently over short periods. While the performance of differentcountries and asset classes will vary over time, there is no reliable evidencethat this performance can be predicted in advance. An approach to equityinvesting that uses the global opportunity set available to investors canprovide diversification benefits as well as potentially higher expected returns.S&P data 2019 S&P Dow Jones Indices LLC, a division of S&P Global. All rights reserved. MSCIdata MSCI 2019, all rights reserved. Indices are not available for direct investment. Indexperformance does not reflect expenses associated with the management of an actual portfolio. Pastperformance is not a guarantee of future results.2. Source: Annual country index return data from the Dimson-Marsh-Staunton (DMS) Global Returns Data, provided by Morningstar, Inc.19
Why Should You Diversify?(continued from page 19)Exhibit 3. Equity Returns of Developed MarketsSource: MSCI country indices (net dividends) for each country listed. Does not include Israel, whichMSCI classified as an emerging market prior to May 2010. MSCI data MSCI 2019, all rights reserved.Past performance is no guarantee of future results. Indices are not available for direct
S&P Global ex US REIT Index (net div.) Dow Jones US Select REIT Index MSCI Emerging Markets Value Index (net div.) MSCI Emerging Markets Small Cap Index (net div.) MSCI Emerging Markets Index (net div.) MSCI All Country World ex USA Index (net div.) Russell 1000 Value Index MSCI World ex USA Value Index (net div.) MSCI World ex USA Index (net .