Transcription
Business Overview and Financial ModelingApril 2022
Forward Looking Statements and Non-GAAP MeasuresADT has made statements in this presentation that are “forward-looking statements” within the meaning of the Private Securities Litigation Reform Act of 1995 and are madein reliance on the safe harbor protections provided thereunder. These forward-looking statements relate to our operating and performance metrics and any implied or statedfuture performance of such metrics. Forward-looking statements can often be identified by the use of words like “will,” “plans,” “intends,” “anticipates,” and similar words andare based on currently available information and management’s current beliefs and assumptions. ADT cautions that these statements are subject to risks and uncertainties,many of which are outside of ADT’s control, and could cause future events or results to be materially different from those stated or implied in this presentation, includingamong others, risks and uncertainties relating to the performance of our operating segments, the performance of our newly acquired Sunpro Solar operations, theperformance of our recently announced joint venture with Ford, our operating results under a company-owned or customer-owned ownership model, our leverage ratio, andrisk factors that are described in the Company’s Annual Report on Form 10-K and Quarterly Reports on Form 10-Q, including the sections entitled “Risk Factors” and“Management’s Discussion and Analysis of Financial Condition and Results of Operations” contained therein. Any forward-looking statement made in this presentationspeaks only as of the date on which it is made. ADT undertakes no obligation to publicly update or revise any forward-looking statement, whether as a result of newinformation, future developments or otherwise.Non-GAAP MeasuresTo provide investors with additional information in connection with our results as determined in accordance with generally accepted accounting principles in the UnitedStates (“GAAP”), we disclose certain non-GAAP measures including, for example, Adjusted EBITDA, Adjusted EBITDA margin, Free Cash Flow, Adjusted Free Cash Flow, andNet Leverage Ratio excluding Receivables Facility. Reconciliations from GAAP to non-GAAP financial measures for reported results can be found in the appendix.Amounts on subsequent pages may not sum due to rounding.Note: Operating metrics such as Gross Customer Revenue Attrition or Customer Retention, Subscriber Counts, RMR, Gross RMR Additions, Interactive Take Rate, CoreCustomer Value, Customer Lifetime Value, and Revenue Payback are approximated as there may be variations to reported results in each period due to certain adjustmentswe might make in connection with the integration over several periods of acquired companies that calculated these metrics differently, or otherwise, including periodicreassessments and refinements in the ordinary course of business. These refinements, for example, may include changes due to systems conversion or historicalmethodology differences in legacy systems.2
Agenda1.Company Overview2.Segment Overviews Consumer and Small Business (CSB) Commercial Solar3.Key Business Metrics Subscriber Acquisition Costs (SAC) Recurring Monthly Revenue (RMR) Attrition4.Modeling and Financial Statements Income Statement Segment Modeling Overviews Cash Flow Statement Adjusted Free Cash Flow5.Other Items Capital Structure Overview Depreciation and Amortization Interest Tax Considerations6.Appendix Glossary of Terms Select Financial Information GAAP to Non-GAAP Reconciliations3
Purpose of ADT Business Overview and Financial Modeling1 Provide overview for analysts and investors interested in learning more about ADT2 Address frequently asked analyst and investor questions3 Summarize key segments and review key business metricsMore information on ADT’s business strategy and long-term outlook can be found in our 2022 Investor Daymaterials in the Investor Relations website at investor.adt.com4
1. Company Overview
Company OverviewSegment OverviewsKey Business MetricsModeling and FinancialStatementsOther ItemsAppendixExecutive Leadership TeamDiverse and experienced management team driving ADT’s next chapter of growth and innovation.Jim DeVriesPresident and CEOHarriet HartyEVP, Chief AdministrativeOfficerJeff LikosarCFO and President,Corporate DevelopmentKeith HolmesEVP, Chief RevenueOfficerKen PorporaEVP, FinanceDan BresinghamEVP, CommercialDeLu JacksonSVP, Chief MarketingOfficerDavid SmailEVP, Chief Legal Officerand SecretaryJamie HaenggiEVP, Chief OperatingOfficer, SolarMarc JonesEVP, SolarDon YoungEVP, Chief OperatingOfficer6
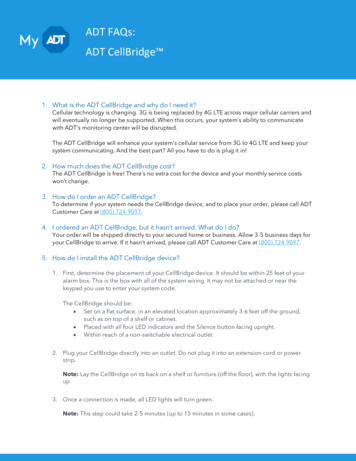
Company OverviewSegment OverviewsKey Business MetricsModeling and FinancialStatementsAppendixOther ItemsADT: Safe, Smart, and Sustainable Solutions for CustomersADT provides safe, smart, and sustainable solutions for people, homes and businesses. Through innovative products, partnerships, and the largestnetwork of smart home security professionals in the United States, we empower people to protect and connect what matters most.ADT was founded in 1874 as American District Telegraph (ADT). In 2016, The ADT Security Corporation was acquired by the private equity firm Apollo Global Managementand merged with Protection One. In 2018, ADT, Inc. became a public company and continued trading with the ADT ticker on the New York Stock Exchange (NYSE: ADT).2021 COMBINED REVENUE BY SEGMENTCONSUMER &SMALL BUSINESS (CSB)COMMERCIALSOLAR 4.1B 1.1B 645MTotal RevenueTotal RevenueTotal RevenueCOMPANY STATISTICS#1 80%Smart HomeSecurity ProviderRecurring Revenue inCSB and Commercial24/7/365 professionalmonitoring200 System eventsBillion captured annually25K Employees40K Total SolarInstallations6.6MSubscribers160 Fortune 1000Commercial CustomersNotes: Data presented as of 12/31/2021. Combined Revenue equals ADT Total Revenue (GAAP) (which includes Solar segment revenue post-acquisition) plus Sunpro revenue (GAAP) prior to theacquisition. Total solar installations represents cumulative installations to date.7
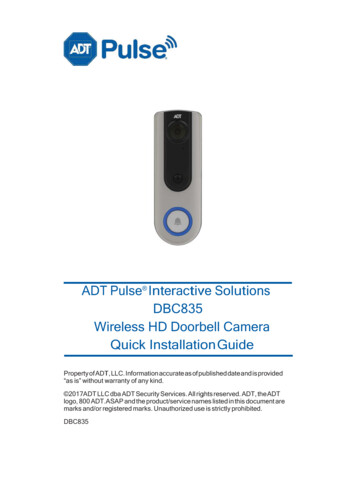
Company OverviewSegment OverviewsModeling and FinancialStatementsKey Business MetricsAppendixOther ItemsFinancial OverviewTotal RevenueAdjusted EBITDA in Millions in Millions 5,126 190 4,316 239 4,582 4,076 4,353 4,936201720182019 229U.S. 5,3152020 5,3072021 2,353 2,453 2,483 107 90 75 2,246 2,364 2,408201720182019CanadaU.S.2020 declinedriven byCanadadisposition &Defendersacquisition 2,199 2,21320202021CanadaAdjusted Free Cash Flow prior to subscriber acquisition in Millions 1,891 2,032 2,045 2,049 2,162 1,488 1,494 1,455 1,374 1,697 403 538 590 675 46520172018201920202021Adjusted Free Cash FlowSubscriber Acquisition CostNotes: All financial information presented above is as reported and does not include pro-forma information for Sunpro prior to the acquisition. Adjusted EBITDA results adversely impacted by November2019 divestiture of ADT Canada and January 2020 acquisition of Defenders. Prior to 6/30/20, Adjusted Free Cash Flow was reported as Free Cash Flow before special items.8
Company OverviewSegment OverviewsKey Business MetricsModeling and FinancialStatementsAppendixOther ItemsThree Segments with Different Financial ProfilesConsumer & Small BusinessCommercialSolar 15% 6% 13%ADT market leader,fragmented overallSeveral large players,fragmentedNo clear market leader,highly fragmentedSegment as % of TotalCombined Revenue70%19%11%Recurring Revenue 90% 30%0%Primarily ADT OwnedPrimarily Outright SaleOutright Sale 1,000 Non-refundable upfront fee 50 recurring monthly revenueVaries 37KInstallation MethodProfessional Install DIYProfessional InstallProfessional InstallConsumer FinancingYes 55% take rateN/AAvailable through third parties 90% take rateSame day / next dayWide variance2 - 3 months 8 years 10 yearsMultiple revenue opportunitiesover life of system 2.4 years 1.4 yearsImmediate at saleIndicative Adj. EBITDA Margins 50% 10% 10%Capital IntensityHigherLowerLowerMarket Growth (2020-2025 CAGR)Concentration(as a % of Segment Total Revenue)Equipment Ownership ModelIndicative Cash Revenue Per Sale(as a % of Eligible Transactions)Time Between Signing and InstallCustomer LifeRevenue Payback(as a % of Segment Total Revenue)Notes: All metrics as of 12/31/2021. Combined Revenue includes both ADT Solar Segment Total Revenue (GAAP) and Sunpro revenue prior to the acquisition. Approximate average Customer Life isbased on trailing twelve month attrition as of 12/31/2021.9
Company OverviewSegment OverviewsKey Business MetricsModeling and FinancialStatementsAppendixOther ItemsADT Generates Attractive Returns Across Each SegmentConsumer & SmallBusinessCommercialKey Unit Economics:SolarKey Unit Economics:Key Unit Economics: 50 recurring monthly revenue 120 average revenue per unit 17K annual solar installations 80% monitoring and servicemargin 1.4x revenue payback 20% battery attachment rate 91% customer retention 37K revenue per customer 2.4x revenue payback 87% customer retentionUpfront investmentgenerates predictablecustomer lifetime valueNote: CSB customer retention is for total company as of 12/31/21.Capital efficient customeracquisition with significantinstallation revenues and stickycustomer baseUpfront revenues withmeaningful gross margin andcapital efficient customeracquisition10
Company OverviewSegment OverviewsModeling and FinancialStatementsKey Business MetricsOther ItemsAppendixFinancial Profile Will Evolve As We GrowBusinessSegment/ProfileConsumer andSmall Business2021 70% of combinedImplications fromChanging Mixrevenue Higher EBITDA margin Capital required togenerate RMRCommercialand SolarFutureGrowingFaster overallgrowth 30% of combinedrevenue Lower EBITDA margin Less capital required togenerate RMRImproved cashgenerationGrowing fasterSlight decline inmarginsStrong ROICNote: Combined Revenue equals ADT Total Revenue (GAAP) (which includes Solar segment revenue post-acquisition) plus Sunpro revenue (GAAP) prior to the acquisition.11
2. Segment Overviews Consumer and Small Business (CSB) Commercial Solar
Company OverviewSegment OverviewsKey Business MetricsModeling and FinancialStatementsAppendixOther ItemsCONSUMER AND SMALL BUSINESSSegment OverviewSegment Statistics (LTM 12/31/21)Key Offerings and Characteristics Full-service smart home and small businesssecurity company with national footprintConsumer and Small Business Professionally installed, do-it-yourself,mobile, and digital-based offerings 24/7 professional monitoring services Industry’s largest sales, installation, andservice field force Distribution through our direct channels andover 200 Authorized ADT Dealers Strong partnerships (i.e. insurance, buildingand construction, Google, etc.)Unmatched Professional Home Automation and Security PlatformConsultativeSaleProfessionalInstallor DIY24/7 Technology & Service -onSalesSubscriber CountM&S Revenue6.4M 3,873MInstallation and other revenue 273MEnd of Period RMR(includes wholesale) 328MGross RMR Additions 55MRevenue Payback (in years) 2.4xNote: Operating metrics presented exclude wholesale customers who outsource their monitoring to ADT unless otherwise noted.13
Company OverviewSegment OverviewsKey Business MetricsModeling and FinancialStatementsOther ItemsAppendixCONSUMER AND SMALL BUSINESSWe have a broad range of offerings to serve customers throughout their lifeMobile SecurityFor peopleon-the-goPoint Solutions andDo-It-YourselfRenters, apartment living,tech comfortableProfessionally-InstalledSystemsSmart AgingConcierge smart homeSecuritySolutions for aging seniorsProfessionally-Installed Systems are Core to ADT’s CSB Offering14
Company OverviewSegment OverviewsKey Business MetricsModeling and FinancialStatementsAppendixOther ItemsCONSUMER AND SMALL BUSINESSSegment Financials and Key MetricsRevenueGross RMR Additions in Millions in Millions 4,32586%86% 565 4,146 273 3,891 3,761 3,873 46 48 202021 4,080 189Monitoring & ServiceAdjusted EBITDA 2,3742019 2,154202082%Installation & OtherInteractive Subscriber Profile2020 declinedriven byCanadadisposition &Defendersacquisition in MillionsInteractivetake rateUnits in Millions 2,1112021Total base of Residential and Small Business customersInteractive customers as a % of Residential and Small Business customersNotes: Operating metrics presented exclude wholesale customers who outsource their monitoring to ADT. Gross RMR additions represents U.S. only. Interactive Subscriber Profile represents Residentialand Small Business only and excludes our Health, Cyber and Mobile businesses. Interactive services include Pulse, Control, and similar ADT platforms, and are inclusive of services ranging from remotearm and disarm to full home automation.15
Company OverviewSegment OverviewsModeling and FinancialStatementsKey Business MetricsOther ItemsAppendixCONSUMER AND SMALL BUSINESSBusiness ModelKey Metrics Subscriber growth Subscriber Acquisition Cost (SAC) EfficiencyProfitable Service of Customers Recurring Monthly Revenue (RMR)Customer Retention and Loyalty Retention / Attrition1Efficient New Customer Acquisition23Long-Term Value and Cash Generation16
Company OverviewSegment OverviewsModeling and FinancialStatementsKey Business MetricsAppendixOther ItemsCONSUMER AND SMALL BUSINESSIllustrative Single Subscriber ExampleARPUMonitoring &Service Margin 5080%RMR AttritionRevenue Payback13.0%(in years)2.5xYear 0Year 1Year 2Year 3Year 4Year 5Year 6Year 7Year 8CumulativeM&S Revenue- 600 600 600 600 600 600 600 415 4,615(-) Cost to Adj. EBITDA prior tosubscriber acquisition- 480 480 480 480 480 480 480 332 3,692(1,500)--------(1,500)( 1,500) 480 480 480 480 480 480 480 332 2,192(-) Net SACIncremental FCFCore Customer ValueCustomer Lifetime Value (CLV) 2,192 3,692Key Takeaways: High-IRR business, aided by strong recurring margins, despite upfront investment. Average customer life of 8 years is significantly longer than revenue payback period.CLV/ SAC2.5x Core Customer Value is equivalent to Customer Lifetime Value less the subscriberacquisition cost.Internal Rate of Return27% Year 0 not necessarily indicative of period beginning on January 1st (impacts CFtiming).17
Company OverviewSegment OverviewsModeling and FinancialStatementsKey Business MetricsOther ItemsAppendixCONSUMER AND SMALL BUSINESSOwnership ModelEquipment Ownership Accounting In our CSB segment, ADT has historically retained ownership of equipment for most installations. Mix will shift to more outright sales of equipment to customers as we refine our go-to-market approach.ADT-Owned Model ADT typically retains ownership of equipment installed atCustomer-Owned Model Customer purchases and takes ownership of equipment.–customer premises with the customer paying a non-installation cost, which is recovered through RMR.refundable upfront fee.–ADT subsidizes a significant portion of the cost which Equipment costs, installation labor costs, and commissions,net of the upfront fee paid, are capitalized and amortized;Recognized as net SAC. Any cost that cannot be tied to a sale and install isCustomer pays monthly payment to ADT, recognized asRMR.is recovered through RMR. ADT subsidizes a portion of the product and Cost of equipment, installation labor and mostcommissions are expensed at the time of install.–Only commissions tied to RMR generation arecapitalized and amortized.expensed immediately (i.e. marketing expense).Net installation cost to balance sheetNet installation cost to P&L18
Company OverviewSegment OverviewsKey Business MetricsModeling and FinancialStatementsAppendixOther ItemsCOMMERCIALSegment OverviewSegment Statistics (LTM 12/31/21)Key Offerings and Characteristics Full suite of services for businesscustomers including security, fire, lifesafety, and risk consulting Dedicated commercial / nationalaccount monitoring centers Proprietary customer service platformwith real-time activity reportingCommercialSubscriber Count 250KM&S Revenue 474MInstallation and other revenue 639MEnd of Period RMR 31MGross RMR Additions 6MRevenue Payback (in years) 1.4xGrowth OpportunitiesVertical MarketExpansionElectronic ArticleSurveillanceTuck in M&APhysical SecurityDisruption Key existing verticals include banking, healthcare, commercialreal-estate, and retail Expanding into Government, Energy, and Smart Cities Entered in 2021 as a result of strong relationships withretail customers Over 500 million market Strong track record of M&A Pipeline for future growth Strategic partnerships Disrupting 50 billion guard industry19
Company OverviewSegment OverviewsModeling and FinancialStatementsKey Business MetricsOther ItemsAppendixCOMMERCIALProducts and Services Integrated solutions reduce cost and minimize potential risks while protecting what matters most to your organization –your people, property, and assets.PreventativeMaintenanceHigh RiseServicesFire Detection& AlarmCarbon Monoxide andSmoke DetectionUL-listed Safes& Vaults Voice Evacuation &Mass Notification SystemsTesting &InspectionFireSprinklerSystems24/7MonitoringFire & SmokeDamperServicesCloud &IP-basedSystemsRemote VideoMonitoringStructured CablingIntrusion AlarmVideo SurveillancePersonnel and AssetLocationAccess ControlDesign Engineering20
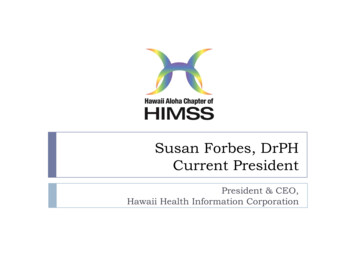
Company OverviewSegment OverviewsKey Business MetricsModeling and FinancialStatementsAppendixOther ItemsCOMMERCIALSegment Financials and Key MetricsRevenueAdjusted EBITDA in Millions in Millions 1,045 1,114 990 629 109 96 639 563 45 417 42620192020Monitoring & Service 4742021201920202021Installation & OtherSales BacklogRMR Growth in Millions in Millions 2.1 1.911% 315 3110%9% 1.1 28 27 240 22220192020Install Backlog2021RMR Backlog20192020Ending RMR2021Attrition21
Company OverviewSegment OverviewsKey Business MetricsModeling and FinancialStatementsAppendixOther ItemsSOLARSegment OverviewSegment Statistics (LTM 12/31/21)Key Offerings Design, sale, installation and service ofresidential solar and energy efficientsolutions Financing available through third parties Bundling opportunities with home security Currently available in 23 statesSolarSolar Installations 17KCombined Revenue 645MRevenue per installation 37KFinancing Fees 158MBattery Attachment Rate 20%Fully vertically integrated modelSales &MarketingDesign,Permitting, &FinancingInstallation Specialized in-house sales & marketing team Proprietary Sunlighten software with design, pricing, andfinancing capabilities In-house design & engineering team Streamlined process to obtain permits and utility inspection Financing options from multiple parties In-house installation for superior quality control andcustomer experience 135 design & installation teams Best-in-class equipment provider partnerships Workmanship & equipment warrantiesOngoing Support Long-term homeowner relationships for future revenue& MonitoringopportunitiesNotes: Combined Solar Revenue equals ADT Solar segment revenue (GAAP) plus Sunpro revenue (GAAP) prior to the acquisition. Combined revenue and revenue per installation arepresented net of financing fees.22
Company OverviewSegment OverviewsKey Business MetricsModeling and FinancialStatementsOther ItemsAppendixSOLARProducts and ServicesSales Support Sales Internally Generated LeadsMobile Technology Sales Incentives CRM Solar SystemsRoof ReplacementsProject OperationsBureau Operations Booking SupportDocumentation SupportPermitting HOAsNet Metering Agreements Field Operations Custom & Comprehensive Design/Engineering Site Surveys Permits RunningTech/Energization VisitsProposals Construction Supply Chain DistributionSystem/Roofing installations Electrical Work System DesignPermitting PackagesCustomer Service TroubleshootingCustomer Satisfaction Assurance23
Company OverviewSegment OverviewsKey Business MetricsModeling and FinancialStatementsAppendixOther ItemsSOLARSegment Financials and Key Metrics ADT acquired Sunpro in December 2021.2021 Combined Revenue and Adjusted EBITDA includes both ADT Solar Segment Total Revenue (GAAP) and Adjusted EBITDA (results postacquisition) plus Sunpro revenue and Adjusted EBITDA prior to the acquisition.Adjusted EBITDARevenue in Millions in Millions 645 25 3152020 1220212020Combined2021CombinedInstallationsUnits in Thousands17.49.22020202124
3. Key Business Metrics Subscriber Acquisition Costs (SAC) Recurring Monthly Revenue (RMR) Attrition
Company OverviewSegment OverviewsKey Business MetricsModeling and FinancialStatementsAppendixOther ItemsCash Subscriber Acquisition Costs Net Subscriber Acquisition Costs (SAC) represent all installation revenue and installation costs in our CSB and Commercial segments.Net SAC is the subscriber acquisition cost, net of any upfront payments made by the customer or received via financing through a third party.A portion of SAC is expensed immediately and the remainder is capitalized on the balance sheet and amortized over time under an ADT-owned model.Much of this cost is recaptured through the margin on recurring monthly revenue.Revenue payback measures years required to recover SAC via new recurring revenue generated.Net SAC CalculationSimplified View: SAC EfficiencyFY 20212021Cost ComponentsSelling, Advertising, & CommissionsCapitalizedNoncapitalizedTotal 324M 565M 889M 602M 602MInstallation CostCapitalized Direct SAC 695M 695MCapitalized Dealer SAC 671M 671MInstallation RevenueNet Subscriber Acquisition Cost Disclosed in quarterly earnings materials( 277M)( 884M)( 1,161M) 1,413M 284M 1,697MNet SAC( ) Gross RMR AdditionsRevenue Payback - months( ) MonthsRevenue Payback - years 1,697M 61M27.8x122.3xCash Flow Sensitivity: Revenue PaybackRevenue Payback Improvement0.1xx Illustrative Recurring Revenue Additions(New RMR 50M x 12 months) 600MCash Flow Impact 60MNotes: Net Subscriber Acquisition Costs (SAC) represent the estimated cash costs associated with the acquisition and installation of new and existing customers, net of inflows received. 324 million ofCapitalized SAC represents commissions only. 671 million of Capitalized Dealer SAC adjusted to include 4 million benefit from a holdback adjustment related to the Defenders acquisition.26
Company OverviewSegment OverviewsKey Business MetricsModeling and FinancialStatementsOther ItemsAppendixBalanced Approach to Capital AllocationCategoryCapital toAllocateAdjusted FCF prior to subscriber acquisitionAttritionReplacementSAC spend to maintain RMR base1 point attrition 100MOrganicGrowthSAC investment to grow RMR baseHigher level in 2021; planning less in 2022InorganicGrowthOpportunistic M&A and/oradjacency expansionReturn toShareholders 0.14/share annual dividend 130M/yearNo plans to changeDebtRepaymentCurrent net debt balance 9.7BGoal of 1B net debt reduction by 2025Allocation Waterfall2021: 2B 27Notes: 2025 goals do not represent actual guidance or projections; Net debt excludes the receivables facility.
Company OverviewSegment OverviewsModeling and FinancialStatementsKey Business MetricsRecurring Monthly RevenueAppendixOther ItemsExample Calculation Recurring monthly revenue (RMR) is the ongoingrevenue generated from providing monthly monitoringand other services to our customers.Year 1Year 2 295 305 50 55RMR Adds YOY( 55 - 50) / 50 10%( 40)( 40)Attrition 40/ 300 13%Ending RMR Balance 305 320Average RMR Balance 300 312.5( in Millions)Beginning RMR BalanceAdditions 80% of ADT’s CSB and Commercial revenue comesfrom recurring monthly revenue.CancelsGross RMR Additions – Historical Trend in Millions 16.0 12.1 12.9Q1’19YoY % Change: 12.8 14.5 11.4 13.2 14.5 15.5Q1’20Q1’21Q2’19 Q2’20 Q2’21Q3’19 Q3’20 Q3’217%25%(11%)10%28%7% 12.1Q4’19 13.9 14.9Q4’20 Q4’2115%7%28Notes: Gross RMR additions excludes historical international business. Excludes the impact of price escalations and wholesale customers.
Company OverviewSegment OverviewsKey Business MetricsModeling and FinancialStatementsAppendixOther ItemsAttrition Gross Customer Revenue Attrition is the percentage oftotal recurring revenue lost as a result of customerscancelling their ADT services.— Drivers of cancellations include customerrelocation, loss to competition, and customernon-payment.Improvement since IPO driven largely by higher qualitycustomer selection, more interactive systems (includingvideo), and enhanced customer service.Attrition Sensitivity: Cash Flow2021 end of period RMR 359Mx Attrition Improvement (example)100 bpsRMR Retainedx Revenue Payback 3.6M2.3 years / 27.8 monthsCash Flow Impact (per year) 100MTrailing Twelve Month Attrition – Historical 0.2%2016Net Attrition20172018201920202021Gross AttritionNotes: Net attrition excludes resales, service contract transfers, and relocating customers. 2015 net attrition equals the net customer revenue attrition rate of 12.2% as disclosed in Form 10-K forThe ADT Corporation for the fiscal year ended 9/25/15.29
4. Modeling and Financial Statements Income StatementSegment Modeling OverviewsCash Flow StatementAdjusted Free Cash Flow
Company OverviewSegment OverviewsModeling and FinancialStatementsKey Business MetricsAppendixOther ItemsIncome StatementADT Q4’21 Press ReleaseMonthly subscription type fees formonitoring and other services for CSBand Commercial; currently not applicableto SolarADT INC. AND SUBSIDIARIESCONSOLIDATED STATEMENTS OF OPERATIONS(in millions, except per share data)(Unaudited)Three Months Ended December 31,2021Monitoring and related services Installation and otherUpfront equipment and installationrevenue; amortization of deferredsubscriber acquisition revenue (CSB andCommercial only); revenue is net offinancing fees (Solar only)Total revenueYears Ended December 31,20201,103 20211,054 20204,348 4,1872782619591,1281,3811,3155,3075,315Cost of revenue (exclusive of depreciation and amortization shownseparately below)Selling, general, and administrative on and intangible asset amortization4914741,9151,914Merger, restructuring, integration, and other19538120Includes cost of monitoring (CSB andCommercial only), service, equipmentcosts, and installation labor costsGoodwill impairment————Loss on sale of udes selling, general, andadministrative expenses, and amortizationof commissionsLoss on extinguishment of debt(5)(37)(120)Depreciation of subscriber system assetsand other fixed assets and amortization ofdealer (CSB only) and other intangibleassetsOperating income (loss)Interest expense, net—Other income (expense)3Income (loss) before income taxesIncome tax benefitNet income (loss) 288(96)(125)(471)(779)3813130147(58) (112) (341) Subscriber Acquisition Costs: P&L portion included within Cost of Revenue and SG&A; Remainder isincluded on Balance Sheet and Amortized on P&L in future periods under ADT-owned transactions(632)31
Company OverviewSegment OverviewsModeling and FinancialStatementsKey Business MetricsOther ItemsAppendixSimplified Modeling: CSBFY 20212020 - End of period RMR 315M2021 - End of period RMR 328MAverage RMR 321.5M(x) 12 Months12Subtotal: 3,858M( ) Other, net 15MAnnual M&S Revenue 3,873MAnnual Total Revenue 4,146M(x) Adjusted EBITDA Margin51%Annual Adjusted EBITDA 2,111M(as a % of Total CSB Revenue) Average RMR is the best starting point to forecast total revenues, as 90% of CSB revenue is generated from RMR.—Additional detail on RMR calculation is included in the “KeyBusiness Metrics” section of this deck. Adjusted EBITDA margin will be impacted over time by ourinitiatives to increase revenue, lower service costs, equipmentownership mix, and improvement in subscriber acquisition efficiency. This simplified modeling view provides a general approach toestimating ADT’s financial performance. ADT’s actual GAAP resultsmay differ. Disclosed in quarterly earnings materials32Note: Other items includes service and other revenue, net of non-cash revenue recognition and other adjustments.
Company OverviewSegment OverviewsModeling and FinancialStatementsKey Business MetricsOther ItemsAppendixSimplified Modeling: CommercialFY 20212020 - End of period RMR 28M2021 - End of period RMR 31MAverage RMR 29.5M(x) 12 Months12Subtotal: 354M( ) Time and material jobs and other, net 120MAnnual M&S Revenue 474MAnnual Total Revenue 1,114M(x) Adjusted EBITDA Margin9%Annual Adjusted EBITDA 96M(as a % of Total Commercial Revenue) Commercial revenue includes an RMR component with moresignificant non-recurring service revenue than CSB, albeit at lowermargins. Commercial operates with high-single to low-double digitAdjusted EBITDA margins with minimal cash outlay. This simplified modeling view provides a general approach toestimating ADT’s financial performance. ADT’s actual GAAP resultsmay differ. Disclosed in quarterly earnings materials33Note: Other items includes service and other revenue, net of non-cash revenue recognition and other adjustments.
Company OverviewSegment OverviewsKey Business MetricsModeling and FinancialStatementsOther ItemsAppendixSimplified Modeling: SolarFY 2021Gross Revenue / Install 47K(x) Annual Solar Installs17KAnnual Gross Revenue 803M(-) Financing Fees (15-20%)( 158M)Annual Combined Revenue (GAAP)(x) Adjusted EBITDA Margin(as a % of Total Solar Revenue)Annual Combined Adjusted EBITDA 645M Solar Revenue is calculated by multiplying the number of solar salesand the average solar system sales price. Financing fees are paid to third party financing partners to buydown interest rate for consumers; 90% of customers take someform of financing.— Financing fees are a percentage of gross revenue. Combined Revenue includes what is reported as GAAP revenue forour solar segment.— Reported revenue is net of financing fees. This simplified modeling view provide
ADT was founded in 1874 as American District Telegraph (ADT). In 2016, The ADT Security Corporation was acquired by the private equity firm Apollo Global Management and merged with Protection One. In 2018, ADT, Inc. became a public company and continued trading with the ADT ticker on the New York Stock Exchange (NYSE: ADT). 25K Employees