Transcription
PixFRET, an ImageJ plug-in for FRET calculation which canaccommodate variations in spectral bleed-throughsJérôme N. Feige1, Daniel Sage2, Walter Wahli1, Béatrice Desvergne1,and Laurent Gelman1*1 - Center for Integrative Genomics, NCCR frontiers in Genetics, University of Lausanne,Switzerland.2 - Biomedical Imaging Group, Swiss Federal Institute of Technology Lausanne (EPFL),Lausanne, Switzerland.* Corresponding author: Center for Integrative Genomics, Université de Lausanne, BEP,CH-1015 Lausanne, e-mail: laurent.gelman@unil.ch, tel.: 41 (0)21 692 41 43, fax: 41(0)21 692 41 15.Keywords: fluorescence resonance energy transfer / sensitized emission / spectral bleedthrough / live cell microscopy / ImageJ
AbstractFluorescence Resonance Energy Transfer (FRET) allows to investigate interactions betweenfluorescent partners. One crucial issue when calculating sensitized emission FRET is thecorrection for spectral bleed-throughs (SBT), which requires to calculate the ratios betweenthe intensities in the FRET and in the donor or acceptor settings, when only the donor oracceptor are present. Theoretically, SBT ratios should be constant. However, experimentally,these ratios can vary as a function of fluorophore intensity, and assuming constant values mayhinder precise FRET calculation. One possible cause for such a variation is the use of amicroscope set-up with different photomultipliers (PMTs) for the donor and FRET channels, aset-up allowing higher speed acquisitions on very dynamic fluorescent molecules in livingcells. Herein, we show that the bias introduced by the differential response of the two PMTscan be circumvented by a simple modeling of the SBT ratios as a function of fluorophoreintensity. Another important issue when performing FRET is the localization of FRET withinthe cell or a population of cells. We hence developed a freely available ImageJ plug-in, calledPixFRET, that allows a simple and rapid determination of SBT parameters and the display ofnormalized FRET images. The usefulness of this modeling and of the plug-in are exemplifiedby the study of FRET in a system where two interacting nuclear receptors labeled with ECFPand EYFP are co-expressed in living cells.2
IntroductionFluorescence Resonance Energy Transfer (FRET) is a technique used to investigateinteractions between fluorescent partners as it allows to go beyond the resolution of lightmicroscopy by providing valuable information on distances between tagged molecules.Indeed, since the energy transfer efficiency is inversely proportional to the power 6 of thedistance between the donor and the acceptor, interactions are generally detected if the distancebetween fluorophores does not exceed 5 to 10 nm, a proximity only allowed by a directinteraction of the two partners (Sekar and Periasamy, 2003). With the introduction of autofluorescent proteins which can be coupled to a protein of interest to produce a fluorescentchimera (Wouters and others, 2001), FRET has gained great interest for cell biologists as itallows to directly study protein-protein interactions in the physiological context of a livingcell.A plethora of methods exist to evaluate FRET, depending on the protocol used (sensitizedemission, acceptor photobleaching, fluorescence lifetime) and the precision that is pursued(see (Berney and Danuser, 2003; Jares-Erijman and Jovin, 2003) for reviews). Two importantparameters in sensitized emission FRET calculation are (i) the evaluation of spectral bleedthroughs (SBTs), i.e. the amount of light detected in the FRET channel which is not due toenergy transfer and (ii) the normalization for differences in donor and acceptor expressionlevels (Gordon and others, 1998; Xia and Liu, 2001). The main causes of SBT are theemission of the donor in the acceptor channel and the excitation of the acceptor using thedonor excitation wavelength. As a first approximation, a constant value is often assigned tothe donor and acceptor SBT ratios, which then correspond to the average ratios between theintensities in the FRET and in the donor or acceptor channels, when only the donor oracceptor are present. However, we and others have observed that SBT ratios can vary3
importantly with fluorophore intensity (Chen and others, 2005; Elangovan and others, 2003).To circumvent the problem of generating inaccurate FRET data by using constant SBT ratios,Elangovan et al. have developed an elegant algorithm termed pFRET (Elangovan and others,2003) that defines classes of fluorophore intensities to which specific SBT values areattributed. We analyzed here the causes of SBT ratio variations on two different confocalmicroscopes and demonstrate that these are due to the use of several PMTs for the detectionin the donor and the FRET channels. We thereafter show that a simple modeling which can beeasily applied by biologists to estimate these SBT ratios as a function of intensity greatlyimproves the accuracy of FRET calculation.Another important interest for biologists when analyzing FRET in living cells concerns thelocation of the interaction studied within the cell or the cell population. We report here thedevelopment of an ImageJ plug-in, called "PixFRET", which allows to calculate and displayFRET directly on images by performing a pixel-by-pixel analysis of images and assisting inthe determination of SBTs.The usefulness of the modeling of SBT ratios and of the pixFRET plug-in is exemplifiedusing the Enhanced Cyan and Yellow Fluorescent Proteins (ECFP and EYFP), the FRET pairwhich is today the most widely used by biologists to study interactions of proteins in livingcells, fused to each partner of a well established heterodimer: the Peroxisome ProliferatorActivated Receptor (PPAR) and the Retinoid X Receptor (RXR) (Feige and others, 2005).4
Material and MethodsPlasmid constructs and reagents - cDNAs encoding mouse PPARα as well as RXRα weresubcloned after PCR amplification into the pEYFP-N1 and pECFP-N1 plasmids (BDBiosciences Clontech) as described previously (Feige and others, 2005). The ECFP-DEVDEYFP construct and GI262570-FITC were kind gifts of Dr J. M. Tavaré (Rehm and others,2002) and Dr Peterson (DeGrazia and others, 2003), respectively.Cell culture and transient transfection assays - Cos-7 cells were maintained in Dulbecco'smodified Eagle's medium supplemented with 10% fetal calf serum (Gibco). Penicillin andStreptomycin (Gibco) were added to the media at 100 units/ml and 100 µg/ml, respectively.Transient transfection assays were performed using Lipofectamine 2000 (Invitrogen). Cellswere plated in 4-well LabTek chambered coverglasses (Nunc) for microscopy studies.Confocal imaging - Live cells grown on LabTek chambered coverglasses were washedonce with phenol red free Optimem medium (Gibco) and observed in the same medium.Observations were performed at 37 C on a TCS SP2 AOBS confocal microscope (Leica,Germany) equipped with 4 photomultipliers and with a whole-microscope incubator (LifeImaging Service, Switzerland). Additional experiments were performed on a LSM510 Metaconfocal microscope using the Meta array of photomultipliers (Zeiss, Germany), and on anOlympus IX70 wide-field microscope equipped with a Polychrome II monochromator(Photonics, USA) set at 420nm, a Zeiss 488027 filter set (Ex BP 410/16 489/22 – EmBP 456/17 535/44) or an Olympus YFP filter set (BP535/30) and an Imago CCD camera(Photonics, USA). Acquisitions were performed with a 63X/NA 1.2 water or a 63X/NA 1.4oil immersion objective. Quantification of images was performed using either the LeicaConfocal Software (LCS) version 2.4 or ImageJ version 1.33.5
For FRET experiments, transfections were performed as described above and expressionlevels of donor and acceptor proteins were adjusted to similar levels by western blot. Unlessotherwise stated, the three different settings used for the analysis of FRET with the CFP/YFPpair were i) FRET: Ex 405nm / Em 525-545nm, ii) CFP: Ex 405nm / Em 465-485nm, iii)YFP: Ex 514nm / Em 525-545nm. Laser power and detector gain were adjusted in thedifferent channels in order to observe equimolar concentrations of CFP and YFP at equalintensities (equimolar concentrations of CFP and YFP were obtained by expressing areference fusion protein of CFP and YFP spaced by 475 residues). The analysis of FRET withthe FITC/Cy3 pair was performed with the following settings: FRET: Ex 488nm / Em 565585nm, ii) FITC: Ex 488nm / Em 510-530nm, iii) Cy3: Ex 514nm / Em 565-585nm. Settingswere kept unchanged for analysis of all samples. Unless otherwise stated, donor emission wasdetected on the photomultiplier (PMT) #1 and acceptor and FRET emissions were recordedPMT #2. Donor and acceptor SBTs in the FRET setting were determined on cells expressingthe donor or the acceptor alone by calculating the intensity (I) ratios in the appropriate settings(IFRET/IDonor and IFRET/IAcceptor, respectively). Linear and exponential fits were performed usingMicrosoft Excel and FindGraph, respectively. FRET measured in co-expressing cells was thencorrected for SBTs and normalized (NFRET) for expression levels according to the followingformula (Xia and Liu, 2001):NFRET IFRET IDonor BTDonor IAcceptor BTAcceptorIDonor IAcceptorProgram for the plug-in - The program PixFRET presented in this paper is a plug-in of the public-domain software ImageJ. ImageJ is a general-purpose image-processing program; it isthe Java offspring of the NIH Image software. As a result, it can run on any platform with aJava Virtual Machine (Macintosh, Windows, Unix, etc ). The application and its source are6
tml.7
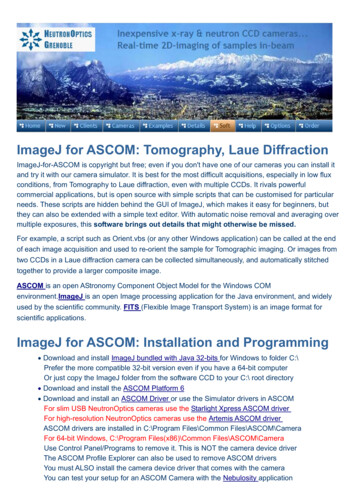
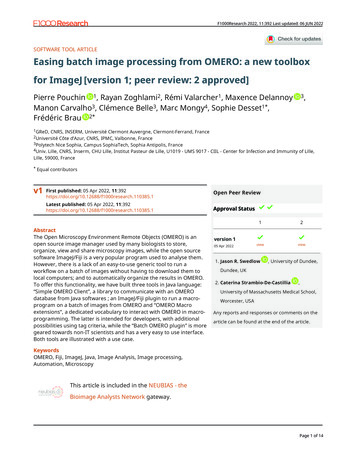
ResultsSBT ratios can vary as a function of fluorophore intensity.To study FRET in living cells, we chose two nuclear receptors previously shown to formheterodimers in vitro and in vivo, the peroxisome proliferator-activated receptor (PPAR) andthe retinoid X receptor (RXR) which were respectively fused to ECFP (donor) and EYFP(acceptor) (Feige and others, 2005).An important parameter in FRET experiments is the amount of SBT between channels. Toestimate SBTs, average fluorescence intensities in cells expressing only the donor (or theacceptor) were quantified, both in the FRET and in the donor (or acceptor) channels. Theratios between the fluorescence intensities in each channel were calculated after backgroundsubtraction. In cells expressing PPAR-CFP alone, the donor SBT ratio, defined as the ratiobetween the amount of light emitted by the donor in the FRET channel (FCFP) and in the donorchannel (CFPCFP), was not constant and increased with CFP intensity (Fig. 1A). In order tounderstand the causes of such an increase, we tested several possible factors. Photobleachingor photoconversion of the fluorophores was not involved as no modification of therelationship between the CFP SBT ratio and CFP intensity was observed after 60 scans of thespecimen or after scanning with full laser power (data not shown). We then tested whetherthis phenomenon was dependent on the type of fluorophore used by testing the SBT of FITC.Living cells were incubated with the PPAR ligand GI262570 coupled to FITC whichaccumulates in cellular membranes and in nuclei. Interestingly, when GI262570-FITC wasused as a FRET donor with Cy3, the donor SBT ratio also varied with FITC intensity(Fig. 1B).To determine if the fluctuations of SBTs were due to our instrumentation (Leica TCS SP2AOBS), we performed the same experiment with different microscopes. When PPAR-CFP8
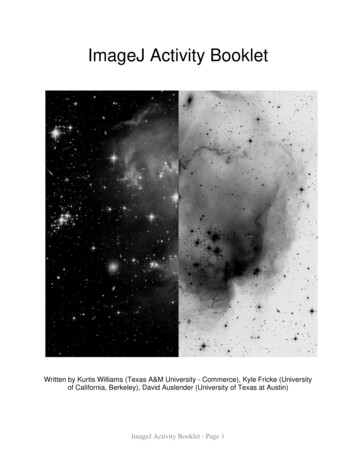
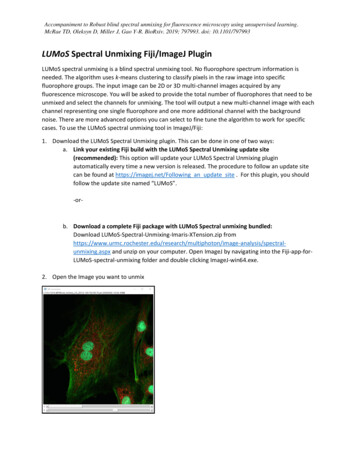
SBT was analyzed on a Zeiss LSM510 Meta confocal microscope using the Meta array ofPMTs, a very similar increase was observed when the SBT ratio was plotted as a function offluorophore intensity. However, this donor SBT ratio was constant on a wide-fieldmicroscope using a charge-coupled device (CCD) camera (data not shown). It thereforeappeared that the dependency of the SBT ratio on fluorophore intensity was restricted toconfocal microscopes. To further identify the possible causes leading to this variation, wetested the impact of laser power and PMT gain on SBT ratio variations. Variations of CFPSBT ratios were still observed when the laser was tuned from 15% to 75% of its maximumpower (data not shown). We then analyzed SBT ratios with 4 different settings where thegains of the PMTs used for the detection in the donor and FRET channels were set to differentvoltages. Laser power was adjusted to allow the analysis of the same batch of cells with eachsetting (Fig. 2A). Interestingly, whereas the CFP SBT ratio was independent of CFP intensityat low PMT gains (500V donor / 530V FRET), this ratio increased with CFP intensity athigher gains. Similar results were obtained when only the donor or the FRET gain werechanged, or when both gains were changed and laser power was kept constant (data notshown).These results suggested that problems in PMT linearity could account for the observeddependency of SBT ratios on fluorophore intensity. While it is more convenient to use twodifferent PMTs for the detection in the donor and FRET channels, we investigated whetherthe phenomenon could also be observed with one PMT only. When the same PMT for boththe donor and FRET channels was used, the SBT ratio was constant, irrespective of the gainapplied to the PMT (Fig. 2B). This result suggests that the variations observed with the twoPMT setup, or with the array of PMTs, reflect a differential response of the PMTs.Improving FRET calculation by modeling SBT ratios as a function of fluorophore intensity.9
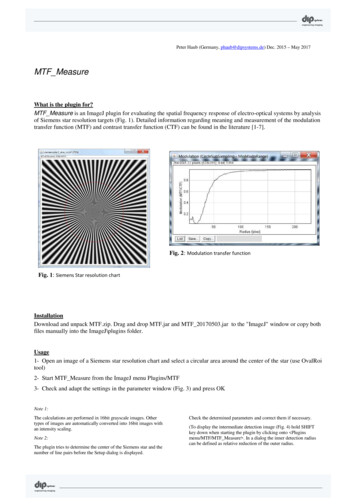
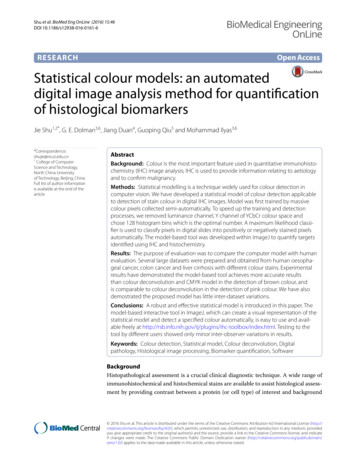
To circumvent the problem of SBT variation, using a unique PMT both for the detection ofthe donor and of the acceptor seems therefore to be the best solution. However, this imposesto acquire the three channels sequentially because of mechanical movement of the PMT, atime-consuming process which is not compatible with the FRET analysis of rapidly diffusingcomplexes.Elangovan et al have already reported the variation of SBT ratios as a function offluorophore intensity and proposed an elegant but only commercially available algorithm totackle this problem (Elangovan and others, 2003). Alternately, we propose an easilyapplicable method that consists in modeling SBT ratios as a function of fluorophore intensity.For the problem reported herein, the CFP SBT ratio can be fitted as a function of CFPintensity either with a linear or an exponential model (Fig. 3). These models are then used toestimate the SBT ratio corresponding to each donor intensity and can be implemented in theNFRET formula described by Xia and Liu (Xia and Liu, 2001) as follows:(1) NFRET FCFP YFP CFPCFP YFP a YFPCFP YFP b(Xia and Liu, 2001)CFPCFP YFP YFPCFP YFP (2) linNFRET FCFP YFP CFPCFP YFP (c CFP CFPCFP YFP d CFP ) YFPCFP YFP bCFPCFP YFP YFPCFP YFP(3) expNFRET FCFP YFP CFPCFP YFP (e CFP exp(CFPCFP YFP fCFP ) g CFP ) YFPCFP YFP b CFPCFP YFP YFPCFP YFPwhere F, CFP and YFP are the intensities measured with the FRET, CFP and YFP settings (correspond to F, D and A in the nomenclature proposed by Gordon et al. (Gordon and others,1998)), a and b are the average donor and acceptor SBT ratios, and c, d, e, f and g are theconstants determined by the fitting of the SBT ratio, according to figure 3.To validate this approach, the three FRET calculation methods have then been comparedon the same set of data (Fig. 4). Cells were transfected with expression vectors for ECFP andEYFP (negative control), ECFP fused to EYFP (positive control), or PPAR-ECFP and RXREYFP. The three formulas give similar results for both the positive and negative FRET10
controls as, under these experimental conditions, variations between cells are small and allfluorescence intensities are close to the average of the population used to calculate SBT ratios(Fig. 4A). The linNFRET values are slightly higher due to the underestimation of the ECFPSBT for both low and high ECFP intensities (see Fig. 3A). The most dramatic effect is seenwhen NFRET is calculated for the interaction between the two nuclear receptors. Indeed, themore accurate linNFRET and expNFRET calculations significantly reduce standard deviation,with a more pronounced effect for expNFRET. In order to better characterize the reduction ofthe variability of the measurements when modeling SBT ratios, we plotted the differencebetween expNFRET or linNFRET and NFRET as a function of fluorophore intensity (Fig.4B). In both cases, the highest variation was observed for extreme ECFP values for whichusing an average SBT ratio leads to a great under- or over-estimation of the correction factor(Fig. 4B and 4C). The results obtained with linNFRET and expNFRET are hence not onlymore precise, but also improve the statistical properties of the data, allowing to compare moreaccurately mild changes. We also tried to fit the donor SBT with a 2nd order polynomial modelrather than an exponential growth, but this model greatly overestimates SBT values whendonor intensities are very low or very high (data not shown).Pixel-by-pixel FRET analysis and visualizationCells are highly organized and protein distribution as well as interactions are often limitedto specific compartments. It is hence crucial for biologists to be able to map interactions withprecision within a cell or a population of cells to better understand the spatial organization ofcellular activities. We therefore developed an ImageJ plug-in called "PixFRET" that allows togenerate normalized FRET images, by computing pixel by pixel the images of a sampleacquired in a three channel setting. The plug-in allows either to enter manually SBTparameters for the donor and the acceptor, or to determine these values online using stacks of11
FRET and donor or acceptor images. PixFRET is freely available on our website(http://www.unil.ch/cig/page16989.html) together with a detailed user's guide.The PixFRET plug-in requires different stacks of images: i) for FRET analysis, a stack ofthree images taken in the FRET, Donor and Acceptor settings, ii) for Donor SBTdetermination, a stack of two images of cells expressing the Donor only and taken in theFRET and Donor settings, iii) for Acceptor SBT determination, a stack of two images of cellsexpressing the Acceptor only and taken in the FRET and Acceptor settings.When launching PixFRET, an interface appears where all parameters for FRET calculationand display can be set (Fig. 5). The "Donor SBT" or "Acceptor SBT" bookmarks allow toevaluate SBT parameters (Fig. 5A). The user is first invited to draw a region outside cells todetermine the background in each image of the stack. Then, one or several regions of intereston the cells have to be drawn to allow PixFRET to plot SBT ratios as a function offluorophore intensity. PixFRET then calculates the mean SBT, or the parameterscorresponding to the linear or exponential fit of the data. The user can drag a sliding windowon the plot to define on which set of points the calculation is to be performed and may thenrescale the graph to the selected area by clicking the "Zoom" button. It is also noteworthy thatall parameters, including background (BG) values, can be directly entered manually by theuser. Next, the stack with cells expressing both the donor and the acceptor should be openedand background should be determined in the FRET bookmark (Fig. 5B) by drawing a regionoutside cells. Backgrounds may also be modified manually to adjust the threshold abovewhich NFRET is calculated. Indeed, the software operates NFRET calculation only when(i) the local mean pixel value, which is calculated by averaging the values of the pixel ofinterest and that of its 8 surrounding neighbors, is above the mean background of the image inall three images, and (ii) when the product of the mean pixel values for donor and acceptor isabove the product of the backgrounds in the donor and acceptor images. These conditions12
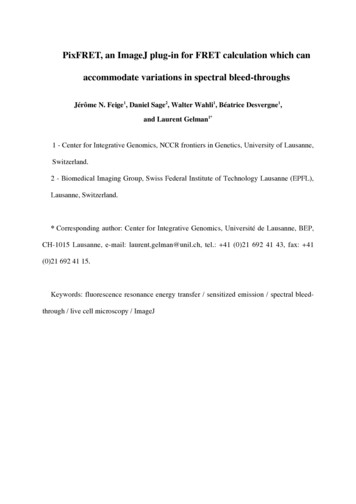
were introduced to discard points in the background that preclude the visualization of FRETwithin the cell by generating aberrantly high FRET values because of normalization. Allbackground values may also be changed by a common multiplication factor which can bespecified in the "Threshold Correction Factor" field. The program also offers the option tofilter the images with a Gaussian blur, the standard deviation of the blur allowing to tune thesmoothing effect. Blurring notably reduces the noise and improves the resulting image bypreventing aberrant FRET values in the background. Finally, the normalization method has tobe selected. Indeed, the FRET values for each pixel can be divided by the value in the samepixel of the donor intensity, the acceptor intensity, the product of donor and acceptorintensities or the square root of the product of donor and acceptor intensities. Clicking on the"Compute FRET" button will generate the normalized FRET images, but also will log allparameters to a text file which will be reloaded when the plug-in is re-launched.FRET and NFRET are calculated only if pixel values in each image are above a giventhreshold. Otherwise the value is set to zero in the computed image and the pixel is displayedin blue in order to better visualize all the FRET values of the image (Fig. 6B). Indeed, even ifwithin a cell the average FRET value is positive, some pixels may have negative values,especially when the FRET efficiency is low. Since the output image is displayed with a 256grayscale look-up table, the background, which corresponds to a value of zero, may appear ingrey (and not black as intuitively expected) if negative pixels are present in the image, therebyprecluding a good visual examination of the generated FRET image. The background pixelsare hence automatically colorized in blue using a look-up-table designed for this purpose.Test of the PixFRET plug-in.To validate the tools described above, we performed a pixel-by-pixel analysis of FRET bycomputing an image of two cells expressing different amounts of PPAR-ECFP and RXREYFP (Fig. 6) and compared the impact of using constant or fitted SBT ratios on FRET13
display. Since these cells express the same ECFP and EYFP fusion proteins, both of themshould exhibit similar normalized FRET values. When constant SBT ratios are used, FRETefficiency appears higher in cell #2 than cell #1 (Fig. 6B and 6C, left panels), whereas the useof the expNFRET formula generated an image where the two cells display similar intensities(Fig. 6B and 6C, right panels). This visual appreciation of the advantage of using expNFRETwas confirmed when the distributions of pixel intensities within each cell were plotted ashistograms and average FRET values calculated (Fig. 6D). When constant SBT ratios wereused, the average normalized FRET value in cell #1 was 4.9, versus 13.8 in cell #2, whereasthe use of expNFRET generated closer mean values (9.6 for cell #1 versus 7.4 for cell #2).Indeed, when using an average SBT ratio for normalized FRET calculation (see formula 1above), most donor SBT values are underestimated in cell #2, where CFP levels are high, andoverestimated in cell #1 where CFP levels are low. This is why. Overall and consistent withwhat was observed at the cell population level in Fig. 4, the use of the exponential fit allows abetter normalization of the data by reducing the variability of FRET signals generated fromdifferent ranges of fluorophore intensity.14
DiscussionFRET is a technique whose use is rapidly expanding among cell biologists as it providesvery valuable information about physical interactions between molecules within cells.Numerous procedures exist and have been used to determine FRET in living cells, each ofthem having advantages and drawbacks (Berney and Danuser, 2003) and we are still in aphase where the robustness of the methods has to be improved (van Rheenen and others,2004). One important issue that has received only limited attention so far is the variation ofSBT ratios as a function of fluorophore intensity when performing sensitized emission FRET.Using the most widely used fluorophore pair in cell biology, i.e. ECFP and EYFP, we showthat under some common technical circumstances, these ratios are not constant and can varywith fluorophore concentration. In cases where the variations of fluorophore concentrationsare small, assuming constant SBT ratios may be sufficient to get data of satisfactory accuracy.However, when these SBT ratios vary importantly and thereby clearly bias FRET calculation,and when only small variations in FRET efficiency are expected between cells or samples,solutions to tackle this problem are required.Variations in SBT ratios as a function of fluorophore intensity could be assigned here to adifferential response of the PMTs used for detection in the Donor and FRET channels.Whereas using a unique PMT both for the detection of the donor and of the acceptor couldcircumvent this problem, the required mechanical movement of the PMT (or of the filter cubewheel in other set-ups) implies that the images in the FRET, the donor and the acceptorchannels are acquired sequentially. While this approach is well applicable to fixed samples orto slowly diffusing or immobile proteins, it is more problematic for the study of interactionsof highly mobile proteins such as PPARs (Feige and others, 2005). Scanning each channelbetween lines, which can only be performed with 2 separate PMTs, therefore allows to limit15
the diffusion of the interacting complexes during the time of scanning. It is noteworthy that ona different microscope, using an array of PMTs, the same problem was encountered. Hence,our results are of general interest to scientists performing FRET on a confocal microscope.Interestingly, Chen and collaborators have also observed variations in SBT ratios whenperforming FRET with a 2-photon excitation setup (Chen and others, 2005), and consistentwith our study, they did not observe any variation of the SBT ratios on a wide-fieldmicroscope using CCD camera detection.In cases where SBT ratios vary as a function of fluorescence intensity, we showed thatFRET calculation can be improved by modeling these variations. This is particularlyimportant when fluorophore intensities vary greatly between cells. We demonstrated here thatthe expNFRET method reduces the variability of the FRET values calculated for thePPAR/RXR interaction. Whereas in our case, the exponential modeling generated the bestresults, other fits might be tested in situations where SBT ratios vary differently.Cells are highly organized and protein distribution as well as interactions are often limitedto specific compartments. It is hence of importance to be able to map FRET precisely withincells to better characterize the mode of action of interacting proteins. To achieve this goal, wedeveloped a plug-in called PixFRET for the ImageJ software that generates an image whereNFRET is calculated for each pixel. The plug-in allows to directly determine the SBTparameters from images acquired when only the donor or the acceptor are present. As variousnormalization methods have been proposed (Gordon and others, 1998; Xia and Liu, 2001),PixFRET allows the user to choose the type of normalization desired. To our knowledge, thisis the first freely available program that offers such possibilities and the source files will beavailable upon request, allowing users to program specific SBT ratio modeling methodsaccording to their needs.16
In conclusion, we uncovered the bias that the use of several PMTs may introduce whenperforming FRET experiments. We show that in cases where a set-up with two PMTs or anarray of PMTs is preferred or required, this bias can be circumvented by a simple modeling ofSBT ratios. We also developed a user-friendly and free interface, called PixFRET, that allowsa simple and rapid determination of SBT parameters and to display normalized FRET images.Altogether, these results and the PixFRET plug-in will help cell biologists to increase theprecision of FRET analyses conducted on confocal microscopes as well as the visualizationand localization of interactions in living cells.17
ReferencesBerney C, Danuser G. 2003. FRET or no FRET: a quantitative comparison. Biophys J84(6):3992-4010.Chen Y, Elangovan M, Periasamy A. 2005. Chapter 7- FRET Data Analysis: The Algorithm.In: Periasamy A, Day RN, editors. Molecular Imaging: FRET Microscopy andSpectroscopy: Oxford University Press. p In press.DeGrazia MJ, Thompson J, Heuvel JP, Peterson BR. 2003. Synthesis of a high-affinityfluorescent PPARgamma ligand for high-throughput fluorescence polarization assays.Bioorg Med Chem 11(20):4325-32.Elangovan M, Wallrabe H, Chen Y, Day RN, Barroso M, Periasamy A. 2003.Characterization of one- and two-photon excitation fluorescence resonance energytransfer microscopy. Methods 29(1):58-73.Feige JN, Gelman L, Tudor C, Engelborghs Y, Wahli W, Desvergne B. 2005. Fluorescenceimaging reveals the nuclear behavior of PPAR/RXR heterodimers in the absence andpresence of ligand. J Biol Chem 280(18):17880-90.Gordon GW, Berry G, Liang XH, Levine B, Herman B. 1998. Quantitative fluorescenceresonance energy transfer measurements using fluorescence microscopy. Biophys J74(5):2702-13.Jares-Erijman EA, Jovin TM. 2003. FRET imaging. Nat Biotechnol 21(11):1387-95.Rehm M, Dussmann H, Janicke RU, Tavare JM, Kogel D, Prehn JH. 2002. Single-cellfluorescence resonance energy transfer analysis demonstrates that caspase activationduring apoptosis is a rapid process. Role of caspase-3. J Biol Chem 277(27):24506-14.Sekar RB, Periasamy A. 2003. Fluorescence resonance energy transfer (FRET) microscopyimaging of live cell protein localizations. J Cell Biol 160(5):629-33.van Rheenen J, Langeslag M, Jalink K. 2004. Correcting confocal acquisition to optimizeimaging of fluorescence resonance energy transfer by sensitized emission. Biophys J86(4):2517-29.Wouters FS, Verveer PJ, Bastiaens PI. 2001. Imaging biochemistry insid
public-domain software ImageJ. ImageJ is a general-purpose image-processing program; it is the Java offspring of the NIH Image software. As a result, it can run on any platform with a Java Virtual Machine (Macintosh,