Transcription
Technion – Electrical Engineering DepartmentMay 2004Signal and Image Processing LaboratoryWritten By:Yair Moshe1GUI with Matlab - Outline1.2.3.4.Basic GraphicsAnimationHandle Graphics ObjectsCreating GUI using GUIDE21
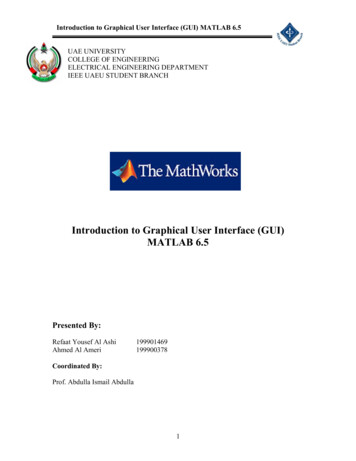
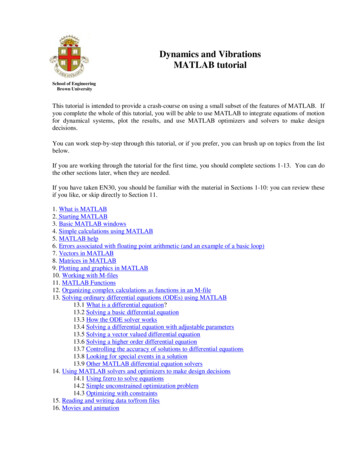
1. Basic Graphics 2-D PlottingThe Figure WindowData Statistics & Curve FittingSubplots & Scales for AxesSpecialized Plotting Routines3-D PlottingImages32-D Plottingx 0:.1:2*pi;x 0:.1:2*pi;y sin(x);y sin(x);plot(x,y)plot(x,y)gridgrid ononholdhold ononplot(x,plot(x, exp(-x),exp(-x), 'r:*r:*'))axis([0axis([0 2*pi2*pi 00 1])1])title(title('2-D2-D PlotPlot'))xlabel('Timexlabel( Time'))ylabel(ylabel('Sin(t)Sin(t) '))text(pi/3,text(pi/3, sin(pi/3),sin(pi/3), ' --sin(\pi/3) --sin(\pi/3) '))legend(legend('SineSine WaveWave',,'DecayingDecaying ExponentialExponential'))42
Line CharacteristicsSpecifierLine ColorSpecifierMarker Stylebblue.pointggreenocirclerredxx-markccyan ngle down triangle upSpecifierLine Style-solid triangle left:dotted triangle right-.dashdotppentagram--dashedhhexagram5The Figure WindowThe figure window contains useful actions in its menuand toolbars: Zooming in and out Rotating 3-D axes (and other camera actions) Copying & pasting Plot Edit Mode Property Editor Saving & Exporting– Figures can be saved in a binary .fig file format– Figure can be exported to many standard graphics file formats etc.,GIF, PNG, JPEG, TIFF, BMP, PCX, EPS. Printing63
Data Statistics & Curve Fitting The Data Statistics Tool:– Calculates basic statistics about the central tendency andvariability of data plotted in a graph– Plots any of the statistics in a graph The Basic Fitting Interface:– Fits data using a spline interpolant, a shape-preservinginterpolant, or a polynomial up to degree 10– Plots multiple fits simultaneously for a given data set– Examines the numerical results of a fit– Annotates the plot with the numerical fit results and the normof residuals7Subplots & Scales for Axessubplot(2,2,1)subplot(2,2,1)x 0:.1:2*pi;x 0:.1:2*pi;plot(x,plot(x, gy(x,semilogy(x, exp(-x))exp(-x))subplot(2,2,3)subplot(2,2,3)x 0:.1:2*pi;x 0:.1:2*pi;plot(x,plot(x, ks)plot(peaks)84
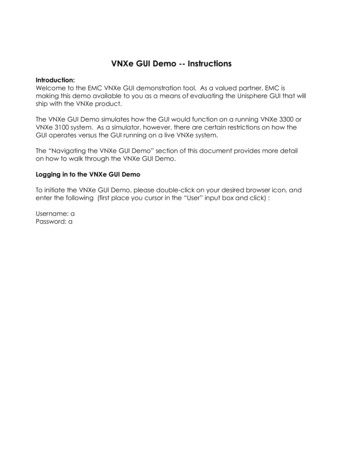
Specialized Plotting Routines93-D Plottingz 0:0.1:10*pi;x exp(-z/20).*cos(z);y exp(-z/20).*sin(z);plot3(x,y,z,'LineWidth',2)grid onxlabel('x')ylabel('y')zlabel('z')105
3-D Meshes and Surfaces113-D Meshes and Surfaces126
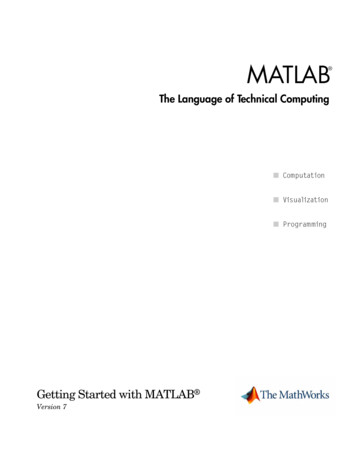
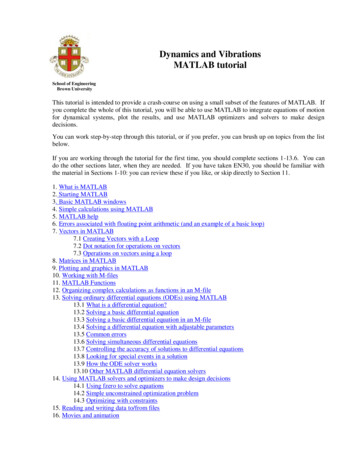
Images[x,map] sa magic(4);image(a);map hsv(16);colormap(map)colorbar147
2. Animation On the Fly Animation Frame by Frame Animation15AnimationMatlab provides two ways of generating moving,animated graphics:1. On the fly - Continually erase and then redraw theobjects on the screen, making incremental changeswith each redraw.2. Frame by frame capture and playback - Save anumber of different pictures and then play themback as a movie.168
On the Fly AnimationExample for on the fly animation:tt 0:0.01:10*pi;0:0.01:10*pi; xx t.*sin(t);t.*sin(t); yy t.*cos(t);t.*cos(t);axislimitsaxislimits [min(x)[min(x) max(x)max(x) min(y)min(y) max(y)max(y) min(t)min(t) max(t)];max(t)];line handleline handle plot3(x(1),plot3(x(1), y(1),t(1),y(1),t(1), 'ko', .'MarkerFaceColor',[.49'MarkerFaceColor',[.49 11 .63],.63], 'MarkerSize',12);'MarkerSize',12);set(line handle,set(line handle, its);axis(axislimits);gridgrid ononforfor ii 2:length(x)2:length(x)set(line handle,set(line handle, 'xdata',x(i), 'ydata', y(i), 'zdata', t(i));drawnow;drawnow;endend17Frame by Frame animationExample for frame by frame movie creation and playing:[x,y][x,y] or jj 1:151:15zz bessel(0,bessel(0, (j-1)*0.2(j-1)*0.2 sqrt(x. 2sqrt(x. 2 y. 2)); y. 2));surf(x,y,z)surf(x,y,z)axis([-10axis([-10 1010 -10-10 1010 -.5-.5 1])1])M(j)M(j) getframe;getframe;endendframe orderframe order [1:15[1:15 14:-1:1];14:-1:1];number repeatsnumber repeats 5;5;movie(M,movie(M, [number repeats[number repeats frame order]);frame order]);189
3. Handle Graphics Handle Graphics ObjectsGraphics Objects HierarchyObtaining an Object’s HandleModifying Object Properties19Handle Graphics Objects Handle Graphics is an object-oriented structure forcreating, manipulating and displaying graphics Graphics in Matlab consist of objects Every graphics objects has:– a unique identifier, called handle– a set of properties which define its appearance2010
Graphics Objects HierarchyObjects are organized into a tree-structure hierarchy:21Graphics Objects ontrolObjectsPatchObjectTextObjects2211
Obtaining an Object’s Handle Upon creation, for example:– h plot(x data, y data, ) Using utility functions:––––––0 - root object handle (the screen)gcf – returns the handle for current figuregca - returns the handle for current axesgco - returns the handle for current objectgcbf - returns the handle for callback figuregcbo - returns the handle for callback object23Modifying Object Properties Return a list of all object properties and their current values: Return a list of all user-settable object properties and their current values: Return current value of an object property:–––– get(handle, ‘PropertyName’)Example: get(gcf, 'Color')Set(handle,’PropertyName’)Example: set(gca, 'XDir')Set an object property to a new value:–– set(handle)Return a list of all possible values for an object property:–– get(handle)set(handle, ‘PropertyName’, ‘NewValue’)Example: set(gca, 'XDir', 'Reverse')All the above can also be done (but not at runtime) using the Property Editor2412
Example – Figure Positionspacespace 5;5;top spacetop space 80;80;scn sizescn size get(0,'ScreenSize');get(0,'ScreenSize');pos1pos1 [space,[space, 2/3*scn size(4)2/3*scn size(4) space,.space,.scn size(3)/2scn size(3)/2 -- 2*space,2*space, scn size(4)/3scn size(4)/3 -- (top space(top space space)];space)];pos2pos2 [pos1(1)[pos1(1) scn size(3)/2,scn size(3)/2, pos1(2),.pos1(2),.pos1(3),pos1(3), pos1(4)];pos1(4)];h1h1 figure(1);figure(1);peaks;peaks;h2h2 1, 'Position','Position', pos1)pos1)set(h2,set(h2, 'Position','Position', pos2)pos2)254. Creating GUI using GUIDE What is GUIDE?Creating a GUIThe Layout EditorHands-On GUIDE ExampleWriting Callbacks2613
What is GUIDE? GUIDE is Matlab’s Graphics User Interface (GUI)Design Environment GUIDE stores GUIs in two files, which are generatedthe first time you save or run the GUI:– .fig file - contains a complete description of the GUI figurelayout and the components of the GUI Changes to this file are made in the Layout Editor– .m file - contains the code that controls the GUI You can program the callbacks in this file using the M-file Editor27Creating a GUITypical stages of creating a GUI are:1. Designing the GUI2. Laying out the GUI– Using the Layout Editor3. Programming the GUI– Writing callbacks in the M-file Editor4. Saving and Running the GUI2814
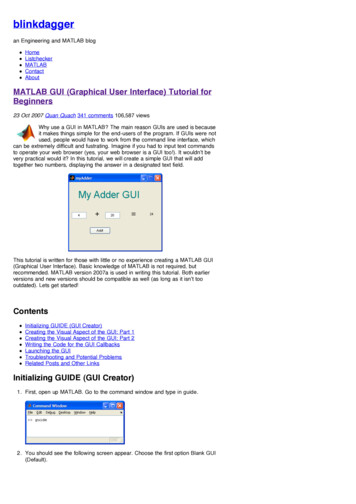
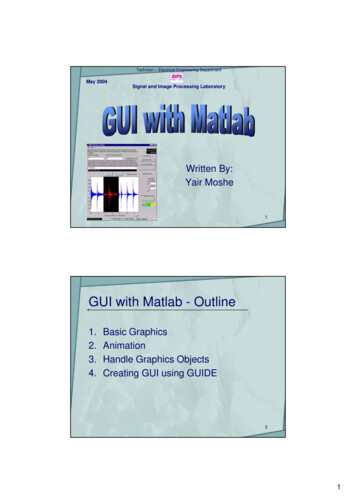
The Layout EditorThe Layout Editor looks like aletteRun ButtonObject BrowserPropertyInspectorLayout AreaFigureResize Tab29Hands-On GUIDE ExampleExample:3015
Writing CallbacksA callback is a sequence of commands that are execute when a graphicsobject is activated Stored in the GUI’s M-file Is a property of a graphics object (e.g. CreateFnc, ButtonDwnFnc,Callback, DeleteFnc) Also called event handler in some programming languagesA callback is usually made of the following stages:1.Getting the handle of the object initiating the action (the objectprovides event / information / values)2.Getting the handles of the objects being affected (the object thatwhose properties are to be changed)3.Getting necessary information / values4.Doing some calculations and processing5.Setting relevant object properties to effect action31Writing CallbacksCallback from example:%% ----- ExecutesExecutes onon buttonbutton presspress inin plot button.plot button.functionfunction plot button Callback(hObject,plot button Callback(hObject, eventdata,eventdata, handles)handles)%% hObjecthObject handlehandle toto plot buttonplot button (see(see GCBO)GCBO)%% eventdataeventdata reservedreserved -- toto bebe defineddefined inin aa futurefuture versionversion ofof MATLABMATLAB%% handleshandles structurestructure withwith handleshandles andand useruser datadata (see(see GUIDATA)GUIDATA)%% GetGet useruser inputinput fromfrom GUIGUIf1f1 str2double(get(handles.f1 input,'String'));str2double(get(handles.f1 input,'String'));f2f2 str2double(get(handles.f2 input,'String'));str2double(get(handles.f2 input,'String'));tt eval(get(handles.t input,'String'));eval(get(handles.t input,'String'));%% CalculateCalculate datadata %% CreateCreate frequencyfrequency plotplotaxes(handles.frequency axes)axes(handles.frequency axes) %% SelectSelect thethe properproper y axes,'XMinorTick','on')set(handles.frequency axes,'XMinorTick','on')gridgrid onon 3216
Further Information1. The Mathworks, Using Matlab Graphics2. The Mathworks, Creating Graphics User Interfaces3. Marchand Patrick, Holland Thomas O., Graphicsand GUIs with Matlab, 3ed, 2003, CRC PressThe documents from Mathworks could be found echdoc/matlab.shtmlMost of this info can also be found in Matlab’s help333417
layout and the components of the GUI Changes to this file are made in the Layout Editor - .m file - contains the code that controls the GUI You can program the callbacks in this file using the M-file Editor 28 Creating a GUI Typical stages of creating a GUI are: 1. Designing the GUI 2. Laying out the GUI - Using the Layout Editor 3.