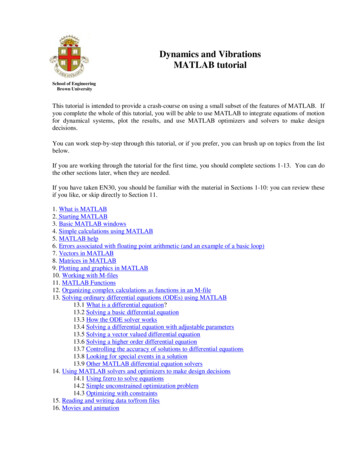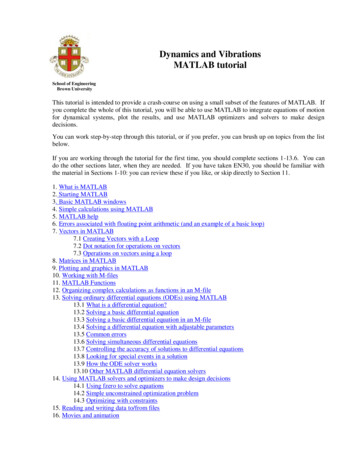
Transcription
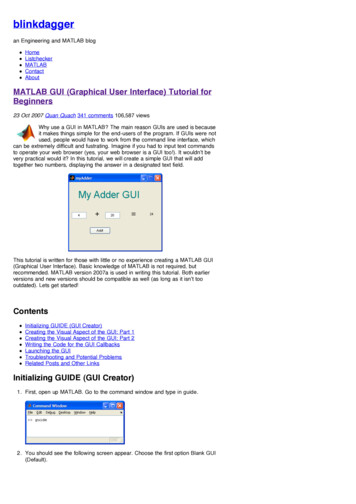
blinkdaggeran Engineering and MATLAB blogHomeListcheckerMATLABContactAboutMATLAB GUI (Graphical User Interface) Tutorial forBeginners23 Oct 2007 Quan Quach 341 comments 106,587 viewsWhy use a GUI in MATLAB? The main reason GUIs are used is becauseit makes things simple for the end-users of the program. If GUIs were notused, people would have to work from the command line interface, whichcan be extremely difficult and fustrating. Imagine if you had to input text commandsto operate your web browser (yes, your web browser is a GUI too!). It wouldnʼt bevery practical would it? In this tutorial, we will create a simple GUI that will addtogether two numbers, displaying the answer in a designated text field.This tutorial is written for those with little or no experience creating a MATLAB GUI(Graphical User Interface). Basic knowledge of MATLAB is not required, butrecommended. MATLAB version 2007a is used in writing this tutorial. Both earlierversions and new versions should be compatible as well (as long as it isnʼt toooutdated). Lets get started!ContentsInitializing GUIDE (GUI Creator)Creating the Visual Aspect of the GUI: Part 1Creating the Visual Aspect of the GUI: Part 2Writing the Code for the GUI CallbacksLaunching the GUITroubleshooting and Potential ProblemsRelated Posts and Other LinksInitializing GUIDE (GUI Creator)1. First, open up MATLAB. Go to the command window and type in guide.2. You should see the following screen appear. Choose the first option Blank GUI(Default).
3. You should now see the following screen (or something similar depending onwhat version of MATLAB you are using and what the predesignated settingsare):4. Before adding components blindly, it is good to have a rough idea about howyou want the graphical part of the GUI to look like so that itʼll be easier to lay itout. Below is a sample of what the finished GUI might look like.Creating the Visual Aspect of the GUI: Part 11. For the adder GUI, we will need the following componentsTwo Edit Text componentsThree Static Text componentOne Pushbutton componentAdd in all these components to the GUI by clicking on the icon and placing itonto the grid. At this point, your GUI should look similar to the figure below :
2. Next, its time to edit the properties of these components. Letʼs start with thestatic text. Double click one of the Static Text components. You should see thefollowing table appear. It is called the Property Inspector and allows you tomodify the properties of a component.3. Weʼre interested in changing the String parameter. Go ahead and edit this textto .Letʼs also change the font size from 8 to 20.After modifying these properties, the component may not be fully visible on theGUI editor. This can be fixed if you resize the component, i.e. use your mousecursor and stretch the component to make it larger.4. Now, do the same for the next Static Text component, but instead of changingthe String parameter to , change it to .5. For the third Static Text component, change the String parameter to whateveryou want as the title to your GUI. I kept it simple and named it MyAdderGUI.You can also experiment around with the different font options as well.6. For the final Static Text component, we want to set the String Parameter to 0.In addition, we want to modify the Tag parameter for this component. The Tagparameter is basically the variable name of this component. Letʼs call itanswer staticText. This component will be used to display our answer, as you
have probably already have guessed.7. So now, you should have something that looks like the following:Creating the Visual Aspect of the GUI: Part 21. Next, lets modify the Edit Text components. Double click on the first Edit Textcomponent. We want to set the String parameter to 0 and we also want tochange the Tag parameter to input1 editText, as shown below. Thiscomponent will store the first of two numbers that will be added together.2. For the second Edit Text component, set the String parameter to 0 BUT set theTag parameter input2 editText. This component will store the second of twonumbers that will be added together.3. Finally, we need to modify the pushbutton component. Change the Stringparameter to Add! and change the Tag parameter to add pushbutton. Pushingthis button will display the sum of the two input numbers.4. So now, you should have something like this:
Rearrange your components accordingly. You should have something like thiswhen you are done:5. Now, save your GUI under any file name you please. I chose to name minemyAdder. When you save this file, MATLAB automatically generates two files:myAdder.fig and myAdder.m. The .fig file contains the graphics of yourinterface. The .m file contains all the code for the GUI.Writing the Code for the GUI CallbacksMATLAB automatically generates an .m file to go along with the figure that you justput together. The .m file is where we attach the appropriate code to the callback ofeach component. For the purposes of this tutorial, we are primarily concerned onlywith the callback functions. You donʼt have to worry about any of the other functiontypes.1. Open up the .m file that was automatically generated when you saved yourGUI. In the MATLAB editor, click on theicon, which will bring up a list of thefunctions within the .m file. Select input1 editText Callback.2. The cursor should take you to the following code block:function input1 editText Callback(hObject, eventdata, handles)% hObject handle to input1 editText (see GCBO)% eventdata reserved - to be defined in a future version of MATLAB% handles structure with handles and user data (see GUIDATA)% Hint: get(hObject,'String') returns contents of input1 editText as text%str2double(get(hObject,'String')) returns contents of%input1 editText as a doubleAdd the following code to the bottom of that code block:%store the contents of input1 editText as a string. if the string%is not a number then input will be empty
input str2num(get(hObject,'String'));%checks to see if input is empty. if so, default input1 editText to zeroif a(hObject, handles);This piece of code simply makes sure that the input is well defined. We donʼtwant the user to put in inputs that arenʼt numbers! The last line of code tellsthe gui to update the handles structure after the callback is complete. Thehandles stores all the relevant data related to the GUI. This topic will bediscussed in depth in a different tutorial. For now, you should take it at facevalue that itʼs a good idea to end each callback function with guidata(hObject,handles); so that the handles are always updated after each callback. This cansave you from potential headaches later on.3. Add the same block of code to input2 editText Callback.4. Now we need to edit the add pushbutton Callback. Click on theicon andselect add pushbutton Callback. The following code block is what you shouldsee in the .m file.% --- Executes on button press in add pushbutton.function add pushbutton Callback(hObject, eventdata, handles)% hObject handle to add pushbutton (see GCBO)% eventdata reserved - to be defined in a future version of MATLAB% handles structure with handles and user data (see GUIDATA)Here is the code that we will add to this callback:a get(handles.input1 editText,'String');b get(handles.input2 editText,'String');% a and b are variables of Strings type, and need to be converted% to variables of Number type before they can be added togethertotal str2num(a) str2num(b);c num2str(total);% need to convert the answer back into String type to display itset(handles.answer staticText,'String',c);guidata(hObject, handles);5. Letʼs discuss how the code we just added works:a get(handles.input1 editText,'String');b get(handles.input2 editText,'String');The two lines of code above take the strings within the Edit Text components,and stores them into the variables a and b. Since they are variables of Stringtype, and not Number type, we cannot simply add them together. Thus, wemust convert a and b to Number type before MATLAB can add them together.6. We can convert variables of String type to Number type using the MATLABcommand str2num(String argument). Similarly, we can do the opposite usingnum2str(Number argument). The following line of code is used to add the twoinputs together.total (str2num(a) str2num(b));The next line of code converts the sum variable to String type and stores it intothe variable c.c num2str(total);The reason we convert the final answer back into String type is because theStatic Text component does not display variables of Number type. If you didnot convert it back into a String type, the GUI would run into an error when ittries to display the answer.7. Now we just need to send the sum of the two inputs to the answer box that wecreated. This is done using the following line of code. This line of codepopulates the Static Text component with the variable c.set(handles.answer staticText,'String',c);The last line of code updates the handles structures as was previously
mentioned.guidata(hObject, handles);Congratulations, weʼre finished coding the GUI. Donʼt forget to save your m-file.It is now time to launch the GUI!8. If you donʼt want MATLAB to automatically generate all those comments foreach of the callbacks, there is a way to disable this feature. From the GUIeditor, go to File, then to Preferences.Launching the GUI1. There are two ways to launch your GUI.The first way is through the GUIDE editor. Simply press theGUIDE editor as shown in the figure below:icon on theThe second method is to launch the GUI from the MATLAB commandprompt. First, set the MATLAB current directory to wherever you savedyour .fig and .m file.Next, type in the name of the GUI at the command prompt (you donʼtneed to type the .fig or .m extension):2. The GUI should start running immediately:
Try to input some numbers to test out the GUI. Congratulations on creatingyour first GUI!Troubleshooting and Potential ProblemsSo your GUI doesnʼt work and you donʼt know why. Here are a couple of tips thatmight help you find your bug:1. If you canʼt figure out where you error is, it might be a good idea to quickly gothrough this tutorial again.2. The command line can give you many hints on where exactly the problemresides. If your GUI is not working for any reason, the error will be outputted tothe command prompt. The line number of the faulty code and a shortdescription of the error is given. This is always a good place to startinvestigating.3. Make sure all your variable names are consistent in the code. In addition,make sure your component Tags are consistent between the .fig and the .mfile. For example, if youʼre trying to extract the string from the Edit Textcomponent, make sure that your get statement uses the right tag! Morespecifically, if you have the following line in your code, make sure that younamed the Edit Text component accordingly!a get(handles.input1 editText,'String');4. The source code is available here, and could be useful for debuggingpurposes.5. If all else fails, leave a comment here and weʼll try our best to help.Related Posts and Other LinksMATLAB GUI Tutorial - SliderMATLAB GUI Tutorial - Pop-up MenuMATLAB GUI Tutorial - Plotting Data to AxesMATLAB GUI Tutorial - Button Types and Button GroupMATLAB GUI Tutorial - A Brief Introduction to handlesMATLAB GUI Tutorial - Sharing Data among Callbacks and Sub FunctionsVideo Tutorial: GUIDE BasicsMore GUI Tutorial Videos From Doug HullThis is the end of the tutorial.341 Responses to “MATLAB GUI (Graphical User Interface) Tutorialfor Beginners”1. on 20 Nov 2007 at 10:04 am 1 MikeThanks for the tutorial - its nice and clear
blinkdaggeran Engineering and MATLAB blogHomeListcheckerMATLABContactAboutMATLAB GUI Tutorial - Button Types and ButtonGroup03 Nov 2007 Quan Quach 93 comments 25,002 viewsIntroductionIn this three-part Matlab GUI Tutorial, you will learn how to use thedifferent types of buttons available within Matlab GUIs. These buttontypes are: push button, radio button, check box, and toggle buttons. Inaddition, you will learn how to use the button panel to control a group of buttons.This tutorial is written for those with little or no experience creating a Matlab GUI(Graphical User Interface). If youʼre new to creating GUIs in Matlab, you should visitthis tutorial first. Basic knowledge of Matlab is recommended. Matlab version 2007ais used in writing this tutorial. Both earlier versions and new versions should becompatible as well (as long as it isanʼt too outdated). Letʼs get started!Part One: The PushbuttonThe push button is a very simple component. When the user clicks on a pushbutton, it causes an action to occur. This action is dictated by the code that isprogrammed in the push buttonʼs callback function. In this part of the tutorial, we willprogram the push button to display some text when it is pressed.1. First, we are going to create the visual aspect of the GUI. Open up Matlab. Goto the command window and type in guide.
2. You should see the following screen appear. Choose the first option Blank GUI(Default).3. Click onand add one Static Text component to the GUI figure. Next, clickonand add one Push button component onto the GUI figure.4. Double click the Static Text component to bring up the Property Inspector.Change the String property so that there is nothing inside. Change the Tagproperty to display staticText. Similarly, double click on the Pushbuttoncomponent and change the String property to Display Text! and change theTag property to displayText pushbutton.5. Hereʼs what your figure should look like after you add the components andmodify them.
6. Save your GUI wherever you please with your desired filename.7. Now, we are going to write the code for the GUI. When you save your GUI,Matlab automatically generates an .m file to go along with the figure that youjust put together. The .m file is where we attach the appropriate code to thecallback of each component. For the purposes of this tutorial, we are primarilyconcerned only with the callback functions. You donʼt have to worry about anyof the other function types.Open up the .m file that was automatically generated when you saved yourGUI. In the Matlab editor, click on theicon, which will bring up a list of thefunctions within the .m file. Select displayText pushbutton Callback.Add the following code to the function:%display "Hello Wordl!" in the static text component when the%pushbutton is pressedset(handles.display staticText,'String','Hello World!');8. Now that weʼve completed both the visual and code aspects of the GUI, itstime to run the GUI to make sure it works before we move on. From the m-fileeditor, you can click on theicon to save and run the GUI. Alternatively, fromthe GUIDE editor, you can click on theto launch the GUI. The GUI shouldappear once you click the icon. Now try clicking on the button to make surethat Hello World! appears on the GUI.And thatʼs it. Those are the basics of using the Push button component. Now weʼreready to move onto the Check box component.Part Two: The Check BoxThe Check Box component has two states, checked and unchecked. Thesecomponents are usually used to control options that can be turned on and off. Inthis part of the tutorial, we will add the functionality of making the display textbecome bold or unbolded.1. The first thing we need to do is to add a Check Box Component to the GUIfigure that we were just working with. So if you closed GUIDE, reopen it again.Once you have GUIDE opened again, Click onand add one Check Boxcomponent to the GUI figure.
2. Double click the Check Box component to bring up the Property Inspector.Change the String property to Bold. Change the Tag property tobold checkbox.3. Hereʼs what your figure should look like after you add the Check Boxcomponent and modify it.4. Add the following code to the bold checkbox Callback function:%checkboxStatus 0, if the box is unchecked,%checkboxStatus 1, if the box is checkedcheckboxStatus get(handles.bold checkbox,'Value');if(checkboxStatus)%if box is checked, text is set to boldset(handles.display staticText,'FontWeight' , 'bold');else%if box is unchecked, text is set to normalset(handles.display staticText,'FontWeight', 'normal');endNote: The bold checkbox Callback function triggers when the user activatesthe check box AND when the user deactivates the check box.5. Now that weʼve completed both the visual and code aspects of the GUI, itstime to run the GUI to make sure it works before we move on. Try checkingand unchecking the Check Box component to make sure that the text “HelloWorld!” is being bolded and unbolded.
And thatʼs it. Those are the basics of using the Check Box component. Now weʼreready to move onto the Button Group, which is the most challenging part of thistutorial.Part Three: Radio Buttons, Toggle Buttons, andButton Group PanelRadio buttons and Toggle buttons are used exactly the same way that check boxesare used in Matlab GUIs, so we wonʼt go over how to use them. But there is onespecial case that needs to be covered. When either radio buttons or toggle buttonsare used in conjunction with the button group panel, they exhibit mutually exclusivebehavior. Simply put, this means that only one radio button or one toggle button canbe selected at a time. This behavior can come in very useful for some GUIs. Sinceradio buttons and toggle buttons are identical in their functionality, what is saidabout one, is true for the other. Thus, only radio buttions will be discussed from hereon out.In this part of the tutorial, we will create a button group that will allow you to choosebetween different font sizes for the display text.1. The first thing we need to do is to add a Button Panel component to the GUIfigure that we were just working with. So if you closed GUIDE, reopen it again.Once you have GUIDE opened again, click onand add one Button Panelcomponent to the GUI figure. Make sure itʼs large enough to fit in three radiobuttons. Next, click onand add three radio buttons onto the button grouppanel.2. Double click on the first Radio Button component to bring up the PropertyInspector. Change the String property to 8. Change the Tag property tofontsize08 radiobutton.Next, double click on the second Radio Button component, and change theString property to 12, and change the Tag property to fontsize12 radiobutton.Next, double click on the third Radio Button component, and change the Stringproperty to 16, and change the Tag property to fontsize16 radiobutton.
Finally, double click on the button group panel and change the Tag property tofontSelect buttongroup. You should also change the String property for thebutton group panel to Fontsize.3. Hereʼs what your figure should look like after you add the components andmodify them.4. Before we move on, we should check the hierarchical structure of the GUIfigure. Click on theicon and the followinging should appear:Make sure that the three radio buttons are one hierarchy below the buttongroup icon.5. Add the following line of code to the opening function. In this tutorial example,it is named button tutorial OpeningFcn function. Yours will be the name of thefile you saved it as, followed by “ OpeningFcn”.set(handles.fontSelect buttongroup,'SelectionChangeFcn',@fontSelect buttongroup SelectionChangeFcn);Make sure the previous line was added right before the line:guidata(hObject, handles);Next, add the following function at the very end of the .m file.function fontSelect buttongroup SelectionChangeFcn(hObject, eventdata)%retrieve GUI data, i.e. the handles structurehandles guidata(hObject);switch get(eventdata.NewValue,'Tag') % Get Tag of selected objectcase 'fontsize08 radiobutton'%execute this code when fontsize08 radiobutton is selectedset(handles.display staticText,'FontSize',8);
case 'fontsize12 radiobutton'%execute this code when fontsize12 radiobutton is selectedset(handles.display staticText,'FontSize',12);case 'fontsize16 radiobutton'%execute this code when fontsize16 radiobutton is selectedset(handles.display staticText,'FontSize',16);otherwise% Code for when there is no match.end%updates the handles structureguidata(hObject, handles);6. Notice that the callback functions for the radio buttons were not automaticallygenerated by Matlab. This is completely normal. Each time a button is selectedwithin the Button Group Panel component, the function defined within theSelectionChangeFcn property of Button Group Panel component is called. Theline of code that was added in the opening function specifies the callbackfunction when a button within the button group is selcted. The selection changefunction is then defined at the end of the .m file.7. Now that weʼve completed both the visual and code aspects of the GUI, itstime to run the GUI again. Try clicking on all of the buttons to make sure theyperform their function correctly. Specifically, make sure that the font sizechanges accordingly.And thatʼs it. Those are the basics of using the different buttons within the MatlabGUI.Download Source FilesSource files can be downloaded here.This is the end of the tutorial.93 Responses to “MATLAB GUI Tutorial - Button Types and ButtonGroup”1. on 14 Dec 2007 at 1:36 am 1 TongtongA very good tutorial for the beginners. Thanks.2. on 14 Dec 2007 at 2:09 am 2 Tongtong
blinkdaggeran Engineering and MATLAB blogHomeListcheckerMATLABContactAboutMATLAB GUI Tutorial - Plotting Data to Axes31 Oct 2007 Quan Quach 176 comments 25,632 viewsIntroductionIn this Matlab GUI tutorial, you will learn how to create and use the Axescomponent. The Axes component allows you to display graphics, such asgraphs and images on your GUI. In this tutorial, we will create two axeson the GUI and plot some simple data onto it. In addition, we will include a resetbutton to clear the axes and we will also add the standard toolbar to allow the userto zoom, pan, and query the plot.This tutorial is written for those with little or no experience creating a Matlab GUI(Graphical User Interface). If youʼre new to creating GUIs in Matlab, you should visitthis tutorial first. Basic knowledge of Matlab is recommended. Matlab version 2007ais used in writing this tutorial. Both earlier versions and new versions should becompatible as well (as long as it isanʼt too outdated). Letʼs get started!Create the Visual Aspect of the GUI1. First, open up Matlab. Go to the command window and type in guide.2. You should see the following screen appear. Choose the first option Blank GUI(Default).
3. Click onand add two Axes components to the GUI figure. Next, click onand add three Pushbutton components onto the GUI figure.4. Double click the Axes component to bring up the Property Inspector. Changethe Tag property to axes1, which should already be the default name.Additionally, make sure the other Axes componentʼs Tag property is namedaxes2.5. Next, letʼs modify the properties of the Pushbutton components. Double clickon one of the Pushbutton components. Change the String property to PlotAxes 1, and the Tag property to plotAxes1 pushbutton, as shown below.Similarly, double click on the next pushbutton and change the String propertyto Plot Axes 2 and change the Tag property to plotAxes2 pushbutton.Finally, double click on the final pushbutton and change the String property toClear Axes and change the Tag property to clearAxes pushbutton.6. Hereʼs what your figure should look like after you add the components andmodify them.
7. Save your GUI wherever you please with your desired filename.Writing the Code for the GUIMatlab automatically generates an .m file to go along with the figure that you justput together. The .m file is where we attach the appropriate code to the callback ofeach component. For the purposes of this tutorial, we are primarily concerned onlywith the callback functions. You donʼt have to worry about any of the other functiontypes.1. Open up the .m file that was automatically generated when you saved yourGUI. In the Matlab editor, click on theicon, which will bring up a list of thefunctions within the .m file. Select plot1 pushbutton Callback.Add the following code to the function:%selects axes1 as the current axes, so that%Matlab knows where to plot the dataaxes(handles.axes1)%creates a vector from 0 to 10, [0 1 2 3 . . . 10]x 0:10;%creates a vector from 0 to 10, [0 1 2 3 . . . 10]y 0:10;%plots the x and y dataplot(x,y);%adds a title, x-axis description, and y-axis descriptiontitle('Axes 1');xlabel('X data');ylabel('Y data');guidata(hObject, handles); %updates the handles2. Similarly, we want to put the following code into theplot2 pushbutton Callback:%selects axes2 as the current axes, so that%Matlab knows where to plot the dataaxes(handles.axes2)%creates a vector from 0 to 10, [0 1 2 3 . . . 10]x 0:10;%creates a vector [0 1 4 9 . . . 100]y x. 2
%plots the x and y dataplot(x,y);%adds a title, x-axis description, and y-axis descriptiontitle('Axes 2');xlabel('X data');ylabel('Y data');guidata(hObject, handles); %updates the handles3. Next, we need to add some code to the clearPlots pushbutton Callback:%these two lines of code clears both eset')guidata(hObject, handles); %updates the handles4. And finally, we need to add the following line of code toaxes tutorial OpeningFcn:set(hObject,'toolbar','figure');This line of code should be placed right before:guidata(hObject, handles);This line of code effectively adds the standard toolbar to the GUI, allowing theuser to zoom, pan, query the plot, and more. The standard toolbar and a briefdescription of the icons are shown below:5. Save your m-file!Run and Test the GUINow that weʼve completed both the visual and code aspects of the GUI, its time torun the GUI to make sure it works.1. From the m-file editor, you can click on theicon to save and run the GUI.Alternatively, from the GUIDE editor, you can click on theto launch theGUI. The following GUI should appear once you click the icon:2. Go ahead and try pressing all of the buttons to make sure they work. Ifeverything was done correctly, you should see the following plots. Also, youcan use the icons that are within the red box to test out the other functions.
3. And thatʼs it. Those are the basics of using the Axes component. You canexplore the other options that the axes has to offer through the PropertyInspector.This is the end of the tutorial.Source files can be downloaded here.176 Responses to “MATLAB GUI Tutorial - Plotting Data to Axes”1. on 12 Jan 2008 at 12:48 pm 1 Vaibhav BediaWhen i close MATLAB and start guide again my axes loses its TAG and hencebecomes invisible.How do i solve this?2. on 20 Jan 2008 at 4:48 pm 2 Alexnice one! U need to write some more stuff for beginners3. on 13 Feb 2008 at 3:59 pm 3 SaikatThank you so much . I love your style and find your instructions very helpful.Going through the programs you have written for us, the beginners, I feel moreconfident of writing my own codes .Thank you once again .4. on 17 Feb 2008 at 11:03 am 4 TantyWhat a great tutorial.Im working on my final project, so this tutorial help me solve my problem writingthe code for axes.Thanks.5. on 17 Mar 2008 at 9:57 pm 5 lovejoyhow to plot a resultant vector in GUI ex.10N 5N6. on 26 Mar 2008 at 4:28 am 6 nolavery nice tutorial.however i had a query for you.when i do a zoom on the image.and click one pushbutton to make anaction.the image return to its initial dimensions(i loose the zoom) could youhelp me on this subject?7. on 26 Mar 2008 at 12:37 pm 7 Daniel SutoyoHi Nolagood question although I havenʼt tried to code it yet, what you need to do isto get the new axes info and store it somewhere.For example, your axes is called handles.axes1. You will have to use the get()and get the min,max axis on handles.axes1 and store in a variable for examplemyaxis.
blinkdaggeran Engineering and MATLAB blogHomeListcheckerMATLABContactAboutMatlab GUI Tutorial - Pop-up Menu29 Oct 2007 Quan Quach 137 comments 20,912 viewsIntroductionIn this Matlab GUI tutorial, you will learn how to create and use the Popup Menu component. Pop-up menus are used as a control for choosingbetween a set of options. When the user clicks on the Pop-up menu, themenu expands, revealing a set of choices that the user can pick. A common use forPop-up menus is a font size selector (shown below).This tutorial is written for those with little or no experience creating a Matlab GUI(Graphical User Interface). If youʼre new to creating GUIs in Matlab, you should visitthis tutorial first. Basic knowledge of Matlab is not required, but recommended.Matlab version 2007a is used in writing this tutorial. Both earlier versions and newversions should be compatible as well (as long as it isanʼt too outdated). Letʼs getstarted!Create the Visual Aspect of the GUI1. First, open up Matlab. Go to the command window and type in guide.2. You should see the following screen appear. Choose the first option Blank GUI(Default).
3. Click onand add a Static Text component to the GUI figure. Next, click onand add a Pop-up Menu component onto the GUI figure.4. Double click the Static Text component to bring up the Property Inspector.Change the String property to Testing!!!, and change the Tag property totesting staticText as shown in the figure below:You can also modify the BackgroundColor property if you desire.5. Next, letʼs modify the properties of the Pop-up Menu component. First, click onthe icon on the String property line as shown below. This allows you to edit thedescription for each option in the Pop-Up Menu.After clicking on the icon, you should now see the following window. Fill in thewindow as shown below:
In addition, I set the Tag property to popupmenu1, which is the default name.You might want to make sure that its named properly before you move on.6. Hereʼs what your figure should look like
recommended. MATLAB version 2007a is used in writing this tutorial. Both earlier versions and new versions should be compatible as well (as long as it isnʼt too outdated). Lets get started! Contents Initializing GUIDE (GUI Creator) Creating the Visual Aspect of the GUI: Part 1 Creating the Visual Aspect of the GUI: Part 2