Transcription
Real Scale Experimentations ofSLURM Resource and Job Management SystemYiannis GeorgiouPhD Candidate, BULL R&D Software EngineerOctober 4, 20101 / 34
Plan1IntroductionExperimentation in High Performance Computing2Real-Scale Experimentation for Resource and Job Management SystemsMethodology - Platforms and Workloads3SLURM Experimental Analysis and Performance EvaluationScheduling EfficiencyScalabilityEnergy Efficient ManagementNetwork Topology Aware Placement4Conclusions and Ongoing Works5Appendix - References2 / 34
IntroductionIntroductionTechnological evolutions have introduced extra levels of hiererchies that need tobe treated by the resource management systemThe scientific needs and the increasing demands for computing power byapplications made users more demanding in terms of robustness and certainquality of services.Continuous growth of cluster’s sizes and network diameters lead to issuesconcerning scalability, scheduling efficiency for optimal communication speeds,fault tolerance and energy efficient management.How can we make sure that a Resource and Job Management System will be ableto deal with those challenges?3 / 34
IntroductionExperimentation in High Performance ComputingExperimental Methodologies for HPCThe study of HPC systems depends on large number of parameters andconditions.Experimentation in HPC makes use of simulators or emulators which presentadvantages (control of experiments, ease of reproduction) but they fail to captureall the dynamic, variety and complexity of real life conditions.Real-scale experimentation is needed in HPC for study and evaluation of allinternal functions as one complete system.4 / 34
IntroductionExperimentation in High Performance ComputingWorkload ModellingPerformance evaluation by executing a sequence of jobs. This sequence is theactual workload that will be injected to the system.Two common ways to use a workload for system evaluation.12Synthetic Workload GenerationEither a workload log (trace): record of resource usage data about a stream ofparallel and sequential jobs that were submitted and run on a real parallel system,or a workload model (synthetic workload): based on some probability distributions togenerate workload data, with the goal of clarifying their underlying principles (ESPbenchmark).Real Workload Trace TreatmentInput ParametersInitial Workload Trace fileAdapted Workload Generation from input parametersWorkload Trace DecompositionWorkload Trace Analysis and Part Selection for ExecutionWorkload Trace AnalysisWorkload Trace fileWorkload Conversion and Normalization for SubmissionApplications Used for ExecutionTrace Part Submission for Execution# simple sleep jobs# Linpack# NAS NPB 3.3# MandelbrotWorkload Trace Analysis# System Utilization# Jobs Arrival Rate# pchksum# Jobs StrechTimeWorkload Execution upon Cluster# Jobs Waiting Time# Energy Consumption# MCFOST AstrophysicalResults Collection and Jobs data conversion to Workload TraceWorkload Trace FileWorkload Trace Analysis and Post-treatment for validationWorkload Logs5 / 34
IntroductionExperimentation in High Performance ComputingStandard Workload FormatDefinition of SWF format to describe the execution of a sequence of jobs.;;;;;;;;;;;;;;;;;;;;;;;;;;;;;Computer: Linux cluster (Atlas)Installation: High Performance Computing - Lawrence Livermore National LaboratoryMaxJobs: 60332MaxRecords: 60332Preemption: NoUnixStartTime: 1163199901TimeZone: 3600TimeZoneString: US/PacificStartTime: Fri Nov 10 15:05:01 PST 2006EndTime:Fri Jun 29 14:02:41 PDT 2007MaxNodes: 1152MaxProcs: 9216Note: Scheduler is Slurm ions: 4Partition: 1 pbatchPartition: 2 pdebugPartition: 3 pbrokePartition: 4 moody2024882489249024912492j o b 44443434444343444793544485834449388s u b m i t 00000w a i t 8714103897634792284r u n t i m e 10241024233623362336p r o c a l l o c c p u u s e d -1-1-1-1-1-1-1-1-1-1m e m u s e d 10241024233623362336p r o c r e q -1-1108001080010800u s e r e s t -1-1-1-1-1m s u g e q e t i i x m a d d e n t u r u n m e s u q m 0 17 -1 307 -11 17 -1 309 -113 -15 -113 -15 -103 -15 -1p p ta r hr e it v ni kt j i o to b in m e1 -1 -11 -1 -11 -1 -11 -1 -11 -1 -16 / 34
Real-Scale Experimentation for Resource and Job Management SystemsExperimental Methodology - General PrinciplesReal-Scale experimentation upon dedicated platforms: Control andReproduction of experiments.Injection of characterised workloads to observe the behaviour of the RJMSunder particular conditions.Extraction of the produced workload trace and post-treatment analysis of theresults.7 / 34
Real-Scale Experimentation for Resource and Job Management SystemsMethodology - Platforms and WorkloadsExperimental Methodology - PlatformsReal-Scale experimentation upon dedicated controlled platform:Grid5000 Experimental grid1 , large-scale distributed platform that can be easilycontrolled, reconfigured and monitored.Specially designed for research in computer science, it provides the ability ofenvironment deployment to facilitate the experimentation upon all differentlayers of the software stack.1https://www.grid5000.fr/8 / 34
Real-Scale Experimentation for Resource and Job Management SystemsMethodology - Platforms and WorkloadsExperimental Methodology - WorkloadsA particular case of synthetic workload is the ESP benchmark. It has been designed to:provide a quantitative evaluation of launching and scheduling functions of aresource and job management system via a single metric, which is the smallestelapsed execution time of a representative workloadComplete independence from the hardware performance (execution of a simpleMPI application (pchcksum) with fixed target run-time)Ability for efficiency evaluation of different scheduling policies (injection of thesame workload)Ability for scalability evaluation of the RJMS (dynamically adjusted proportionaljob mix to reflect the system scale)Synthetic Workload GenerationReal Workload Trace TreatmentInput ParametersInitial Workload Trace fileAdapted Workload Generation from input parametersWorkload Trace DecompositionWorkload Trace Analysis and Part Selection for ExecutionWorkload Trace AnalysisWorkload Trace fileWorkload Conversion and Normalization for SubmissionApplications Used for ExecutionTrace Part Submission for Execution# simple sleep jobs# Linpack# NAS NPB 3.3# MandelbrotWorkload Trace Analysis# System Utilization# Jobs Arrival Rate# pchksum# Jobs StrechTimeWorkload Execution upon Cluster# Jobs Waiting Time# Energy Consumption# MCFOST AstrophysicalResults Collection and Jobs data conversion to Workload TraceWorkload Trace FileWorkload Trace Analysis and Post-treatment for validationESP benchmark9 / 34
Real-Scale Experimentation for Resource and Job Management SystemsMethodology - Platforms and WorkloadsExperimental Methodology - Analysis10 / 34
SLURM Experimental Analysis and Performance EvaluationScheduling EfficiencyScheduling Policies Comparisons - ExperimentationDifferent runs of ESP benchmark: launching the same workload (default ESP) andexecuting the same application (pchcksum)upon the same dedicated cluster: 1 server, 8 nodes (Intel Xeon 2.5GHz 2 CPU-4CORE, RAM 8 GB, Infiniband 20G)with the same conditions and parameters:SLURM v2.2.0.0-pre3 with accounting (mysql-slurmdbd),granularity (cons res),task confinement (task affinity/cpuset),NO topology plugin,NO backup slurmctldbut only one difference the scheduling policy : backfill, preemption,gang-scheduling11 / 34
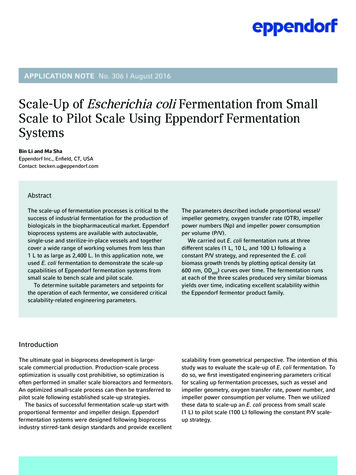
SLURM Experimental Analysis and Performance EvaluationScheduling EfficiencyScheduling Policies Comparisons - ResultsScheduling PolicyTotal Workload Execution timeESP Efficienybackfill12877sec83.7%backfill %Table: ESP benchmark results for SLURM scheduling policies upon a 8 nodes (64 cores) clusterSystem Utilization with ESP Benchmark on a 8 nodes cluster (dualCPU-quadCORE)with SLURM backfill scheduler (ESP Efficiency 83.7%)System Utilization with ESP Benchmark upon a cluster of 8 nodes (dualCPU-quadCore)with SLURM backfill preemption scheduler (ESP Efficiency 84.3%)7070Instant UtilizationJob Start Time Impulse6050Resources (cores)Resources (cores)Instant UtilizationJob Start Time 01200014000160000200040006000Time (sec)800010000120001400016000Time (sec)System Utilization with ESP Benchmark on a 8 nodes cluster (dualCPU-quadCore)with SLURM gang-scheduling policy (ESP Efficiency 94.8%)70Instant UtilizationJob Start Time Impulse60Resources (cores)5040302010Details002000400060008000Time (sec)1000012000140001600012 / 34
SLURM Experimental Analysis and Performance EvaluationScheduling EfficiencyScheduling Policies Comparisons - Analysisgang scheduling the best performance, allowing the efficient filling up of all the’holes’ in the scheduling spacehowever this is due to the simplicity of the particular application suspend/resumehappens on memory , no swapping neededpreemption better than backfill: due to the 2 higher priority ”all resources jobs”.13 / 34
SLURM Experimental Analysis and Performance EvaluationScalabilityScalability ExperimentationsDedicated cluster 1 central controller, 320 computing nodes(quadCPU-octoCORE Intel Xeon 7500).with the same conditions and parameters:SLURM v2.2.0.0-pre7 with accounting (mysql-slurmdbd),granularity (cons res),task confinement (task affinity/cpuset),NO topology plugin,NO backup slurmctld1Scaling in the size of the cluster and execute ESP benchmark for launching andscheduling scalability evaluation.2Scaling in the number of simultaneously submitted jobs and evaluate thethroughput of the scheduler.14 / 34
SLURM Experimental Analysis and Performance EvaluationScalabilityScaling the size of the clusterCluster size (Number of cores)Average Jobs Waiting time (sec)Total Workload Execution time (sec)ESP Efficieny for backfill preemption policy51227661299282.9%921629191309982.3%Table: ESP benchmark results for SLURM backfill preemption scheduling and different clustersizesSystem utilization for ESP synthetic workload and SLURM - 512 cores600System utilization for ESP synthetic workload and SLURM - 9216 cores10000SLURMJob Start Time ImpulseSLURMJob Start Time Impulse5008000Cores UtilizationNumber of me sec1000012000140001600002000400060008000Time sec10000120001400016000CDF Graphs15 / 34
SLURM Experimental Analysis and Performance EvaluationScalabilityScaling the number of submitted jobs:Backfill policySubmission burst of small granularity jobs (srun -n1 sleep 1000)Good throughput performance for backfill scheduler16 / 34
SLURM Experimental Analysis and Performance EvaluationScalabilityScaling the number of submitted jobs:Backfill with Preemption policySubmission burst of small granularity jobs (srun -n1 sleep 1000)No different priorities between jobs, hence no possibility of preemptionDegredation problems with backfill preemption100500Number of Jobs150Instant Throughput for 7000 submitted jobs (1core each)upon a 10240 cores cluster (Backfill Preemption Mode)050100150200250300Proposed OptimizationTime(sec)17 / 34
SLURM Experimental Analysis and Performance EvaluationEnergy Efficient ManagementEnergy Efficient Resource ManagementDedicated cluster 1 SLURM central controller, 32 computing nodes (DualCPU,2GB, Gigabit Ethernet).with the same conditions and parameters SLURM-2.1launch a workload based on a trace file with 89.7% system utilization, executeNAS BT class C applications and measure the energy consumption of the wholeclusteronly difference: enable or not the power saving mode.Energy Consumption collected by Watt-meters (per node measures).18 / 34
SLURM Experimental Analysis and Performance EvaluationEnergy Efficient ManagementEnergy Efficient Resource ManagementEnergy consumption of trace file execution with 89.62% of system utilization and NAS BT benchmarkTotal Execution Time:Total Energy Consumed:NORMAL Management 53.617888025 KWatts.hourGREEN Management 47.538609925 KWatts.hour500040003000200010000Consumption [Watt]600070008000NORMAL 26557GREEN 266380200040006000800010000 12000 14000 16000 18000 20000 22000 24000 26000Time [s]CDF Graphs19 / 34
SLURM Experimental Analysis and Performance EvaluationNetwork Topology Aware PlacementNetwork Topology Aware Placement EvaluationsDedicated cluster 1 SLURM central controller, 128 computing nodes(quadCPU-octoCORE Intel Xeon 7500).network topological constraints, 2 different islands , 64 nodes per island : higherbandwidth in the same islandwith the same conditions and parameters SLURM v2.2.0.0-pre7launch a workload based on ESP workload but without fixed run time forapplications so as to observe the real execution time of the applicationin place of pchksum execute NAS MPI CG class D applications (sensitive incommunications) and observe the total execution time of the whole workloadonly difference: enable or not the topology plugin.20 / 34
SLURM Experimental Analysis and Performance EvaluationNetwork Topology Aware PlacementNetwork Topology Aware Placement EvaluationsSLURM NB cores-TOPO Cons / Topo-ESP-NAS-ResultsTotal Execution time(sec)Average Wait time(sec)Average Execution time(sec)Efficieny for Topo-ESP-NASJobs on 1 islandJobs on 2 islandsTheoretic- Ideal values12227100%22824096 NO-Topology Aware17518457550269.8%165654096 Topology Aware16985461748372.0%18347Table: TOPO-ESP-NAS benchmark results for 4096 resources cluster21 / 34
Conclusions and Ongoing WorksConclusions SLURMSLURM Resource and Job Management System has been choosen for BULL HighPerformance Computing Petaflopic Offer:Scalable, Efficient and RobustPassing the Petaflop barrier allowed us to experiment with scalability levels thatare attained for the first time,Real scale - controlled experimentation guarantees that SLURM performanceand efficiency will stay as expected.Research for ways of simulating an even larger platform in order to prepare theResource and Job Management Systems for the next level of scalability.Deeper Workload Traces Modelization and replays of trace models for possibleoptimization (application performance, energy consumption) by considering theside-effects, tradeoffs22 / 34
Conclusions and Ongoing WorksOngoing Works and CollaborationsBULL’s Team for SLURM Developments and Support: Martin Perry (cgroups),Nancy Kritkausky, David Egolf(Licenses Management), Rod Schultz(topologyextraction), Eric Lynn, Dan Rusak(sview), Doug Parisek(Power Management), BillBrophy (strigger,scheduling optimizations), Yiannis GeorgiouCollaborations with CEA: Matthieu Heutreux, Francis BelotResearch continuous in modelization and experimentation Gael Gorgo (BULL,INRIA), Joseph Emeras (INRIA, CEA), Olivier Richard (INRIA)23 / 34
Conclusions and Ongoing Works24 / 34
Appendix - ReferencesScheduling Evaluation: BackfillSystem Utilization with ESP Benchmark on a 8 nodes cluster (dualCPU-quadCORE)with SLURM backfill scheduler (ESP Efficiency 83.7%)70Instant UtilizationJob Start Time Impulse60Resources 16000Time (sec)25 / 34
Appendix - ReferencesScheduling Evaluation: Backfill PreemptionSystem Utilization with ESP Benchmark upon a cluster of 8 nodes (dualCPU-quadCore)with SLURM backfill preemption scheduler (ESP Efficiency 84.3%)70Instant UtilizationJob Start Time Impulse60Resources 16000Time (sec)26 / 34
Appendix - ReferencesScheduling Evaluation: Gang SchedulingBack.System Utilization with ESP Benchmark on a 8 nodes cluster (dualCPU-quadCore)with SLURM gang-scheduling policy (ESP Efficiency 94.8%)70Instant UtilizationJob Start Time Impulse60Resources 16000Time (sec)27 / 34
Appendix - ReferencesJobs Waiting Time1.0Cumulated Distribution Function on Waiting time for ESP benchmark andSLURM backfill preemption scheduler0.60.40.20.0Jobs it time [sec]Back.28 / 34
Appendix - ReferencesThroughput Preemption - Proposed OptimizationDegredation is due to unnecessary checks for each job for a preemption space even ifall jobs have the same priority.In gang logic, skip shadow processing if the priority of all configured partitions arethe sameSkip unnecesary linear search of job list if submitted jobs have the same priority2 patches recently developped (Bill Brophy), not yet verified.Back.29 / 34
Appendix - ReferencesThroughput ExperimentsBack.30 / 34
Appendix - ReferencesEnergy Reductions Tradeoffs1.0CDF on Wait time with 89.62% of system utilization and NAS BT benchmark0.60.40.20.0Jobs [%]0.8GREENNORMAL0200400600800Wait time [s]Back.31 / 34
Appendix - ReferencesNetwork Topology Aware Placement EvaluationsTopology aware placement SLURM: 230 ESP jobs upon 64node(biCPU-quadCORE) clusterNO-TOPOLOGY-Default(ESP-Efficiency 82.7%)withTOPOLOGY-AwarePlugin(ESP-Efficiency cy 77.8%)100Jobs Percentages80604020012Number of used islands332 / 34
Appendix - ReferencesArchive of Real Parallel WorkloadsWorkload TracesLANL O2KOSC ClusterSDSC BLUEHPC2NDAS2 fs0DAS2 fs1DAS2 fs2DAS2 fs3DAS2 fs4SDSC DataStarLPC EGEELLNL uBGLLLNL AtlasLLNL ThunderFromNov 1999Jan 2000Apr 2000Jul 2002Jan 2003Jan 2003Jan 2003Jan 2003Feb 2003Mar 2004Aug 2004Nov 2006Nov 2006Jan 2007UntilApr 2000Nov 2001Jan 2003Jan 2006Jan 2004Dec 2003Dec 2003Dec 2003Dec 2003Apr 2005May 2005Jun 2007Jun 2007Jun 2365264404605762132283Utilization 4.187.6Table: Logs of Real Parallel Workloads from Production Systems [Feitelson’s Logs load/logs.html]Back.33 / 34
Appendix - ReferencesESP BenchmarkJob TypeABCDEFGHIJKLMZTotalFraction of Job Sizerelative to total 01.00000Job size for a 512corescluster (in cores)Least number ofneeded islandsCount of the numberof total jobsPercentageof job instanceTarget Run 346163151846133410671432725487366187100Table: ESP benchmark characteristics for 512 cores cluster [Kramer, William TC; ’PERCU: AHolistic Method for Evaluating High Performance Computing Systems]Back.34 / 34
with SLURM backfill scheduler (ESP Efficiency 83.7%) Instant Utilization Job Start Time Impulse 0 10 20 30 40 50 60 70 0 2000 4000 6000 8000 10000 12000 14000 16000 Resources (cores) Time (sec) System Utilization with ESP Benchmark upon a cluster of 8 nodes (dualCPU-quadCore) with SLURM backfill preemption scheduler (ESP Efficiency 84.3%)