Transcription
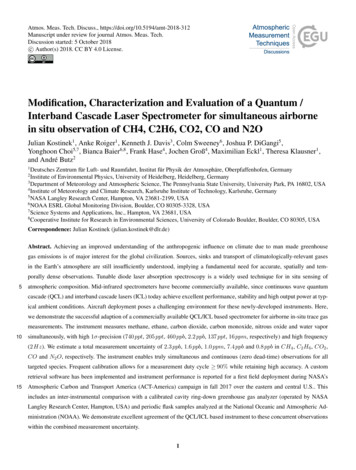
Atmos. Meas. Tech. Discuss., https://doi.org/10.5194/amt-2018-312Manuscript under review for journal Atmos. Meas. Tech.Discussion started: 5 October 2018c Author(s) 2018. CC BY 4.0 License.Modification, Characterization and Evaluation of a Quantum /Interband Cascade Laser Spectrometer for simultaneous airbornein situ observation of CH4, C2H6, CO2, CO and N2OJulian Kostinek1 , Anke Roiger1 , Kenneth J. Davis3 , Colm Sweeney6 , Joshua P. DiGangi5 ,Yonghoon Choi5,7 , Bianca Baier6,8 , Frank Hase4 , Jochen Groß4 , Maximilian Eckl1 , Theresa Klausner1 ,and André Butz21Deutsches Zentrum für Luft- und Raumfahrt, Institut für Physik der Atmosphäre, Oberpfaffenhofen, GermanyInstitute of Environmental Physics, University of Heidelberg, Heidelberg, Germany3Department of Meteorology and Atmospheric Science, The Pennsylvania State University, University Park, PA 16802, USA4Institute of Meteorology and Climate Research, Karlsruhe Institute of Technology, Karlsruhe, Germany5NASA Langley Research Center, Hampton, VA 23681-2199, USA6NOAA ESRL Global Monitoring Division, Boulder, CO 80305-3328, USA7Science Systems and Applications, Inc., Hampton, VA 23681, USA8Cooperative Institute for Research in Environmental Sciences, University of Colorado Boulder, Boulder, CO 80305, USA2Correspondence: Julian Kostinek (julian.kostinek@dlr.de)Abstract. Achieving an improved understanding of the anthropogenic influence on climate due to man made greenhousegas emissions is of major interest for the global civilization. Sources, sinks and transport of climatologically-relevant gasesin the Earth’s atmosphere are still insufficiently understood, implying a fundamental need for accurate, spatially and temporally dense observations. Tunable diode laser absorption spectroscopy is a widely used technique for in situ sensing of5atmospheric composition. Mid-infrared spectrometers have become commercially available, since continuous wave quantumcascade (QCL) and interband cascade lasers (ICL) today achieve excellent performance, stability and high output power at typical ambient conditions. Aircraft deployment poses a challenging environment for these newly-developed instruments. Here,we demonstrate the successful adaption of a commercially available QCL/ICL based spectrometer for airborne in-situ trace gasmeasurements. The instrument measures methane, ethane, carbon dioxide, carbon monoxide, nitrous oxide and water vapor10simultaneously, with high 1σ-precision (740 ppt, 205 ppt, 460 ppb, 2.2 ppb, 137 ppt, 16 ppm, respectively) and high frequency(2 Hz). We estimate a total measurement uncertainty of 2.3 ppb, 1.6 ppb, 1.0 ppm, 7.4 ppb and 0.8 ppb in CH4 , C2 H6 , CO2 ,CO and N2 O, respectively. The instrument enables truly simultaneous and continuous (zero dead-time) observations for alltargeted species. Frequent calibration allows for a measurement duty cycle 90% while retaining high accuracy. A customretrieval software has been implemented and instrument performance is reported for a first field deployment during NASA’s15Atmospheric Carbon and Transport America (ACT-America) campaign in fall 2017 over the eastern and central U.S. Thisincludes an inter-instrumental comparison with a calibrated cavity ring-down greenhouse gas analyzer (operated by NASALangley Research Center, Hampton, USA) and periodic flask samples analyzed at the National Oceanic and Atmospheric Administration (NOAA). We demonstrate excellent agreement of the QCL/ICL based instrument to these concurrent observationswithin the combined measurement uncertainty.1
Atmos. Meas. Tech. Discuss., https://doi.org/10.5194/amt-2018-312Manuscript under review for journal Atmos. Meas. Tech.Discussion started: 5 October 2018c Author(s) 2018. CC BY 4.0 License.1IntroductionWith steadily increasing greenhouse gas concentrations in the Earths atmosphere an improved understanding of the anthropogenic influence on climate is of major interest for the global civilization. Globally averaged carbon dioxide (CO2 ) mixingratios have increased by 40% since 1750. Methane (CH4 ) mixing ratios have more than doubled since the pre-industrial era,5where over 60 % of this increase is estimated to be of anthropogenic nature (IPCC, 2014). Nitrous oxide (N2 O) is a stronggreenhouse gas and is expected to remain the most important ozone-depleting anthropogenic impact throughout the 21st century (Ravishankara et al., 2009). Ethane (C2 H6 ) is a powerful tracer commonly used to discriminate between different typesof methane sources (Smith et al. (2015); Barkley et al. (2017); Peischl et al. (2015)) and carbon monoxide (CO) is a markerfor incomplete combustion processes and relates to the formation of tropospheric ozone (Klemm et al., 1996).10Aircraft provide a flexible basis for satisfying the fundamental need for accurate, temporally and spatially dense observationsof these climatologically-relevant gases from local to regional scales. On-board meteorological data acquisition systems allowfor concurrent observations of important atmospheric state variables like the local wind field, which is particularly useful toestimate emission fluxes. Spectroscopic instruments making use of molecular ro-vibrational absorption allow for high temporalcoverage through fast instrument response times (Chen et al., 2010). Some have already been used for airborne research, e.g.15well-established cavity ring-down instruments (O’Shea et al. (2013); Santoni et al. (2014); Cambaliza MOL (2015); Filgeset al. (2015)). With the commercial availability of continuous-wave lasers emitting in the mid infrared (IR) region near ambienttemperature (Capasso (2010); Vurgaftman et al. (2015); Kim et al. (2015), Beck et al. (2002)) several new instrument designshave emerged (McManus et al. (2015); Zellweger et al. (2016)). QCL/ICL based systems exploit several orders of magnitudestronger molecular absorption features in the mid infrared compared to near infrared based cavity ring-down instruments.20Richter et al. (2015) reported on a custom-built QCL spectrometer for simultaneous in-situ detection of formaldehyde (CH2 O)and C2 H6 providing best-in-class detection sensitivities of 40 ppt and 15 ppt, respectively. The custom-built airborne QCLspectrometer described by Catoire et al. (2017) allows for simultaneous observation of CO, CH4 and nitrogen dioxide (N O2 )with in-flight precisions of 0.3 ppb, 5 ppb and 0.3 ppb for a sampling time of 1.6 s. McManus et al. (2011) reported on thedevelopment of a high-sensitivity trace gas instrument based on quantum cascade lasers and astigmatic Herriott cells with25up to 240 m path length. This design is commercially available from AERODYNE RESEARCH INC., Billerica, USA, andallows for simultaneous observation of a multitude of gases, depending on the wavelength of the installed lasers. Unlike manyestablished cavity ring-down instruments measuring different species sequentially, the described spectrometer allows for trulyconcurrent sensing of the selected observables and faster response times. These instruments have already been operated ondifferent research aircraft. Santoni et al. (2014) reported on overall instrument performance for over 500 flight hours. Pitt30et al. (2016) found a strong cabin pressure dependence on retrieved methane mixing ratios. Recently, Gvakharia et al. (2018)described a fast calibration strategy to overcome this cabin pressure dependence.Here, we describe the setup and performance of our flight-proven (over 100 flight hours) airborne QCL/ICL system developedfor simultaneous airborne measurements of CH4 , C2 H6 , CO2 , CO, N2 O and H2 O. Section 2 summarizes the refinementsover the commercial system for use on aircraft. We show that frequent two-point calibration can mitigate cabin pressure de-2
Atmos. Meas. Tech. Discuss., https://doi.org/10.5194/amt-2018-312Manuscript under review for journal Atmos. Meas. Tech.Discussion started: 5 October 2018c Author(s) 2018. CC BY 4.0 License.pendencies. Section 3 describes our custom-built retrieval software developed for tuning the retrieval process to yield optimumoutput. Sections 4 and 5 report on instrument performance in the laboratory and in the field during NASA’s ACT-America fall2017 campaign, respectively, including an inter-instrumental comparison with a calibrated cavity ring-down instrument andperiodically taken flask samples. Section 6 summarizes our findings and concludes the study.52The airborne DLR QCL/ICL spectrometerThe spectrometer system used here builds upon the Dual Laser Trace Gas Monitor, a commercial tunable IR laser diodeabsorption spectrometer (TILDAS) available from AERODYNE RESEARCH INC., Billerica, USA. The basic instrument hasalready been extensively described in McManus et al. (2011). We will therefore only briefly introduce the basic instrumentsetup followed by a description of the refinements required to operate the instrument on research aircraft.102.1Basic instrument setupThe spectrometer is split into an electronics compartment and an optics compartment. The electronics compartment includes anembedded computing system, thermoelectric cooling (TEC) controllers, power supplies, etc. The optics compartment includesthe lasers, the sample cell, the pressure controller and all optical elements.Fig. 1 shows a top-view photograph of the optics compartment. A combination of a continuous wave (CW) QCL and ICL15measures mixing ratios of CH4 , C2 H6 , CO2 , CO, N2 O and H2 O simultaneously by direct absorption spectroscopy. Thesample cell is an astigmatic Herriott cell with approximate physical dimensions of 15cm x 15cm x 50cm (WxHxL) made fromLaser pathLaser #2Laser #1Pressure controllerDetectorSample cellParticle filterFigure 1. Top-down photograph on the optics compartment (left panel). The sample cell made from aluminum along with the pressurecontroller and pressure transducers can be identified in the lower half. The QCL/ICL lasers are mounted inside the blue housings to the leftof the collimating Schwarzschild telescopes in the two black housings. The two detectors are mounted below the silver aluminum cases,housing the pre-amplifiers, on the right. The first detector is used for detecting both lasers after passing through the sample cell. The seconddetector is used for spectral referencing through an auxiliary optical path. The right panel illustrates the rack mounted instrument.3
Atmos. Meas. Tech. Discuss., https://doi.org/10.5194/amt-2018-312Manuscript under review for journal Atmos. Meas. Tech.Discussion started: 5 October 2018c Author(s) 2018. CC BY 4.0 License.aluminum. It provides an effective absorption path length of 204m with a net volume of 2.1 L. Two laser light sources emit inthe mid-IR region, specifically around 3.3 µm for Laser #1 and 4.5 µm for Laser #2. Both lasers are tuned to a specific centerwavelength by adjusting the temperature using Peltier elements directly attached to the laser diodes. Excess heat is removedthrough a liquid cooling/heating circuit (SOLID STATE COOLING SYSTEMS, New York, USA). Operating temperatures are54.7 C for Laser #1 and 1.5 C for Laser #2, respectively. A linear current ramp drives sequential spectral modulation at afixed frequency of 1.5 kHz. Laser #1 is tuned between 2988.520 cm 1 and 2990.625 cm 1 . The second laser is tuned between2227.550 cm 1 and 2228.000 cm 1 . Laser #1 scans over absorption lines of CH4 , C2 H6 and H2 O, the second laser sweepsover N2 O, CO2 and CO lines. Each laser is sampled at 450 spectral points. Acquired spectra are co-added to yield a singleoutput spectrum every half of a second. Before reaching the sample cell, the laser beam travels approximately 1.6m inside the10instrument under ambient conditions. This will be referred to as the open-path of the instrument, which is heavily influencedby variations in cabin pressure, temperature and humidity during airborne operation. After passing through the sample cell,the combined output from both lasers hits a single TEC-cooled detector. A second, identical detector collects radiation fromtwo auxiliary paths. The first auxiliary path contains a small, sealed reference cell filled with CH4 and N2 O. This allowsfor spectral referencing during system startup. The second path introduces an etalon into the beam, allowing for experimental15determination of the laser tuning rate, which relates laser supply current and emitted wavelength.2.2Refinements for airborne operationThe key challenges for a successful deployment on research aircraft are limited space and power, the occurrence of linearand angular accelerations and large pressure, temperature and humidity fluctuations in both cabin and sampled air. Airborneinstrumentation further requires a fast system response time, owing to the rapid movement of aircraft in the atmosphere. The20response time is controlled by the time it takes to completely exchange the air in the sample cell which is driven by the highestachievable volumetric flow rate given a specific pump and sample cell volume.Here, a scroll pump has been chosen to enable a constant sample flow through the sample cell. The lubricant-free scroll pumpruns very smoothly, avoiding injecting large vibrations into the measurement system, yet providing good pumping performancewith a nominal value of 500 liters per minute at standard conditions. This translates to a net flow rate of 25 SLP M when25operating with a cell pressure of 50 hP a. Earlier experience showed that large electrical inrush currents have jeopardizednominal system startup (priv. comm. Stefan Müller, MPI Mainz). The original motor has therefore been exchanged with asynchronous three-phase motor (BAUMUELLER NUERNBERG GMBH, Velbert, Germany). This DC motor provides a ratedpower of 627 W at 28 V DC. By using a digital motor controller the maximum startup current can be limited amongst variousother tuning options. From previous studies the motor is known to emit a considerable amount of heat; a forced airflow provided30by a standard axial fan ensures motor temperatures stay in the rated range.Aircraft deployment requires the entire system to operate with a maximum of 50A at 28V DC. Power consumption of theinstrument is mainly dominated by the pump and the thermoelectric cooling making up more than 3/4 of the total powerrequirement. Both components have been electrically converted without the need for power inverters from 230V AC to 28V DCto increase overall efficiency. The spectrometer and its internal computer are driven by a power inverter.4
Atmos. Meas. Tech. Discuss., https://doi.org/10.5194/amt-2018-312Manuscript under review for journal Atmos. Meas. Tech.Discussion started: 5 October 2018c Author(s) 2018. CC BY 4.0 License.Large parts of the wiring harness have been exchanged from standard PVC cables to aviation-grade fire-resistant wiring.Mandatory electromagnetic compatibility/interference (EMC/EMI) tests have been carried out to comply with Federal AviationAdministration (FAA) regulations. The rack-mounted instrument sums up to a total mass of approx. 115 kg and has been testedto withstand linear accelerations of up to 9g on the aircraft forward axis, 8g on the downward axis, 6g on the upward and 2.25g5sidewards. Due to aircraft certification issues, pure water is used as process fluid for the liquid cooling/heating circuit insteadof the intended propylene glycol / water mixture.A 3/8" inner diameter hose made out of Polytetrafluoroethylene (PTFE) has been chosen for the sample air intake as a compromise between pressure drop across the inlet and to minimize lag time between the inlet and the sample cell. Inside theinstrument and upstream of the sample cell, an aerosol filter holds back particles bigger than 2 µm. The inlet is rear facing,10preventing large particle entrainment and protecting the instrument from liquid water and ice. Owing to the small diameter, theintake flow is inside the turbulent regime at all times (Re 4000).Finally, the sample cell pressure is regulated by means of a fully-configurable pressure controller (BRONKHORST High-TechB.V., Ruurlo, Netherlands). A chip-scale temperature-compensated pressure transducer (Measurement Specialties (Europe),Ltd.) and a humidity sensor (Sensirion AG, Staefa ZH, Switzerland) have been built into the optics compartment, to allow for15monitoring the open path state variables (see section 2.1).2.3In-flight calibration strategyA custom-built calibration system has been implemented as illustrated in Fig. 2. Using mass flow controllers (MFCs, BRONKHORSTHigh-Tech B.V., Ruurlo, Netherlands), two gases can be mixed at arbitrary ratios. The calibration gas mixture has been chosen to resemble "target" gas mixing ratios close to atmospheric ambient conditions. The cylinders have been cross-calibrated20against NOAA standards and are thus traceable to World Meteorological Organization (WMO) standards for the species CH4and CO2 . C2 H6 , CO and N2 O are compared to NOAA flask samples taken during the ACT-America field campaigns, whichare also traceable to WMO standards. We use ultra-pure synthetic air as "zero" gas instead of pure nitrogen (N2 ) to be inaccordance with aircraft safety regulations and because the mixing ratio of synthetic air (79.5% N2 and 20.5% O2 ) is chemically closer to sampled atmospheric air. Our calibration setup allows the net flow rate from the calibration cylinders to be25slightly higher than the sample flow rate, minimizing pressure variations in the sample cell during switchover from normalto calibration sampling. To avoid contamination with cabin air, leak tests have been carried out on a regular basis during theACT-America field campaign.Owing to the high sensitivity of the retrieved mixing ratios to changes in ambient conditions during flights (Gvakharia et al.,2018), calibration cycles are carried out automatically every 5 to 10 minutes. Each cycle consists of a pre-programmed se-30quence of flushing the sample cell with zero gas for 10 seconds followed by another 10 seconds of calibration gas. These timeintervals have been found to be a good compromise between calibration gas cylinder endurance and measurement duty cycle.Furthermore, only a single MFC is active at the time for in-flight calibration, reducing the uncertainty on the calibration gasmixing ratios to the uncertainties on the gas cylinders themselves. Online mixing (only relevant for linearity checks, not forin-flight calibration) adds the uncertainty of the controlled mass flow on top. Measured mixing ratios of all detected species5
Atmos. Meas. Tech. Discuss., https://doi.org/10.5194/amt-2018-312Manuscript under review for journal Atmos. Meas. Tech.Discussion started: 5 October 2018c Author(s) 2018. CC BY 4.0 License.Aircraft DC SourceThermorack 40128VDCCooling fluid circuitGas flowElectric connectionCoolant flowDataElectronics compartmentPower Inverter28VDC – 230VAC 50HzB2um filterEFGHSample inletAA90psigD90psigLow pressure (50mbar)Optics compartmentManual valveAircraft DC Source28VDC20slpmCDC Brushless Controllerp2: 22psigp2: 22psigw/ inrush current limitSample exhaust(aircraft cabin)Cal gas mixZero airUN19561850 ppb CH4500ppb C2H6328ppb N2O500ppb CO400ppm CO2Fill zero airUN100279.5% nitrogen20.5% oxygenA: 1/4in PFA tubingB: 3/8in PFA tubingC: Pressure regulator (2stage)D: Fast-Acting Pressure-Relief Valve AirE: Pressure ControllerF: Mass-Flow ControllerG: Mass-Flow ControllerH: Mass Flow MeterFigure 2. Schematic showing the main components with emphasis on the calibration system. A mass flow meter allows for measuring thesample flow rate. Two reference gases can be mixed at any arbitrary ratio by means of two calibrated mass flow controllers. A 2µm particlefilter upstream of the sample cell avoids cell contamination.settle to an approximately constant value within the first two seconds after switchover from calibration gas to sample air andvice versa. The only exception is water vapor, which is observed to settle after approx. 30 seconds because of its stickiness andbecause the inlet tubing is made out of PTFE. The observed decay in H2 O is different from the decay in other species in that aslow, almost linear decay follows the initial exponential decay, due to remaining water vapor in the inlet tubing and the sample5cell.3Data Retrieval & Post-processingThe standard approach to retrieve dry-air mixing ratios from the Aerodyne QCLS instruments is by making use of the softwaresupplied by the manufacturer (TDLWintel). Here we utilize a custom retrieval software (JFIT) developed to double check theoutput of the TDLWintel software and to enhance the ability of tweaking the retrieval process to yield optimum output.6
Atmos. Meas. Tech. Discuss., https://doi.org/10.5194/amt-2018-312Manuscript under review for journal Atmos. Meas. Tech.Discussion started: 5 October 2018c Author(s) 2018. CC BY 4.0 License.The code is written in plain C . It digests the sample cell pressure and temperature measurements to generate a syntheticspectrum based on line-by-line parameters from the HITRAN2012/HITRAN2016 (Rothman et al. (2013); Gordon et al. (2017))database using a conventional Voigt profile approach. Ethane line-by-line data have been taken from high-resolution FTIRspectra due to deficiencies in the HITRAN data for this particular species/wavenumber combination (Harrison et al., 2010).5The computation of the Voigt profile has been adopted from Abrarov and Quine (2015) for improved efficiency. Our retrievalcode differs from the TDLWintel approach in the determination of the spectral baseline, the handling of shift parameters andopen path water absorption. TDLWintels spectral baseline is defined by manually positioned markers and shift parameters arespecific for each species and coupled to a fingerprint absorption line (see Fig. 4). Determination of open path water absorptionis only possible at one fixed pressure value.10A typical raw spectral output, as saved by the instrument in binary format is illustrated in Fig. 3. The two consecutive laserscans are clearly visible. On the left side, Laser #1 sweeps between 2988.520 cm 1 and 2990.625 cm 1 and hence, overabsorption features of CH4 , C2 H6 and H2 O. The right side corresponds to the wavelength range of Laser #2 (2227.550 cm 1to 2228.000 cm 1 ) and includes absorption features of N2 O, CO and CO2 . After the lasers have scanned their full range, bothlasers are completely turned off to allow for the determination of the detector zero-intensity offset. The abscissa correspondsto the individual sampling points, which can be converted to spectral units using the known laser tuning rate. The flat sections3000Nitrous oxide2000Carbon monoxide1000Signal [ADU]15Water vapor0Carbon dioxide-1000-2000-3000Nitrous oxide-4000MethaneEthaneBoth lasers off-500001002003004005006007008009001000Channel #Figure 3. A typical raw spectrum as recorded in binary format by the instrument. Arrows have been added to ease identification of theobserved chemical species. Channel numbers on the abscissa can be converted to spectral units using the laser tuning rate. The intensityoffset can be corrected by shifting the entire spectrum to yield zero intensity when lasers are turned off.7
Atmos. Meas. Tech. Discuss., https://doi.org/10.5194/amt-2018-312Manuscript under review for journal Atmos. Meas. Tech.Discussion started: 5 October 2018c Author(s) 2018. CC BY 4.0 License.- Fit baseline using user-defined markers- Split spectral range into user-defined regions containing x species- Open path fits only possible for a static ambient pressureTDLWintel- Fit baseline and species contained in a micro window simultaneously without markers- Use data from auxilliary sensor to include open path water vapor absorptionJFIT30002900water @ amb. pressI [adu]28002700260025002400Water @ cell idualTDLWintelFingerprint0JFITShift #1Fingerprint- species-specific shift parameters using the first line as fingerprint5-5Shift #1-100Shift #2Shift #4Shift #3- shift parametersdistributedalong150the spectralaxis (species50100200250independent)Shift #2Shift #5300350Figure 4. Schematic depicting the handling of spectral shift parameters and baseline modeling. The spectral baseline is fitted as a polynomialtogether with absorption features over the entire micro window. Shift parameters have been implemented in a species-independent way.Open-path water is also included in the model.of the spectrum with no molecular absorption, are considered to represent the spectral baseline. The shape of this baseline ismainly controlled by laser characteristics, the detector response function and optical properties of the installed mirrors andwindows inside the instrument.The spectrum is broken down into 3 micro windows for the retrieval process (see Fig. 5). These were chosen based on best5overall performance found in retrieval tests and named after the chemical species included. A synthetic spectrum, including apolynomial representing the spectral baseline, is generated and fitted using an unbounded Levenberg-Marquardt least-squaresalgorithm (Marquardt, 1963). The degree of the background-fitting polynomial has been adjusted empirically for each microwindow. Species independent shift parameters have been included allowing individual absorption features to freely move onthe spectral axis. Special care has been taken to group weak and strong absorption features together in a single shift parameter,10to provide sufficient certainty on their spectral positions. In other words, not every absorption line has its own shift parameter,but they are grouped as schematically shown in Fig. 4. As a result, only 5 shift parameters are included although the syntheticspectrum in Fig. 4 is composed of more than 20 individual lines. When the absorptivity does not yield enough certainty to ensureproper determination of the shift parameters for a single spectrum, the shift variables are held constant at the mean over its last10 values. If another species in the relevant micro window allows for a proper determination of the spectral position, remaining15shift parameters are coupled to those with enough certainty. This strategy allows to properly model frequency changes betweenconsecutive measurements. Typical shift parameters for ground-based operation are given in Fig. 8 for the CH4 -H2 O and8
Atmos. Meas. Tech. Discuss., https://doi.org/10.5194/amt-2018-312Manuscript under review for journal Atmos. Meas. Tech.Discussion started: 5 October 2018c Author(s) 2018. CC BY 4.0 License.CO2 -CO-N2 O micro windows. Pressure, humidity and temperature data obtained from within the optics compartment areused to model H2 O absorption at cabin pressure in the open-path region.The CH4 -H2 O micro window covers almost the entire set of spectral features covered with Laser #1 except for the C2 H6absorption features. The spectral baseline is modeled as a third-order polynomial over the full range of the micro window. Atypical spectrum including fit is depicted in Fig. 5 along with typical spectra for the other two micro windows.The C2 H6 micro window includes absorption features of CH4 and C2 H6 . The main challenge of retrieving precise C2 H6mixing ratios arises from its very low background concentration in the atmosphere (approx. 1.05 ppb in the northern hemisphereCH4-H 2O enumbers [cm-1 ]10 -34Residual5SpectrumFit0.920.5ResidualC2H6 microwindow1.01Optical depthOptical depth10.95010 .3Wavenumbers [cm-1 ]20-2-5-4CO2-CO-N2O microwindow10.95Optical 2227.62227.6510 -32227.72227.752227.82227.852227.9Wavenumbers [cm-1 ]10-1-2Figure 5. Typical, normalized spectra for each micro window including fits and associated residuals. The first micro window (top left)includes CH4 and H2 O absorption features. The top right micro window depicts C2 H6 absorption. The lower left spectrum shows CO,CO2 and N2 O absorption.9
Atmos. Meas. Tech. Discuss., https://doi.org/10.5194/amt-2018-312Manuscript under review for journal Atmos. Meas. Tech.Discussion started: 5 October 2018c Author(s) 2018. CC BY 4.0 License.(Simpson et al., 2012)). A single adjacent CH4 line has been included in order to obtain good C2 H6 data even under thesechallenging conditions. In this case, the weak CH4 absorption is not modeled as a free parameter and is hence not used forretrieving the CH4 mixing ratio, but for localizing the spectral position / shift parameter of the C2 H6 absorption feature in theabsence of a clear C2 H6 signal. The CH4 mixing ratios are fixed to the values determined from the previous micro window.5Using this approach, we found a clear improvement in the C2 H6 data quality including a higher precision and the absence ofdiscontinuities. The associated spectral baseline is modeled as a second-order polynomial.The CO2 -CO-N2 O micro window covers the entire second laser and is the most complex spectral scene. It includes severaloverlapping absorption features making the retrieval of mixing ratios of the targeted species challenging. As illustrated in Fig.5, a single CO2 absorption line is surrounded by two N2 O lines. The CO line is directly adjacent to one of the N2 O lines. This10results in comparatively large signal noise and deteriorated accuracy on the retrieved mixing ratios due to crosstalk betweenthe N2 O, CO and CO2 absorption lines. However, the spectral range includes another N2 O line at 2227.843 cm 1 , whichis slightly stronger than the other two (see Fig. 5). Our approach is to fix the mixing ratios of the first two N2 O lines to thestronger third one, in order to reduce the uncertainty on retrieved N2 O and hence the noise on the CO2 and CO retrieval. TheCO2 absorption line originates from a molecular transition of the1513C 16 O2 carbon dioxide isotopo
Here, we describe the setup and performance of our ight-proven (over 100 ight hours) airborne QCL/ICL system developed for simultaneous airborne measurements of CH 4, C 2 H 6, CO 2, CO , N 2 O and H 2 O . Section 2 summarizes the renements over the commercial system for use on aircraft. We show that frequent two-point calibration can mitigate .