Transcription
A Probabilistic Graphical Model Foundation forEnabling Predictive Digital Twins at ScaleMichael G. Kapteyn1 , Jacob V.R. Pretorius2 , and Karen E. Willcox3 1Department of Aeronautics and Astronautics, Massachusetts Institute of Technology, Cambridge, MA 02139, United States23The Jessara Group, Austin, TX 78704, United StatesOden Institute for Computational Engineering and Sciences, University of Texas at Austin, Austin, TX 78712, United StatesAbstractplementations that require considerable deployment resourcesand a high level of expertise. To move from the one-off digital twin to accessible robust digital twin implementations atscale requires a unifying mathematical foundation. This paper proposes such a foundation by drawing on the theoreticalfoundations and computational techniques of dynamical systems theory and probabilistic graphical models. The result isa mathematical model for what comprises a digital twin andfor how a digital twin evolves and interacts with its associatedphysical asset. Specifically, we propose a probabilistic graphical model of a digital twin and its associated physical asset,providing a principled mathematical foundation for creating,leveraging, and studying digital twins.Digital twins have garnered attention in a wide range of applications [2]. Structural digital twins have shown promise invirtual health monitoring, certification, and predictive maintenance [3, 4, 5, 6]. In healthcare, digital twins of humanbeings promise to advance medical assessment, diagnosis, personalized treatment, and in-silico drug testing [7, 8, 9]. Similarly, digital twins of individual students offer a path to personalized education [10]. At a larger scale, smart cities enabled by digital twins and Internet of Things (IoT) devicespromise to revolutionize urban planning, resource allocation,sustainability and traffic optimization [11]. Although eachof these applications has its own unique requirements, challenges, and desired outcomes, the mathematical foundationwe develop in this work focuses on a common thread thatruns throughout: dynamically updated asset-specific computational models integrated within the data-driven analysisand decision-making feedback loop.We adopt a view of the physical asset and its digital twin astwo coupled dynamical systems, evolving over time throughtheir respective state spaces as shown in Figure 1. The digital twin acquires and assimilates observational data from theasset (e.g., data from sensors or manual inspections) and usesthis information to continually update its internal models sothat they reflect the evolving physical system. This synergistic multi-way coupling between the physical system, thedata collection, the computational models, and the decisionmaking process draws on the dynamic data driven applications systems (DDDAS) paradigm [12, 13]. The digital twincan then use these up-to-date internal models for analysis,prediction, optimization, and control of the physical system.Motivated by this conceptual model, we develop a proba-A unifying mathematical formulation is needed to move fromone-off digital twins built through custom implementationsto robust digital twin implementations at scale. This workproposes a probabilistic graphical model as a formal mathematical representation of a digital twin and its associatedphysical asset. We create an abstraction of the asset-twinsystem as a set of coupled dynamical systems, evolving overtime through their respective state-spaces and interactingvia observed data and control inputs. The formal definitionof this coupled system as a probabilistic graphical modelenables us to draw upon well-established theory and methodsfrom Bayesian statistics, dynamical systems, and controltheory. The declarative and general nature of the proposeddigital twin model make it rigorous yet flexible, enabling itsapplication at scale in a diverse range of application areas.We demonstrate how the model is instantiated to enable astructural digital twin of an unmanned aerial vehicle (UAV).The digital twin is calibrated using experimental data froma physical UAV asset. Its use in dynamic decision makingis then illustrated in a synthetic example where the UAVundergoes an in-flight damage event and the digital twinis dynamically updated using sensor data. The graphicalmodel foundation ensures that the digital twin calibrationand updating process is principled, unified, and able to scaleto an entire fleet of digital twins.Keywords– Digital Twin, Uncertainty Quantification,Probabilistic Graphical Model, Self-Aware VehicleIntroductionA digital twin is a computational model (or a set of coupledcomputational models) that evolves over time to persistentlyrepresent the structure, behavior, and context of a uniquephysical asset such as a component, system, or process [1].The digital twin paradigm has seen significant interest acrossa range of application areas as a way to construct, manage,and leverage state-of-the-art computational models and datadriven learning. Digital twins underpin intelligent automation by supporting data-driven decision making and enablingasset-specific analysis. Despite this surge in interest, stateof-the-art digital twins are largely the result of custom im Correspondingauthor (kwillcox@oden.utexas.edu).1
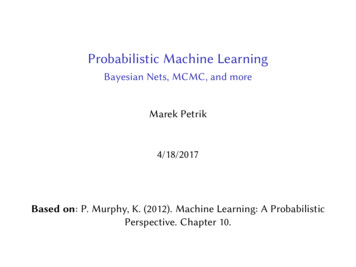
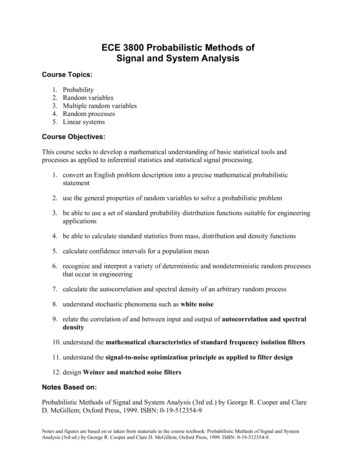
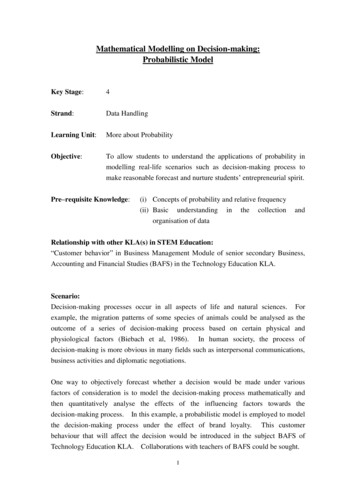
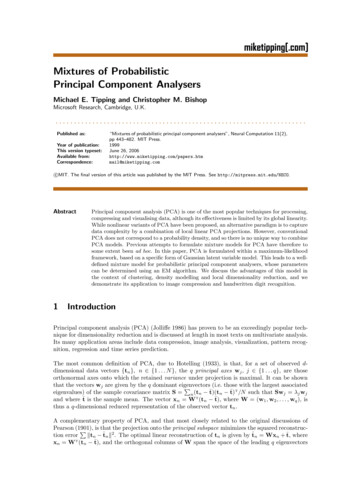
state variable 23) The updated digital twin enablesin-depth analysis of the asset andprediction of future state evolution1) The state of the physical assetevolves over time4) Control inputs informed by theupdated digital twin steer thephysical asset to a favorable state2) The digital twin assimilatesobservational data and updates itsstate to mimic the physical twinphysical asset statedigital twin stateobservational datacontrol inputsstate variable 1Figure 1: Conceptual model of a physical asset and its digital twin, evolving over time through their respective state spaces.These two dynamical systems are tightly coupled: The digital twin uses observational data to estimate the state of thephysical twin, so that it can, in turn, provide optimal control inputs that steer the physical asset to favorable states, whilebalancing other factors like maintaining observability over the asset state and minimizing control costs.This motivating example has specific application in a number of settings. One is urban air mobility and autonomouspackage delivery, where UAVs operate in urban environmentsand are subject to damage. In order to ensure a safe, robust, reliable and scalable system, these vehicles must beequipped with advanced sensing, inference, and decision capabilities that continually monitor and react to the vehicle’schanging structural state. The vehicle uses this capabilityto decide whether to perform more aggressive maneuvers orfall back to more conservative maneuvers in order to minimize further damage or degradation. Another application ishypersonic vehicles, which operate in extreme environmentsand thus undergo continual degradation of their structuralcondition. More generally, the structural digital twin illustrative example is highly relevant to other applications wherethe condition of the system changes over time due to environmental influences and/or operating wear and tear. Examplesinclude wind turbines, nuclear reactors, gas turbine engines,and civil infrastructure such as buildings and bridges.bilistic graphical model [14] that defines the elements comprising this coupled dynamical system, and mathematicallydescribes the interactions that need to be modeled in the digital twin. Our model draws inspiration from classical agentbased models such as the partially observable Markov decisionprocess [15], but includes important features that are uniqueto the digital twin context. The graphical model formalismprovides a firm foundation from which to draw ideas and techniques from uncertainty quantification, control theory, decision theory, artificial intelligence, and data-driven modelingin order to carry out complex tasks such as data assimilation, state estimation, prediction, planning, and learning, allof which are required to realize the full potential of a digitaltwin.Throughout this paper we demonstrate our proposedgraphical model using a motivating application: the development of a structural digital twin of an unmanned aerialvehicle (UAV). In particular, we demonstrate the applicationof the probabilistic graphical model to two phases in the assetlifecycle. First, we show how experimental calibration can beused to transform a baseline structural model into a uniquedigital twin tailored to the characteristics of a particular asset. Here the proposed graphical model serves as a rigorousframework for deciding which calibration experiments to perform, leveraging the resulting experimental data for principledmodel calibration, and evaluating the performance of the calibrated digital twin. Next, we demonstrate how the calibratedstructural digital twin enters operation alongside the physicalasset where it assimilates sensed structural data to updateits internal models of the vehicle structure. The dynamicallyupdated models are used for analysis and evaluation of thevehicle’s structural health and for decision-making. Formulation of this process via the proposed graphical model enablesend-to-end uncertainty quantification and principled analysis,prediction, and decision-making.ResultsWe present three key results: the abstraction of a digital twininto a state-space formulation that is a basis for mathematicalmodeling, the realization of a digital twin mathematical modelin the form of a dynamic decision network, and an applicationof the proposed model for the evolution of a UAV structuraldigital twin.A Mathematical Abstraction of the AssetTwin SystemThe first main result of this work is the abstraction of a digital twin and its associated physical asset into a representationcomprised of six key quantities, defined in Figure 2. We pro2
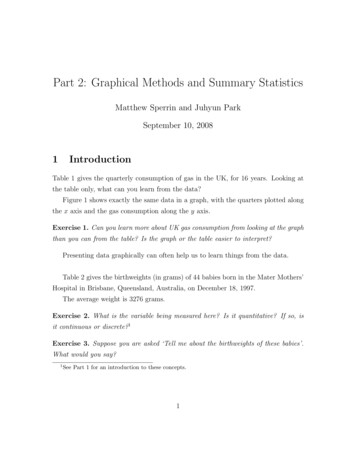
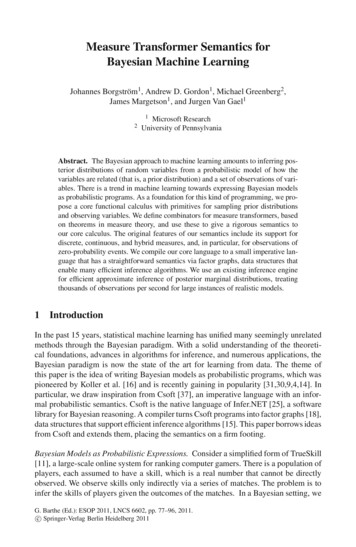
Control inputs, :Actions or decisions thatinfluence the physical assetIn-flight maneuvers, maintenance orinspection decisions, sensor installationDigital State, :Parameters (model inputs) thatdefine the computational modelscomprising the digital twinSkin thickness, crack length,delamination extentlsicaPhyGeometry, structural parameters,boundary conditionsitDigReward, :Quantifies overallperformance of theasset-twin systemMission success, fuel burn,maintenance or inspection costsPhysical State, :Parametrized state of thephysical assetalObservational data, :Available information describingthe state of the physical assetQuantities of Interest, :Quantities describing the asset,estimated via model outputsMeasured strain or accelerometer data,inspection data, flight logsStress, strain, displacement fields,failure stress, remaining useful lifeFigure 2: Our abstraction of a digital twin and its associated physical asset. Specific examples from the self-aware aerialvehicle application are provided but the quantities themselves are abstract and can be used to model asset-twin systems inany application area.A Probabilistic Graphical Model for DigitalTwinsvide specific examples from the self-aware UAV applicationbut emphasize that this abstraction can be applied to digitaltwins from any discipline and application, thus providing aunifying framework for describing and defining digital twins.Hence, the abstraction forms the basis for defining a generalmathematical model for an asset-twin system, such as theprobabilistic graphical model proposed in the following subsection.The proposed abstraction of the digital twin leads to the second main result of this work, a probabilistic graphical modelof a digital twin and its associated physical asset. This graphical model represents the structure in an asset-twin system byencoding the interaction and evolution of quantities definedin Figure 2. In particular, the model encodes the end-to-enddigital twin data-to-decisions flow, from sensing through inference and assimilation to action.Formally, the model presented here is a dynamic decisionnetwork: a dynamic Bayesian network with the addition ofdecision nodes. Figure 3 shows the graph unrolled from theinitial timestep, t 0, to the current timestep, t tc , andinto the future to the prediction horizon, t tp . Nodesin the graph are random variables representing each quantity at discrete points in time. Throughout this section weuse upper-case letters to denote random variables, with thecorresponding lower-case letter denoting a value of the random variable. For example, the digital state at timestep t isestimated probabilistically by defining the random variablesDt p(dt ). Edges in the graph represent dependencies between variables, encoded via either a conditional probabilitydensity or a deterministic function.This graphical model serves as a mathematical counterpartto the conceptual model illustrated in Figure 1. The upperleft-to-right path in Figure 3 represents the time evolution ofthe physical asset state, represented by the random variablesSt p(st ), while the lower path represents the time evolu-Note the key differences between the physical and digital states. The physical state space encapsulates variationin the state of the asset and could thus be a complex highdimensional space. The physical state is typically not fully observable. Together, these attributes make the physical stategenerally intractable to model directly. The digital state isdefined as a set of parameters that characterize the modelscomprising the digital twin. The digital state is updated asthe asset evolves over time or as new information about the asset becomes available. In defining the digital state, one mustconsider what information is sufficient to support the use caseat hand. A well-designed digital twin should be comprised ofmodels that provide a sufficiently complex digital state space,capturing variation in the physical asset that is relevant fordiagnosis, prediction, and decision-making in the applicationof interest. On the other hand, the digital state space shouldbe simple enough to enable tractable estimation of the digitalstate, even when only partially observable. For this reason,the digital state space will generally be only a subset of thephysical state space.3
Physical SpaceDigital SpaceFigure 3: Our approach results in a dynamic decision network that mathematically represents a physical asset and its digitaltwin. Nodes in the graph shown with bold outlines are observed quantities (i.e., they are assigned a deterministic value),while other quantities are estimated (typically represented by a probability distribution). Directed edges represent conditionaldependence. Here the control nodes are decision nodes.tities of interest, Qt , and rewards, Rt , conditioned on theobserved variables, namely the data, Ot ot , and enactedcontrol inputs, Ut ut , for all timesteps up until the currenttime, t 0, ., tc , according to the structure of the proposedgraphical model (Figure 3) astion of the digital state, represented by the random variablesDt . The graphical model encodes the tight two-way couplingbetween an asset and its digital twin. Information flows fromthe physical asset to the digital twin in the form of observational data, ot , which are assimilated in order to updatethe digital state. Using the updated digital state, the modelscomprising the digital twin are used to predict quantities ofinterest, modeled at time t as Qt p(qt ). Information flowsfrom the digital twin back to the physical twin in the form ofcontrol inputs, ut , which are informed by the digital state andcomputed quantities of interest. These quantities all influencethe reward for the timestep, Rt p(rt ).p(D0 , .Dtc , Q0 , ., Qtc , R0 , ., Rtc o0 , ., otc , u0 , ., utc )tc hiYevaluation φupdateφQoI,(1)tt φtt 0whereφupdate p(Dt Dt 1 , Ut 1 ut 1 , Ot ot ),tNote that the graphical model depicted in Figure 3 has bothobservations and control inputs occurring once per timestep,with observations occurring prior to control inputs. Thestructure of the graph (and the resulting algorithms we discuss throughout this work) can easily be adapted to situationsin which this is not the case via a topological reorganizationof the graph. For example, in the application presented in thefollowing section, control inputs are issued first, with observational data acquired as a result.φQoI p(Qt Dt ),tφevaluationt p(Rt Dt , Qt , Ut ut , Ot ot ).(2)(3)(4)Prediction is achieved by extending this belief state to includedigital state, quantity of interest, and reward variables up until the chosen prediction horizon, tp (see the Methods sectionfor details).The factored representation (1) serves two purposes.Firstly, the factors denoted φ and defined in (2)–(4) are conditional probability distributions that reveal particular interactions that must be characterized by the computational modelscomprising the digital twin. Secondly, as we demonstrate inthe following section, the factorization serves as a foundationfor deriving efficient sequential Bayesian inference algorithmsthat leverage the modeled interactions in order to enable keydigital twin capabilities such as asset monitoring, prediction,and optimization.Note that the proposed probabilistic graphical model doesnot restrict the nature of the models comprising the digitaltwin. Each of these models could be physics-based (e.g., models based on discretized partial differential equations), data-The proposed graphical model (Figure 3) is sparsely connected in order to encode a set of known or assumed conditional independencies. In particular, the model encodes aMarkov assumption for both physical and digital states, andthe assumption that the physical state is only observable indirectly via data. Note that nodes in the graph can in generalrepresent multivariate random variables, for example the digital state vector may consist of many parameters. In this casethe graphical model does not specify independence structurebetween digital state parameters. The conditional independence structure defined by the graph allows us to factorizejoint distributions over variables in the model. For example,we can factorize our belief about the digital state, Dt , quan4
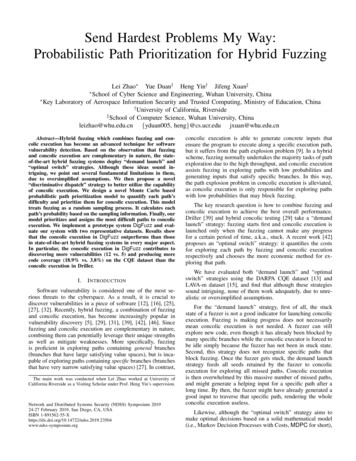
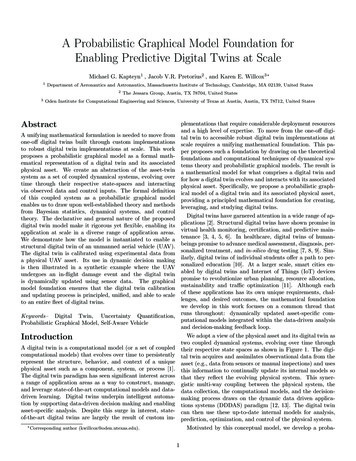
driven (e.g., neural networks trained on historical or experimental data), or rule-based (e.g., state-transitions in a finitestate automaton). Note also that these models need not bespecific to a single physical asset. Indeed, the models may beshared across a large fleet of similar assets, each with a digital state governing the asset-specific parameters used in thesemodels. This enables efficient, centralized data and modelmanagement, and also enables each asset in the fleet to contribute to the continual improvement and enrichment of models by providing performance data relevant to a particular partof the state space.sor data enables in-flight structural health monitoring, a capability which in turn enables dynamic health-aware missionplanning, as well as simulation-based evaluation, certification,predictive maintenance, and optimized operations of the fleet.In this example application we define the physical state,S, of the UAV asset to be its structural state. The physicalstate-space thus encompasses any conceivable structural variation between UAV assets, such as differences in geometryand material or structural properties. While many UAVs inthe fleet share a common design, variation in material properties and manufacturing processes makes no two physical assetstruly identical. Furthermore, once the asset enters operation,the physical state begins to evolve over time, for exampledue to maintenance events, damage, or gradual degradation.We seek to capture this variation by creating, calibrating,and dynamically evolving a structural digital twin for eachunique UAV asset. We here present a summary of our formulation and results. Details on the physical asset, experimentalsetup, finite element structural models comprising the digitaltwin, and a full mathematical formulation are described inthe Methods section.For this application the digital state is defined to be: g } vector of geometric parameters e } Young’s modulus scale factor m } vector of added point masses (5)d : α Rayleigh damping coefficients β z } vector of structural health parametersDemonstration: Data-driven calibration andevolution of a UAV structural digital twinWe instantiate the proposed approach for the structural digital twin of a UAV, with the target use case of managingand optimizing a large fleet of UAV assets (e.g., a fleet ofautonomous package delivery vehicles). In particular, wedemonstrate how the probabilistic graphical model can beused for the calibration, tailoring, and dynamic updating ofcomputational models within the digital twin, so that they accurately reflect the current characteristics of a unique physicalasset.We focus on two key stages in the lifecycle of any digitaltwin. First, we consider the initial calibration of the digital twin to an as-manufactured asset. While this type ofexperimental model calibration is commonplace throughoutengineering, we here demonstrate how formulating the calibration process using our proposed probabilistic graphicalmodel (Figure 3) ensures that the process is principled, scalable, and repeatable across the entire fleet of UAVs. Next,we show how the same probabilistic graphical model naturally extends in time beyond calibration and into the servicelife of each UAV. In our example, the calibrated UAV digitaltwin enables predictive structural simulation of the airframe.Dynamically evolving the digital twin based on incoming sen-This digital state comprises parameters of the UAV structuralmodels that account for differences between UAV assets dueto variability in materials, manufacturing, or operational history (geometry, g, Young’s modulus scale factor, e, and otherstructural health parameters, z), parameters that representunmodeled details of the UAV (the point masses m accountfor physical UAV components that are not represented in thefinite element model), and parameters that represent rial properties,calibrate massand damping,Calibrateddigital twindynamic estimation ofstructural health,Dynamicdata-drivendigital twinFigure 4: Evolution of a UAV structural digital twin using the probabilistic graphical model formulation.5
eled physics (the Rayleigh damping coefficients are widelyused in engineering to approximately model internal structural damping). By focusing on this set of parameters (whilefixing all other model parameters at a nominal value) we obtain a digital twin that is tractable to calibrate and dynamically evolve, while sufficiently capturing the key differences instructural response between UAV assets. Figure 4 presents asummary of the probabilistic graphical model formulation forthis application.g [l, croot , ctip ], where l is the wing semi-span, croot isthe chord length at the root, and ctip is the chord lengthat the tip. The control input, u1 , for this step is to physically measure each geometric parameter, producing measurements ĝ. Since these measurements are able to be taken accurately, the posterior uncertainty in the geometric parameters is negligibly small. Thus, the posterior distribution,p(D1 O1 o1 , U1 u1 ), deterministically sets the geometric parameters to their measured values. The reward functionfor this calibration step measures the difference between priorResults: Calibration Phase We first consider the cali- and posterior estimates of each geometric parameter. Thebration phase in which the digital state parameters, and thus chosen norm could weight each parameter by its manufacturthe computational models within the digital twin, are tailored ing tolerance, thus providing an overall measure of how wellso that they accurately reflect the unique characteristics of an this particular UAV has been manufactured.At step t 2 we calibrate the static load-displacement beas-manufactured physical asset. Each digital twin begins thecalibration process with the same prior belief about the dig- havior of the structural model. In the digital state we updateital state parameters, p(D0 ). This distribution over model e, which is a scale factor applied to the Young’s modulus (bothparameters defines a baseline UAV structural model based on longitudinal and transverse) of the carbon fiber material useddesign specifications, with uncertainty based on the degree in the wing skin. This scale factor allows us to adjust theof variability or confidence in each parameter. In the cali- computational model to account for material or manufacturbration phase, the timesteps, t, correspond to steps in the ing variation in the wing skin. The control input, u2 , is a decicalibration process. At each step, t 1, 2, 3, we select an sion to perform a static load-displacement test on the physicalaction Ut ut , which corresponds to conducting a specific UAV asset. The observed data are a set of applied tip-loadexperiment on the physical UAV asset. This experiment gen- and measured tip-displacement pairs, o2 {fˆ, x̂}, as shown inerates data, ot , which inform an updated belief about the Figure 5 (left). Uncertainty in the applied load, fˆ, and meadigital state, p(Dt Ot ot ). Specifically, each experiment sured tip-displacement measurement, x̂, are both modeled bycalibrates a subset of parameters in the digital state, and is Gaussian distributions, with 95% credible interval of widthsdesigned to be conditioned only on previously calibrated pa- of 20g and 1mm respectively. Using this observed data, werameters, with no dependence on parameters to be calibrated perform a Bayesian update on our prior estimate in order toin a future step. Using this updated distribution of param- produce the posterior estimate p(D2 D1 , O2 o2 , U2 u2 ),eters in the computational model (described in the Methods as shown in Figure 5 (center). We see that the posteriorsection), the digital twin is used to compute quantities of mean value for this scale factor is 1.0073, indicating that theinterest, p(Qt Dt , Ot ot ), which describe the structural Young’s modulus of carbon fiber in the digital twin modelresponse of the UAV. We evaluate the success of the cali- should be increased by 0.73% to better match this particubration procedure by estimating the reward, p(Rt ), at each lar physical UAV asset. The uncertainty in this parameter isstage. Here, values that are experimentally measured or de- also greatly reduced post-calibration. The quantity of interestrived from experimental data are denoted as hat variables, for this step is a computational estimate of the coefficient ofwhile the corresponding variable without a hat represents a proportionality between tip load and tip displacement, as escomputational estimate produced by digital twin models. We timated by the digital twin models. The prior and posterioruse braces ({·}) to denote that there is an ensemble of data distributions of this quantity of interest are shown in Figgenerated by repeated trials of an experiment.ure 5 (right). We evaluate the success of this calibration stepAt step t 1 we calibrate the geometric parameters, by defining a reward that measures the reduction (achieved4010tip force,[N]10prior5likelihoodposteriortip force,[N]posterior520prior(shown for eachmeasurement)004812observed tip displacement,16[mm]000.81Young’s modulus scale factor,1.2[-]04812predicted tip displacement,16[mm]Figure 5: Numerical results for the second calibration step (t 2). Left: Observational data, o2 . Center: Prior and posteriorestimates of the component of the digital state, D2 , updated at this step. Right: Prior and posterior distributions of thequantity of interest, Q2 , for this step.6
[mm][mm][mm][-][g ][s -1][ s]PriorinformationPosteriorestimateTable 1: Prior and posterior estimates for calibrated entries in the digital state. The first row shows prior informationdefining the initial estimate for each entry in the digital state. The second row shows posterior distributions for each entryin the digital state, which are the result of assimilating experimental data acquired via calibration experiments.through calibration) in the variance of the random variablerepresenting our knowledge of the scale factor e. As we willlater see, this is of interest since variance in the Young’s modulus scale factor e represents model uncertainty that limits theability of the digital twin to perform data assimilation duringthe operational phase.Results: Operational Phase Next we extend the probabilistic graphical model to an operational phase in whichthe calibrated digital twin is deployed alongside the UAV. Todemonstrate this application of the graphical model we simulate a demonstrative UAV mission consisting of successivelevel turns. This is an adaptation of the mission consideredin a prior work [16]. It illustrates how the proposed graphical model formulation permits us to naturally account foruncertainty from the calibration phase, as well as extend thedigital twin capability to include planning, prediction, andevaluation.In this phase, the timesteps t 4, 5, . . . correspond topoints in time during the UAV’s mission. We fix the firstfive calibrated entries of the digital state (5) and dynamicallyestimate the remaining structural health parameters, z, as thehealth of the UAV evolves over time. In particular, variationin the structural health of the UAV is modeled by introducing two defect regions into the digital twin structural models.These defect regions are on the upper surface of the rightwing, as shown in Figure 4. We then define two structuralhealth parameters within the digital state,In the final step t 3, we calibrate the dynamic response ofthe structural model. This depends on the mass distributionand damping properties of the wing, which are characterizedby the digital state parameters, m, α, and β. In
a physical UAV asset. Its use in dynamic decision making is then illustrated in a synthetic example where the UAV undergoes an in-ight damage event and the digital twin is dynamically updated using sensor data. The graphical model foundation ensures that the digital twin calibration and updating process is principled, uni ed, and able to scale