Transcription
Mathematical Modelling on Decision-making:Probabilistic ModelKey Stage:4Strand:Data HandlingLearning Unit:More about ProbabilityObjective:To allow students to understand the applications of probability inmodelling real-life scenarios such as decision-making process tomake reasonable forecast and nurture students’ entrepreneurial spirit.Pre–requisite Knowledge:(i) Concepts of probability and relative frequency(ii) Basic understanding in the collectionorganisation of dataandRelationship with other KLA(s) in STEM Education:“Customer behavior” in Business Management Module of senior secondary Business,Accounting and Financial Studies (BAFS) in the Technology Education KLA.Scenario:Decision-making processes occur in all aspects of life and natural sciences. Forexample, the migration patterns of some species of animals could be analysed as theoutcome of a series of decision-making process based on certain physical andphysiological factors (Biebach et al, 1986). In human society, the process ofdecision-making is more obvious in many fields such as interpersonal communications,business activities and diplomatic negotiations.One way to objectively forecast whether a decision would be made under variousfactors of consideration is to model the decision-making process mathematically andthen quantitatively analyse the effects of the influencing factors towards thedecision-making process. In this example, a probabilistic model is employed to modelthe decision-making process under the effect of brand loyalty. This customerbehaviour that will affect the decision would be introduced in the subject BAFS ofTechnology Education KLA. Collaborations with teachers of BAFS could be sought.1
The activities to be introduced are based on real-life scenario on the decision-makingprocess of buying a new smartphone. Students are required to apply knowledge inprobability to model the customer behaviour under the effect of brands. They wouldmake use of the probabilistic model to be constructed to make forecasts and suggestionsto increase the market share of a particular brand.Description of the Activities:Activity 11. The teacher may arouse students’ interest with a real-life scenario on thedecision-making process of buying the latest smartphone. In a simplifiedscenario that assumes only two brands (namely Brand I and Brand S) are availablein the market, the teacher may ask students to discuss and comment whether theprobability of following four types of decisions are roughly the same :1. A current Brand I smartphone user will buy a new Brand I smartphone,2. A current Brand I smartphone user will buy a new Brand S smartphone,3. A current Brand S smartphone user will buy a new Brand I smartphone, and4. A current Brand S smartphone user will buy a new Brand S smartphone.2.Then, the teacher may guide students recognise that the different preferences ofthe consumers could be represented by conditional probability, and ask students torepresent the scenario with a tree diagram with suitably defined events.Questions for discussion:1. How is the real-life scenario of buying the latest smartphone simplified in thisactivity? How would the simplification(s) affect the forecast of a person’s decisionusing the above model?2
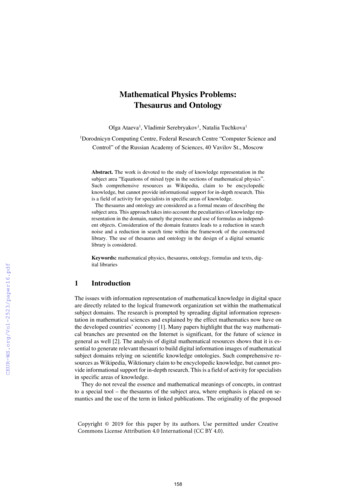
Notes for Teachers:1. Students should construct a tree diagram similar to the one below:Brand of currentsmartphoneBrand of the nextsmartphone to buyBrand IBrand IBrand SBrand IBrand SBrand S2.In this model, the scenario is simplified to two brands only, and assumes allsmartphone users will replace their smartphones. This model cannot forecastwhether a person would decide not to replace his/her smartphone at the moment ofdiscussion.Activity 21. After the tree diagram in Activity 1 is constructed, the teacher may discuss withstudents the limitations and assumptions made so that the model may stand. Forexample, students are expected to figure out that there are more than two brands inthe market, and that not all smartphone users would consider buying the latestsmartphone at the present stage of the discussion.2.The teacher then guides students to discuss how to refine the model so that somelimitations and assumptions of the model in Activity 1 may be relieved, andpresent the refined model with an appropriate tree diagram.Questions for discussion:1. Are there still any limitations, assumptions and constraints in the refinedmathematical model? What are the pros and cons to construct a more complicatedtree diagram to relieve some of the limitations, assumptions and constraints?Notes for Teachers:1. Students are expected to draw tree diagrams similar to the following:3
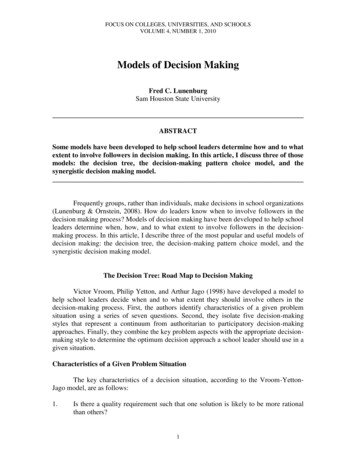
Brand of presentsmartphoneConsider a newsmartphone?Brand of the nextsmartphone to buyBrand IYesBrand SNoOthersBrand IBrand IYesBrand SBrand SNoOthersBrand IYesOthersNo2.Brand SOthersIn the refined model, assumptions such as the new smartphones of both Brand I,Brand S and other brands are available at roughly the same time have been made.The refined model also cannot take care of the fact that behavior of different usersof a certain brand may be very diverse in buying new smartphone. For example,the users of Brand I smartphone using earlier generations may have differentconsiderations from those using the latest available generation. It may not bereasonable to put these two groups of Brand I smartphone users into one category.3.Mathematical modelling is always a simplification of the real-life scenario so thatthe general pictures can be discussed mathematically. An oversimplified modelmay depend on unrealistic assumptions and there would be more limitations andconstraints to use. In other words, it has less practical use in forecasting thereal-life scenario. On the other hand, a complicated model may rely on moreinformation and data to be collected in the real-life scenario, and some data mayeven be not available. Hence, there may be cases that even one can model thereal-life scenario very accurately, the model may not be solvable mathematically.Activity 31. After students have refined their tree diagrams, the teacher may guide them to lookfor the probabilities of each branch in the tree diagram to forecast quantitativelythe probability of a particular decision would be made under different conditions.4
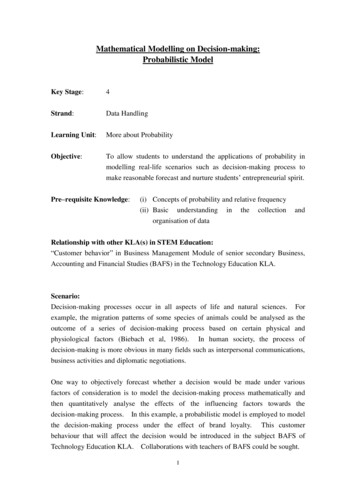
2.The teacher may first ask students to suggest a sensible way to enumerate theprobabilities of different events and hence complete the mathematical model.Normally statistical methods (such as conducting statistical survey) would beproposed. In order to save time for more practices on the manipulations ofconditional probability, the teacher may ask students to search for relevantstatistical reports on customer behaviour in smartphone brand, or provide forstudents the information sheet in the Annex with data drawn from variousmarketing researches accessible in the Internet.3.The teacher then ask students to use the data in the information sheet to completethe tree diagram, and by using the tree diagram, answer the following questions:(a) Which group of smartphone users has greater brand loyalty, users of Brand I orBrand S?(b) Predict the future market share of Brand I and Brand S after their release ofnew models.Notes for Teachers:1. Using the given data, the complete tree diagram in Activity 2 becomes:Brand of presentsmartphoneConsider a newsmartphone?Brand of the nextsmartphone to buyP(I Yes I) 0.92P(Yes I) 0.41YesBrand IP(I) 0.25P(No I) 0.59NoP(S Yes I) 0.07P(O Yes I) 0.01P(I Yes S) 0.1P(S) 0.31P(Yes S) 0.41YesP(No S) 0.59NoP(S Yes S) 0.77Brand IBrand SOthersBrand IBrand SBrand SP(O Yes S) 0.13P(I Yes O) 0.15P(O) 0.44P(Yes O) 0.41YesP(No O) 0.59NoOthersP(S Yes O) 0.2P(O Yes O) 0.65OthersBrand IBrand SOtherswhere I, S and O in the probability expressions represent the events of currently5
using smartphones of Brand I, Brand S and others respectively, whereas I , S and O represent the events of choosing Brand I, Brand S and others respectively whenbuying new smartphones.2.(a)As P (I Yes I) 0.92 0.77 P (S Yes S), users of Brand I hasgreater brand loyalty.(b)After the release of new models, the market share of Brand I and Brand S isexpected to be 0.28 and 0.32 respectively. Calculation for the new marketshare of Brand I is provided below as an illustration:P(I ) P(I) P(Yes I) P(I Yes I) P(I) P(No I) P(S) P(Yes S) P(I Yes S) P(O) P(Yes O) P(I Yes O)P(I ') 0.25 0.41 0.92 0.25 0.59 0.31 0.41 0.1 0.44 0.41 0.15 0.283. Using the inquiry and investigation approach, teacher may discuss with students thelinkage between statistics, probability and making sensible forecast ondecision-making.4. Teacher may collaborate with teachers of BAFS and discuss with students if theywere the marketers of Brand I, what they could do to increase the market shareaccording to the model.This exemplar mainly involves the following generic skills:1. Mathematical skills Apply mathematical concepts in probability and statistics to translate a real-lifescenario into mathematical representation2. Critical thinking Observe critically the assumptions, constraints and limitations of themathematical models so as to refine the models to better fit the real-lifescenarios3. Problem solving skills Use mathematical tools such as tables and diagrams to represent probability,and statistical methods to define and illustrate real-life problems Study and propose suitable and solvable mathematical models as possiblemethods in solving a real-life problem6
Reference:Biebach H, Friedrich B, Heine G (1986). Interaction of body mass, fat, foraging andstopover period in trans-Sahara migrating passerine birds. Oecologia (Berl)69:370–3797
Annex: Information sheet on some marketing researches on Smartphone1.A marketing research on global mobile market by an international games,esports & mobile market intelligence in April 2017:- The global market share of Brand I and Brand S are roughly 25% and 31%respectively2.A marketing tracker on smartphone market by an international serviceprovider of market intelligence, advisory services in information technology,telecommunications and consumer technology markets in December 2017:- Roughly 41% of smartphone users expect to replace their smartphones in thefuture 12 months respectively3.A survey on brand loyalty of smartphones by an international investmentbank in May 2017:- 92% and 7% of Brand I smartphone users who expect to replacement theirsmartphones in the future 12 months will respectively go for a new Brand I andBrand S smartphone- 10% and 77% of Brand I smartphone users who expect to replacement their-smartphones in the future 12 months will respectively go for a new Brand I andBrand S smartphoneRoughly 15% and 20% of other customers who expect to replacement theirsmartphones in the future 12 months will respectively go for a new Brand I andBrand S smartphoneRemark:The information in this Annex is retrieved and modified from authentic marketingresearch reports on the smartphone market.8
decision-making process. In this example, a probabilistic model is employed to model the decision-making process under the effect of brand loyalty. This customer behaviour that will affect the decision would be introduced in the subject BAFS of Technology Education KLA. Collaborations with teachers of BAFS could be sought.