Transcription
Demographic Diversity in Texas andthe DFW Metro AreaDiversity, Equity, and Inclusion SummitFebruary 14, 2019@TexasDemography
Produce, interpret, and disseminatedemographic information to facilitate datadriven decision making for the benefit of Texans.
Demographic Overview Texas is experiencing significant growth. Migration is the primary source of growth for metropolitan areas in Texas. For the second year in a row, the Dallas‐Fort Worth‐Arlington metro areaadded more people between 2016 and 2017 than any other metro in thecountry. About 60% of population change in the DFW metro area can be attributed tonet migration. Internally, the DFW metro has significant population reallocation, impactingthe principal core counties of Dallas and Tarrant in very different ways. International migration plays a key role in population growth in the DFWmetro area. A young and growing workforce could be a competitive edge for Texas and itsgrowing metro areas. Demographic shifts may have serious implications for maintaining inclusiveand equitable economic growth in the state.3
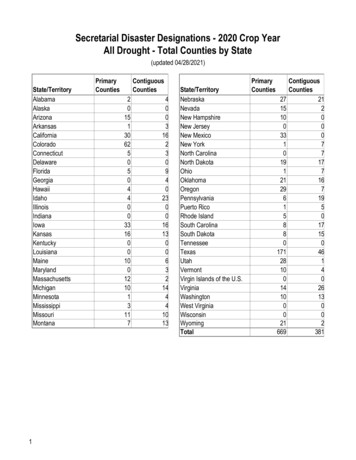
Total Estimated Population by County, Texas, 2017Dallam ShermanOchiltreeLipscombHansfordHartley HutchinsonRobertsHemphillMooreOldham PotterCarson GrayWheelerDeaf Smith scoe HallChildressSwisherHardemanWilbargerBaileyLamb Hale Floyd Motley CottleWichitaFoardClayGraysonLamarRed RiverFanninCochranHockleyCrosbyKing Knox BaylorArcher JackDentonWiseCollinHopkinsYoakum Terry Lynn Garza lRockwallRains er toDawsonShackelfordSmithGreggHood Johnson EllisAndrews MartinEastlandMitchellNolan TaylorHendersonErath SomervellRuskPanolaCallahanHowardHill NavarroComancheShelbyCherokeeBosqueEl PasoLovingWinkler esSan nanLimestoneHudspeth CulbersonWardMillsSabineCrane UptonCoryellReagan Irion Tom GreenConchoLeon Houston AngelinaReevesFallsLampasasTrinityMcCulloch San SabaRobertsonMadisonBellJasperNewtonSchleicher MenardMilam Brazos Walker Polk TylerPecosBurnetJeff DavisCrockettMason LlanoSan JacintoWilliamsonGrimesBurlesonHardinSutton KimbleMontgomeryLeeGillespieBlanco residioEdwardsJeffersonKerr Kendall HaysAustinHarrisFayetteValVerdeComal CaldwellChambersBrewsterReal BanderaColorado Fort BendGuadalupeGalvestonGonzalesBexarLavacaKinney Uvalde MedinaWhartonBrazoriaWilson DeWittJacksonZavala Frio lenCalhounDimmit La Salle Live OakBee Refugio134 - 10,00010,001 - 50,00050,001 - 100,000100,001 - 500,000500,001 - 4,652,980WebbSan PatricioAransasJim WellsNuecesDuvalKlebergJim urce: U.S. Census Bureau, 2017 Vintage Population Estimates
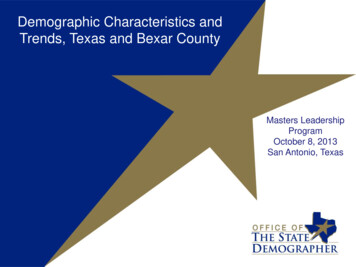
Out of State Jobs by Texas Largest Cities, 2018Source: Federal Reserve Bank of Dallas, Southwest Economy 4th Quarter 2018 Report5
Top 10 Metro Areas for Numeric Growth between 2016‐2017RankMetro ntChange1Dallas‐Fort Worth‐Arlington, TX7,253,4247,399,662146,2382.02Houston‐The Woodlands‐Sugar Land, TX6,798,0106,892,42794,4171.43Atlanta‐Sandy Springs‐Roswell, ttsdale, on‐Alexandria, le‐Tacoma‐Bellevue, WA3,802,6603,867,04664,3861.77Riverside‐San Bernardino‐Ontario, ��Sanford, FL2,453,3332,509,83156,4982.39Austin‐Round Rock, TX2,060,5582,115,82755,2692.710Tampa‐St. Petersburg‐Clearwater, FL3,036,5253,091,39954,8741.8Source: U.S. Census Bureau, 2017 Vintage Population Estimates6
Largest U.S. Cities, 71New York, NY8,175,133 8,292,688 8,383,504 8,458,642 8,521,135 8,582,459 8,615,426 8,622,6982Los Angeles, CA3,792,621 3,824,592 3,859,267 3,891,783 3,922,668 3,953,459 3,981,116 3,999,7593Chicago, IL2,695,598 2,706,670 2,717,989 2,724,482 2,726,533 2,725,154 2,720,275 2,716,4504Houston, TX2,099,451 2,125,450 2,159,824 2,198,244 2,238,795 2,282,235 2,304,482 2,312,7175Phoenix, AZ1,445,632 1,467,519 1,495,880 1,521,182 1,547,729 1,575,039 1,602,042 1,626,0786Philadelphia, PA1,526,006 1,539,649 1,551,944 1,558,109 1,564,042 1,570,507 1,574,765 1,580,8637San Antonio, TX1,327,407 1,357,900 1,383,505 1,408,910 1,435,554 1,464,147 1,487,738 1,511,9468San Diego, CA1,307,402 1,320,638 1,338,975 1,358,207 1,379,123 1,391,040 1,406,682 1,419,5169Dallas, TX1,197,816 1,218,631 1,242,035 1,258,932 1,278,504 1,299,793 1,322,140 1,341,07510San Jose, CA945,942971,352985,722 1,003,735 1,016,708 1,027,560 1,031,942 1,035,31711Austin, TX790,390828,700854,350Source: U.S. Census Bureau, 2017 Vintage Population Estimates874,910900,621919,974938,200950,715
15 Fastest‐Growing Large Cities and Towns between 2016and 2017 (Populations of 50,000 or more in 2016)RankCityStateTXPercentincrease8.22017 total population177,2861Frisco2New 6857Castle Rock 81,33010MeridianID4.799,92611Flower Mound townTX4.376,68112BendOR4.394,52013Cedar ParkTX4.275,70414DoralFL4.261,13015Fort MyersFL4.279,94Source: U.S. Census Bureau, 2017 Vintage Population Estimates8
Top Counties for Numeric Growth in ntonCollinFort BendTravisWilliamsonMontgomeryHidalgo*U.S. RankPopulationChangePopulationChangePercent ofChange fromNaturalIncreasePercent Changefrom DomesticMigrationPercent .7%68.5%8.8%4910,474105.9%‐34.5%28.5%*Hidalgo and Harris Counties had negative net migration (Harris ‐10,322 and Hidalgo ‐621).Source: U.S. Census Bureau, 2017 Vintage Population Estimates
County to County Migration Flows, Dallas and TarrantCounties, 2010‐2014Dallas CountyTarrant CountyIn‐FlowsNet MigrationDallas County19,8345,333‐1,803Denton County5,752‐1,7809,576‐8,105Harris County3,4031,279Harris County3,771‐1,013Johnson County3,208‐528Ellis County2,746‐1,201Parker County2,620‐45Kaufman County2,436‐1,829Collin County2,612‐191Travis County2,186‐1,226Brazos County465‐1,192Bexar County2,070113In‐FlowsNet MigrationTarrant County14,501‐5,333Collin County13,637Denton County10
Racial/Ethnic, Age, and Gender Diversity in Texas and DFW
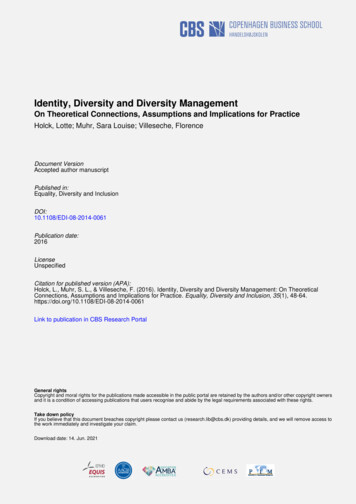
Texas Racial and Ethnic Composition,2000, 2010, and 201720002010Hispanic, 32%NH White,53%2017Hispanic,38%NH Black,NH Other,11%1%NH Asian,3%NH White,45%Hispanic39%White, NH42%NH Black,NH Other,12%2%NH Asian,4%Two orBlack, NHMore Races,12%NHAsian, NH1%5%Source: U.S. Census Bureau. 2000, 2010 Decennial Census and 2017 Population Estimates11
Race/Ethnicity Composition, Dallas Metro Area and DFWCounties, 2017Dallas‐Fort Worth‐Arlington Metro AreaNH Asian7%NH Black15%NH Other3%Hispanic29%NH White46%Source: U.S. Census Bureau, 2017 American Community Survey 1‐Year EstimatesNH WhiteNH BlackHispanicNH Two orNH Asian More : U.S. Census Bureau, 2017 Population Estimates13
Numeric Change by Race/Ethnicity, DFW Metro Area, 2010to 58HispanicNH WhiteNH BlackNH AsianNumeric ChangeSource: U.S. Census Bureau, 2017 Population Estimates0.0%Percent of Total Population Change14
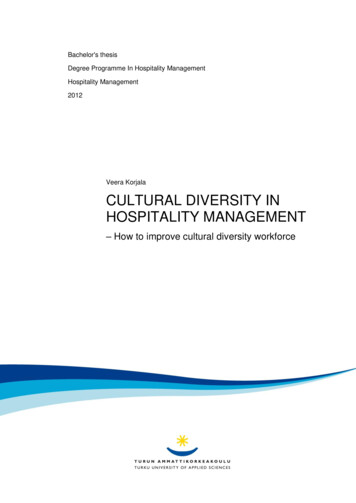
Population Pyramid for White Non‐Hispanics in Texas, 201785 years and over80 to 84 years75 to 79 years70 to 74 years65 to 69 years60 to 64 years55 to 59 years50 to 54 years45 to 49 years40 to 44 years35 to 39 years30 to 34 years25 to 29 years20 to 24 years15 to 19 years10 to 14 years5 to 9 yearsUnder 5 years‐500000 ‐400000 ‐300000 ‐200000 ‐100000White‐NH MaleSource: U.S. Census Bureau, 2017 Population e‐NH Female15
Population Pyramid for Hispanics in Texas, 201785 years and over80 to 84 years75 to 79 years70 to 74 years65 to 69 years60 to 64 years55 to 59 years50 to 54 years45 to 49 years40 to 44 years35 to 39 years30 to 34 years25 to 29 years20 to 24 years15 to 19 years10 to 14 years5 to 9 yearsUnder 5 years‐600000‐400000‐200000Hispanic MaleSource: U.S. Census Bureau, 2017 Population Estimates0200000400000600000Hispanic Female16
Texas Population Pyramid by Race/Ethnicity, 201785 years and over80 to 84 years75 to 79 years70 to 74 years65 to 69 years60 to 64 years55 to 59 years50 to 54 years45 to 49 years40 to 44 years35 to 39 years30 to 34 years25 to 29 years20 to 24 years15 to 19 years10 to 14 years5 to 9 yearsUnder 5 years‐1500000Source: U.S. Census Bureau, 2017 Population Estimates‐1000000‐5000000500000Asian‐NH MaleBlack‐NH MaleWhite‐NH MaleHispanic MaleAsian‐NH FemaleBlack‐NH FemaleWhite‐NH FemaleHispanic Female1000000150000017
Annual Shares of Recent Non‐Citizen Immigrants toTexas by World Area of Birth, 2005‐2015Estimated numberof internationalmigrants to Texas2015201035.8%44.1%33.0%50.6%2005Asia7.3% 9.1%17.3%69.4%Latin America7.1% 13.1%EuropeSource: U.S. Census Bureau, American Community Survey, 1‐Year PUMS7.8%5.5%101,58877,70298,194Africa and Other18
Educational Attainment by Race/Ethnicity,Texas and Big Four Metro Areas, 2017High School Degree and above100%90%94.0%89.5%88.4%Educational attainment in the Dallas metro is higher orsimilar to that of the state with the exception ofHispanic educational attainment, where it is lower.83.6%80%Bachelor’s Degree and HoustonSource: U.S. Census Bureau, 2017 American Community Survey 1‐Year EstimatesTotalNHWhiteSan AntonioHispanicBlackAsianTexas19
Median Household Income by Race/Ethnicity,Texas and Big Four Metro Areas, 2017 100,000 90,000Median household incomes in the Dallas metro tendto be higher than the state for all race/ethnic groups,but especially for Asians. 84,100 80,000 72,361 70,000 60,000 59,206 50,000 45,092 46,855 40,000 30,000 20,000 10,000 0TotalAustinNH WhiteDallasHispanicHoustonSource: U.S. Census Bureau, 2017 American Community Survey 1‐Year EstimatesBlackSan AntonioAsianTexas20
Unemployment and Poverty Rates by Race/Ethnicity,Texas and Big Four Metro Areas, 201725.0%The unemployment and poverty rates in the Dallasmetro tend to be lower than the state rates for allrace/ethnicity groups.Poverty Rate20.7%19.0%20.0%14.7%15.0%Unemployment NH Hispanic BlackWhiteAustinDallasAsianHoustonSource: U.S. Census Bureau, 2017 American Community Survey 1‐Year EstimatesTotalNH Hispanic BlackWhiteSan AntonioAsianTexas21
Nativity by Select Characteristics, Texas, 2017Foreign BornU.S. �% Change, 2000‐201767.4%30.6%% Change, 1990‐200090.2%16.1%Hispanic or Latino66.0%33.9%Black or African American5.7%13.4%Asian19.1%1.8%Under 50.9%8.4%5‐175.9%21.6%18‐6481.5%57.6%65 and older11.8%12.3%Percent of Texas Population22
Nativity by Labor Force Characteristics, Texas, 2017Foreign BornU.S. 564.1%5.4%Private wage and salary workers82.6%79.6%Government workers7.4%14.3%Self‐employed workers9.9%5.9%Unpaid family workers0.2%0.2%Population 16 plus% in Civilian Labor ForceCivilian Labor Force% UnemployedClass of Worker23
Percent Foreign Born Workers by Occupation and Industry,Texas, 2017% Foreign Born% of all civilian workers22.3%OccupationsNatural Resources, Construction, Maintenance39.5%Service Occupations29.5%Production, Transportation, and Material Moving29.2%Management, Business, Science, and Arts16.9%Sales and Office turing26.8%Arts, entertainment, recreation, accommodation, and food services24.9%Agriculture24.1%Transportation and Warehousing and Utilities22.3%Professional, scientific, management, administrative, and wastemanagement services23.2%24
25
Population by Generation, DFW, Texas, ,0005,000,0000SilentBaby BoomersGeneration XMillennialsGeneration ZGeneration ZSource: Texas Demographic Center, 2016 Population 6,287MillennialsGeneration XBaby BoomersSilent26
27
Employment Status by Age, Texas, 2017Labor employmentRate64.3%60.7%5.1%16 to 19 years34.3%27.7%17.7%20 to 24 years72.9%65.2%8.9%25 to 29 years80.6%75.4%5.5%30 to 34 years81.0%76.5%4.7%35 to 44 years80.7%77.2%3.9%45 to 54 years79.8%76.7%3.8%55 to 59 years71.9%69.2%3.7%60 to 64 years57.4%55.6%3.2%65 to 74 years27.6%26.6%3.6%75 years and over7.2%6.9%3.3%Population 16 years and overSource: U.S. Census Bureau, 2017 American Community Survey 1‐Year Estimates28
Labor Force Participation by Select Characteristics, Texasand U.S., 2000 to 2017Percent of Married Families with Both Partners in Labor Force49.8%Percent of Children under 6 years with Both Parents in Labor Force59.7%Percent Employed with a Computer at home plus internet92.2%Percent Unemployed with a Computer at home plus internet85.8%Source: U.S. Census Bureau, 2017 American Community Survey 1‐Year Estimates29
Median Earnings for Full‐Time, Year‐Round Employees bySex, Texas, 2017Total Median Earnings 44,803Male Median Earnings 49,414Female Median Earnings 40,236Pay Gap 0.81 to the dollarNH White Women 0.76 to the dollarHispanic Women 0.47 to the dollarBlack Women 0.62 to the dollarAsian Women 0.81 to the dollar*pay gap derived using NH White male pay as reference group.Source: U.S. Census Bureau, 2017 American Community Survey 1‐Year Estimates30
Gender Pay Gap, Texas and Big Four Metros, 2017TexasAustin MetroDFW MetroHouston MetroSan Antonio MetroMedianEarnings,MaleMedianEarnings,FemalePay Gap 49,414 55,162 51,498 51,634 43,515 40,236 47,075 44,207 42,274 37,535.81.85.86.82.86Source: U.S. Census Bureau, 2017 American Community Survey 1‐Year EstimatesPay Gap forHispanicWomenTexas.60Austin Metro.64DFW Metro.59Houston Metro.56San Antonio Metro.7431
Texas Legislature Demographics, 2019 Nearly 2 of every 3 Texaslawmakers are white. Less than ¼ of them are women.Source: Texas Tribune, ��lawmakers‐legislature‐demographics/32
Population Projections
Projected Population, 2010‐2050, Texas55Zero Migration500.5 Migration1.0 MigrationMillions4554.447.32010‐2015 Migration4040.5353031.22520Source: Texas Demographic Center, 2014 and 2018 Population Projections34
MillionsProjected Population by Race and Ethnicity,Texas 2010‐20502520.2201513.5106.055.81.8020102015NH White2020NH BlackSource: Texas Demographic Center 2018 Population Projections20252030Hispanic20352040NH Asian20452050NH Other35
Population Projections, DFW Metro LargestCounties, 5423.93.52010 2015 2020 2025 2030 2035 2040 2045 201520202025CollinDallasSource: Texas Demographic Center, 2018 Population Projections2030Denton2035204020452050Tarrant36
Population Projections, DFW Metro Smaller ource: Texas Demographic Center, 2018 Population 50Wise37
Projected Numeric Change, DFW Metro,2010 to 4NH WhiteNH BlackHispanicNH AsianNH OtherNumeric Change0.0%Percent of Total Population Change38
Lila Valencia, Ph.D.(512) .gov@TexasDemography39
Tarrant County In‐Flows Net Migration Tarrant County 14,501 ‐5,333 Collin County 13,637 ‐1,803 Denton County 9,576 ‐8,105 Harris County 3,771 ‐1,013 Ellis County 2,746 ‐1,201 Kaufman County 2,436 ‐1,829 Travis County 2,186 ‐1,226 Bexar County 2,070 113 County to County Migration Flows, Dallas and Tarrant