Transcription
Metrics That MatterSupporting IT Decision and Strategy at theSenior Executive LevelRandy Steinberg – Migration TechnologiesJanuary 23, 2012 2012 Migration Technologies Inc.Pittsburgh itSMF Local Interest GroupLIG Name goes here
Agenda: The Metrics Problem The Metrics Model A Tour Through Metrics Hell 7 Killer IT Metrics Implementing A Metrics Program2 2012 Migration Technologies.Pittsburgh Local Interest Group
The Metrics ProblemKey Challenges Many IT Organizations Have With Metrics 2012 Migration Technologies Inc.
This Happens All Too Often .“We Can’t Convince Management HowImportant Our Incident Management Project Is”“Our ITIL/ITSM Effort Is Losing Steam”“No One Recognizes the IT Value We Are Delivering”Management: “Where’s The Value? What Are We GettingFor Our Money?”4 2012 Migration Technologies.Pittsburgh Local Interest Group
Actual IT Excuses For Not MeasuringWhat they sometimes say What they are really saying “We have other priorities ”“We know what’s good for the business andprefer to operate without validating our value“We don’t have the tools ”“We expect the tools to tell us what to measureand if we can’t be perfect we can’t beresponsible ”“We don’t want others to see how well orpoorly we are doing ”“We prefer to keep our management totallyblind about what we are doing ”“We’re uncomfortable about letting otherssee our performance levels ”“We’ve gotten away with this for years – weintend to continue to get away with this ”When asked – most IT organizations generate metrics “because management asked us to ”5 2012 Migration Technologies.Pittsburgh Local Interest Group
Measuring IT – Best Practices Per ITILWhy does IT starthere (the 2nd step)most of the time? 2007 OGC – ITIL Continual Service Improvement6 2012 Migration Technologies.Pittsburgh Local Interest Group
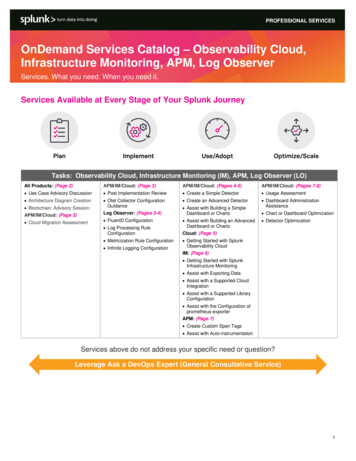
Scope Landscape For ITSM MetricsHighBusinessValueWhy does ITmostly focushere?LowerBusinessValue7 2007 OGC – ITIL Continual Service Improvement 2012 Migration Technologies.Pittsburgh Local Interest Group
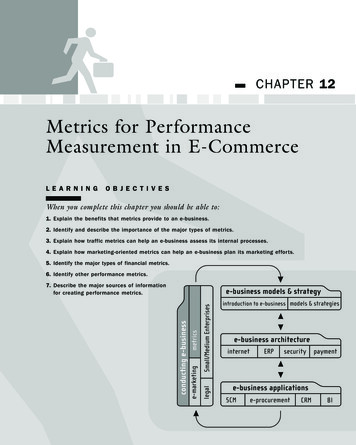
Example Problem: Availability MetricsDesktopMidrange99% xApplicationWirelessWe were outfor over 16hours last week!!DatabaseIntranetNetwork99% x 99% x 97% x 98% x 99% x 99% 90.4%AvailableComponent availability is meaningless to end users and the business 8 2012 Migration Technologies.Pittsburgh Local Interest Group
Metrics That Matter – An ExampleMetric: NUMBER OF CHANGES (i.e. 1,067)Doesn’t matter Only describes what took placeand provides no information for future actionMetric: CHANGE SUCCESS RATE (i.e. 94.6%)Does matter Provides quality indication andeasily identifies when actions need to occur forimprovement9 2012 Migration Technologies.Pittsburgh Local Interest Group
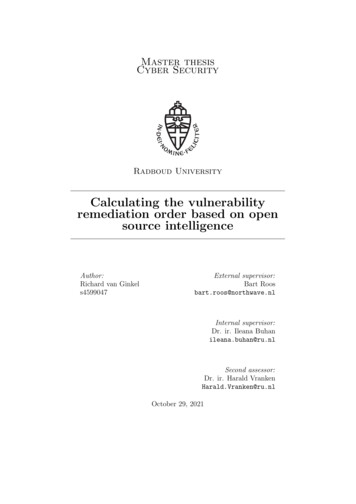
Leveraging The ITIL DIKW ModelWisdom Management DecisionsKnowledgeVersus trying tohelpmanagementmake effectivedecisions? Change Effectiveness Unplanned Labor Rates, etc.Information Incident Volumes Change Volumes Average Resolution Times, etc.Why does ITmostly focus atthese levels?Data IncidentsChangesExpendituresOperational Events, etc.Bottom Line: Every Metric Should Lead To A Management Decision!10 2012 Migration Technologies.Pittsburgh Local Interest Group
The Metrics ModelAssembling the types of metrics that can be used for providing value 2012 Migration Technologies Inc.
Thinking In Categories Of Metrics 12OperationalKey Performance Indicators (KPIs)TolerancesCritical Success Factors (CSFs)DashboardsWhat-IfsOutcomesAnalyticalOther 2012 Migration Technologies.Pittsburgh Local Interest Group
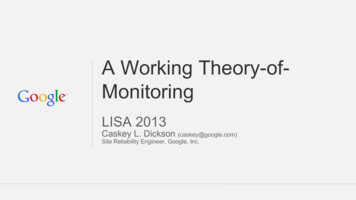
Putting Metrics Categories TogetherExample: # incidents # changesExample: % of changescausing e: 0% Target 5% ThresholdExample: Protect services whenmaking changesCriticalSuccessFactorsTolerancesDashboards and Reports13 2012 Migration Technologies.Pittsburgh Local Interest Group
Metrics Category: OperationalMetrics that reflect day to day observations of operational eventsUsed as input for Key Performance Indicators (KPIs)Mistakenly used by IT when reporting to executivesExamples: 14Total Number Of Changes ImplementedNumber Of Incidents ReopenedNumber Of Problems In PipelineNumber Of Calls HandledCustomer Survey ResultsTotal Expended IT Costs 2012 Migration Technologies.Pittsburgh Local Interest Group
Metrics Category: - KPIsMetrics that indicate the key performance level of an operation or process toprovide that basis for actionable management decisionsCalculated or derived from one or more Operational MetricsIndicates whether one or more Critical Success Factors (CSFs) are being metFalls within a target and acceptance range (Tolerance)Examples: 15Change Efficiency RateChange Labor Workforce UtilizationIncident Repeat RateCapacity Management Process MaturityTotal Service Penalties Paid 2012 Migration Technologies.Pittsburgh Local Interest Group
Metrics Category: TolerancesUpper (Target) and Lower (Warning) KPI values that reflect success, at riskor failure of those KPIsUpper and Lower values set by IT Service Manager with agreement from ITand Business Senior ManagementTarget(Upper)KPI ExampleCustomer SatisfactionRatingUnauthorized Change RateAverage IncidentResolution Time (Hours)16 2012 Migration tsburgh Local Interest Group
Metrics Category: CSFsMetrics that represent key operational performance requirements whichindicate whether a process or operation is performing successfully from acustomer or business perspectiveCalculated or derived from one or more KPIs and how those KPIs performedwithin tolerance levelsIndicated with a Performance LevelCSFPerformance LevelProtect Services When Making ChangesProvide Services At Acceptable Cost17 2012 Migration Technologies.HighMediumPittsburgh Local Interest Group
Metrics Category:Dashboards and ReportsKey metrics that are represented on a report or graphical interface that indicatewhether the success, at risk or failure of a business operationUsed to quickly assess state of operation and take timely actions to correctoperational deficienciesMay include drill down capabilities to determine more detailed performanceissues18 2012 Migration Technologies.Pittsburgh Local Interest Group
Other Metrics Categories: OutcomesKey indicators of business risk areas with performance indicators resultingfrom the success, at risk or failure of KPIs or CSFsUsed to quickly assess the level of risks created by process or operationaldeficiencies19 2012 Migration Technologies.Pittsburgh Local Interest Group
Other Metrics Categories: What-IfsUse cases derived from impending business decisions that will be used to“model” the impacts of those decisions on KPIs and CSFsAssociated with a Decision Impact LevelCharacterized by increases/decreases in KPI/CSF results and whether theyremain or fall outside of tolerances20What-IfImpact CharacterizationImplement new ERPsystemIncrease in changes toinfrastructureGo through with ABCmergerIncrease ininfrastructurecomplexity 2012 Migration Technologies.Decision ImpactLevelImpactsLow To MediumAll Change KPIsx 20%Medium To HighAll ServiceDelivery KPIs x 30%Pittsburgh Local Interest Group
Other Metrics Categories: AnalyticalMetrics used to aid research into an issue, incident or service problemTypically collected and reported on for ONE-TIME ONLY or SPECIALPURPOSESExamples Number of incidents incurred by business unit ABC Number of delta releases included in package releases Number of incidents with resolution times 8 hoursIT frequently makes the mistake of including these in regular reportingto senior management “just in case”. This results in a lot of wastedlabor in building reports and clouds real management issues that needto be addressed!21 2012 Migration Technologies.Pittsburgh Local Interest Group
What If Metrics Are Not Available?Lack of available metrics is not an excuse to not measure!22What You Can DoUseExampleEstablish IndicatorsSome observable operationalevent for which it is agreedmeans somethingNumber of staff on 3rd shift: 5indicates unacceptable impactlevels of incidentsConduct Random orScheduledInspectionsObservable event thatrepresents all occurrences ofthat eventAcceptable network capacity levelsif all network line utilizations at1pm stay under 60%Use AnalogousMeasuresObservable event substitutedfor another event# of calls to the Service Desk willequal # of incidents taking placeDevelop Programs ToCreate MetricsDeveloping programs whomeasures will substitute forreal eventsBuild time stamped dummytransactions that traverse theinfrastructure to get availabilityConduct AuditsPeriodic audits for whoseresults will indicate KPIsAnnual customer satisfactionsurvey results will indicate servicesatisfaction levels 2012 Migration Technologies.Pittsburgh Local Interest Group
Metrics Modeling Tool Easy To Use Excel-Based Provides Metrics For ManyITIL Processes Provides Sources For Metrics Follows The Concepts In ThisPresentation Provides Dashboard ResultsRANDY STEINBERGEmail: RandyASteinberg@aol.com23 2012 Migration Technologies.Pittsburgh Local Interest Group
A Tour Through Metrics HellThings That Actual IT Organizations Have Run Into 2012 Migration Technologies Inc.
“Fox In The Henhouse” SyndromeYes ma’am – just keeprebooting your PCwhen that happens!Guess we cancount this oneas a closedproblem!The people doing the work should not be the people reporting about it!25 2012 Migration Technologies.Pittsburgh Local Interest Group
“Impress Them With Data” SyndromeExamples of metrics actually reported to the CIO Executive Team: Number of changes logged this month Number of incidents occurring this month Server utilization was 70% ABC Network availability was 99.5% Average transaction server response was 8ms Number of CIs in the CMDB Number of software licensesIf it doesn’t contribute to making decisions – don’t present it!26 2012 Migration Technologies.Pittsburgh Local Interest Group
“Creative Charts” SyndromeIf it can’t be understood in 5 seconds or less – don’t do it!27 2012 Migration Technologies.Pittsburgh Local Interest Group
“The Tool Is Everything” SyndromeServices BillABC Dashboard Tool 85,000.00Collection Agent Licenses 7,500.00ODCB Server License 1,080.00Database License 24,500.00Server Platforms 72,500.00Integration Services 124,850.00Annual Maintenance 15,500.00Gold-Level Support 24,200.00Operations Staff 178,500.00Don’t expect that tools will tell you what to measure!28 2012 Migration Technologies.Pittsburgh Local Interest Group
“Seemed Like A Good Idea” tionSAROtherAggregation and CollectionDon’t use metrics that require significant labor to produce!29 2012 Migration Technologies.Pittsburgh Local Interest Group
7 Killer IT MetricsMetrics That IT Hates Yet Senior Executives Love 2012 Migration Technologies Inc.
Killer Measurement #1 – Incident Business Impact RatioCalculated AsNumber of incidents resolvedNumber of incidents reported to service deskSuggested TargetsTargetThreshold100%90%If Within TargetsDemonstrateswonderful work ITis doing to keepthings runningIf Below TargetDemonstrates littleor no value frominvestments inmonitoring toolsPrimary Improvement ITSM Focus Areas 31Event ManagementAvailability ManagementProblem ManagementIncident Management 2012 Migration Technologies Service Design Service Operation.Pittsburgh Local Interest Group
Killer Measurement #2 – Unplanned Labor RatioCalculated AsNumber of monthly hours spent on incidents and reworkTotal labor hours availableSuggested Targets 32TargetThreshold0%10%If Within TargetsIT is runningefficiently andmaximizing itsinvestment in laborIf Below TargetIT labor is being diverted tonon-value activities and mayalso be a root cause forproject delays and inability toreact to business needsPrimary Improvement ITIL Focus AreasProblem Management Service DesignChange Management Service OperationIncident Management Service TransitionCapacity ManagementAvailability Management 2012 Migration Technologies.Pittsburgh Local Interest Group
Killer Measurement #3 – Unplanned PurchasesCalculated AsTotal unplanned IT expensesTotal IT budgeted expensesSuggested Targets 33TargetThreshold0%10%If Within TargetsIT is effectivelymanaging andcontrolling it’s costsIf Below TargetIT is out of control when itcomes to controlling costsand has lost negotiationleverage with it’s suppliersPrimary Improvement ITIL Focus AreasCapacity ManagementDemand Management Service StrategyIT Financial Management Service DesignEvent ManagementAvailability Management 2012 Migration Technologies.Pittsburgh Local Interest Group
Killer Measurement #4 – Customer Satisfaction LevelCalculated AsAverage customer satisfaction survey scoreSuggested TargetsTargetThreshold10.0*9.0*If Within TargetsIT is effectivelymeeting customerneeds Assumes a 10 point scalewith 10 High and 1 Low 34If Below TargetIT is viewed asproblematic and lacksconfidence from thebusiness in theircapabilitiesPrimary Improvement ITIL Focus AreasIncident Management Service StrategyProblem Management Service DesignRequest Fulfillment Service TransitionService Desk 2012 Migration Technologies.Pittsburgh Local Interest Group
Killer Measurement #5 – Change Efficiency RatioCalculated AsNumber of changes implemented defect free on timeTotal changes that have been requestedSuggested Targets 35TargetThreshold100%90%If Within TargetsIT is effectivelymeeting andadapting tobusiness needsand changesIf Below TargetIT is a bottleneck to thebusiness and may beconstraining businesscapabilities to open newmarkets and servicesPrimary Improvement ITIL Focus AreasChange ManagementRelease and DeploymentService Validation and TestingRequest FulfillmentDemand Management 2012 Migration Technologies Service Strategy Service Transition.Pittsburgh Local Interest Group
Killer Measurement #6 – Costs By ServiceCalculated AsNumber of IT services with known delivery costsTotal services in the IT portfolioSuggested Targets 36TargetThreshold100%90%If Within TargetsIf Below TargetIT has appropriatetransparency of costsexpended to deliverservices and a soundbasis for working ITstrategy with thebusinessIT is viewed as a “blackbox” overhead to thebusiness organizationand may be “leakingcosts” and deemed astoo expensivePrimary Improvement ITIL Focus AreasService Portfolio Management Service StrategyIT Financial Management Service DesignService Asset & Configuration Service TransitionDemand ManagementCapacity Management 2012 Migration Technologies.Pittsburgh Local Interest Group
Killer Measurement #7 – Availability By ServiceCalculated AsNumber of IT services meeting availability targetsTotal services in the IT portfolioSuggested Targets 37TargetThreshold100%90%If Within TargetsIT services areavailable at levels thatmeet business needsIf Below TargetIT is providing little valueand in extreme casescould be puttingbusiness revenue andreputation at riskPrimary Improvement ITIL Focus AreasService Portfolio Management Service StrategyAvailability Management Service DesignProblem Management Service OperationIncident ManagementEvent Management 2012 Migration Technologies.Pittsburgh Local Interest Group
Implementing A Metrics ProgramEstablishing Your Metrics Capabilities 2012 Migration Technologies Inc.
Getting Started Tips Follow the ITIL 7-Step Improvement Process Identify WHAT needs to be measured first Identify strategy for getting those metrics Develop a Metrics Dictionary – describes your measurement standards: Metrics descriptions Data sources Calculations Thresholds for action Intended audiences Implement reporting as an IT service (see next slide)39 2012 Migration Technologies.Pittsburgh Local Interest Group
Build A Metrics Reporting Service Build and maintain a catalog of standard service reports that describe how wellservices are being delivered and the overall quality of service delivery and supportactivities Plan, design, build, test, implement and maintain strategies, procedures andtechnologies to assemble result data, create and distribute reports Plan, design, build, test, implement and maintain strategies and technologies toprovide management dashboards and reporting web sites Build and maintain report distribution lists Plan, build, manage, maintain and coordinate a master set of service metrics,calculations and assumptions Provide consulting services to identify and implement a best practice set of keyperformance indicators, critical success factors and service targets for services Periodically conduct service audits to identify how well services are being deliveredand potential opportunities for improvement Periodically conduct reporting reviews with management to identify improvementsover the quality and use of reports provided40 2012 Migration Technologies.Pittsburgh Local Interest Group
Key Metrics Reporting Activities1) Identify who will use metrics and for what purpose2) Identify desired metrics3) Establish assumptions4) Establish data sources5) Implement collection and reporting roles and responsibilities6) Implement collection and reporting processes7) Implement collection and reporting tools8) Continually monitor for metric improvementsMetrics implementation should be a critical component of your ITSMImplementation efforts!!41 2012 Migration Technologies.Pittsburgh Local Interest Group
Key Takeaways Focus on metrics that lead to management decisions Consider using categories of metrics that work together Establish a metrics reporting “service” Remember:‒ “If you don't measure it, you can't manage it”‒ “If you don't measure it, you can't improve it”42 2012 Migration Technologies.Pittsburgh Local Interest Group
DiscussionRANDY STEINBERGEmail: RandyASteinberg@aol.com43 2012 Migration Technologies.Pittsburgh Local Interest Group
Metrics Category: - KPIs . Metrics that indicate the key performance level of an operation or process to provide that basis for actionable management decisions . Calculated or derived from one or more Operational Metrics . Indicates whether one or more Critical Success Factors (CSFs) are being met . Falls within a target and acceptance range .