Transcription
ADVANCINGADVANCINGH EE DEIChemE Safety CentreGuidanceLead Process Safety Metrics –selecting, tracking and learning2015IChemEtyreSafetCen
www.ichemesafetycentre.org
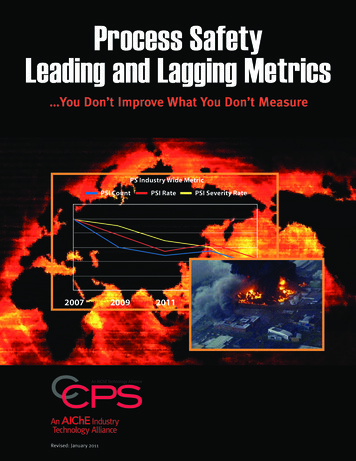
PrefaceThe IChemE Safety Centre (ISC) is an industry-funded and led organisation,focussed on improving process safety through sharing information andlearnings. ISC members can nominate specific areas of focus, and ISC leadsthe development work in these areas, working with personnel from membercompanies. Once a specific need is defined by the ISC Advisory Board, aproject sponsor is appointed and a team is nominated. The team then setsabout progressing the project.Lead process safety metrics were identified as an initial area of work forISC. This consisted of reviewing the lead metrics reported by each membercompany, first looking for commonality. Once this was established, the metricswere selected, or not, for further development, based on their apparent value,ie what decision or action they would drive, and their ease of collection. Apriority was put on the high value, easy-to-collect metrics. The team thenset about further reviewing and establishing definitions, calculations, andsuggested directions of metrics for improvement etc.The need for lead process safety metrics is well established, via a number ofprominent process safety incidents. A prominent example of this is the BPTexas City Refinery explosion1, resulting in the development of the AmericanPetroleum Institute Recommended Practice 754, known as API RP 7542 (API,2010), to focus on process safety metrics. Process safety metrics must betracked and understood in addition to occupational safety metrics. We cannotinfer from the lost-time injury rate, for example, whether we have a processsafety problem developing. Tracking process safety metrics is vital, to help usunderstand the state of our facilities and systems, as well as providing us withan indication of impending issues. Importantly, while lagging process safetymetrics will inform you of history, which can be used to monitor improvement,they will not necessarily predict future loss-of-control events. While leadingmetrics are proactive and provide the opportunity to manage developments,they are also not predictive of the future.There are well-established guidelines to focus more so on lagging indicators,such as API RP 754 (API, 2010), the Centre for Chemical Process Safety(CCPS) guidance3 (CCPS, 2007), International Oil and Gas Producers (IOGP)reporting requirements4 (IOGP, 2011), and the UK HSE5 (HSE, 2006). Thesepublications also provide guidance on how to establish leading metrics. Thisguidance document is focussed purely on leading process safety metrics, withspecific metrics that work and that can be adopted into your organisation. Thismeans that there are some obvious process safety metrics which are missing,such as incident rates, losses of containment etc. These are not inadvertentomissions – rather deliberate, as we are shifting the focus from lagging toleading indicators. Efforts have been made to include some metrics whichmeasure the quality of activities rather than just their occurrence.This document is aimed at industries that manage processing hazards. Theseinclude areas such as oil and gas, chemical, mining, food and pharmaceutical,to name a few. While not all the metrics may always be applicable to allsectors, it is worth understanding their background, to see if they wouldindeed provide value, perhaps in a different configuration. The final decisionregarding selecting and implementing metrics will depend on the maturitylevel of the site and specific focus at the time. Adopting this guidance is astart to developing some consistency in lead process safety metrics, and willallow effective benchmarking. This will help demonstrate improvements tostakeholders. You may not be able to adopt all of the metrics contained in thisguidance, but you should try to understand how you are monitoring systemsand processes if you do not have these metrics in place.33
The layout of this guidance has been developed alongthe lines of the ISC functional elements of process safety6(ISC, 2014). This premise is that effective management ofprocess safety requires leadership across six functionalelements in an organisation. These are: knowledge and competence, engineering and design, systems and procedures, assurance, human factors, and cultureThese elements can be thought of as a chain of safety,rather than application of Reason’s Swiss Cheese model7(Reason, 1997). This is because we do not need failuresin all elements to have an incident, but rather multiplefailures in one element could result in an incident. Theintegrity of the chain is in the multiple layers behind it;hence at least one metric is monitoring the health of eachelement.The metrics selected here have been chosen on a basis ofproviding valuable information, to inform decisions andactions in an organisation. After all, if you are recordinga metric, but it is not informing you of any decision oraction, one must ask what the purpose of recording it is. Itis acknowledged that some of these metrics may be moredifficult for some companies to record than others. It isup to each company to understand their capability, andwww.ichemesafetycentre.orgtheir needs and work toward the implementation, if it is ofvalue.The metrics have been mapped back to the six elementsabove. Each element is covered by at least one metric.This reinforces the premise that leadership in these areasis fundamental. The metrics in this guidance provide youwith a way to monitor these elements of your business.In addition to this, we have provided some guidance onhow to focus on the auditing of the specific process safetyaspects of various systems. It is important to ensure anymetrics selected monitor the whole organisation withrespect to process safety. There is a risk of missing somevital information if only some aspects of the organisationare monitored.
Some of the metrics defined may be more informative atan individual site level, and some may need to be rolled upto corporate level to prove useful. Where this is the case,it is noted in the appropriate sections.When analysing lead metrics, it is important to view thedata as individual metrics, but also as a collective set ofdata. This allows insight into whether the metrics areproviding the same story about the health of the systems.If leading metrics are not complementing each other asexpected, there may be some underlying issues to beresolved. Additionally, if after a period of time, dependingon the metric, leading metrics are showing greatimprovement, but lagging metrics are not, the metricsand analysis should be revisited to determine whetherthe leading metrics are assisting the organisation or not.There may be different leading metrics required to drivedifferent behaviours.This guidance focusses on the operational phase of anorganisation. For this reason, metrics which would be usedin a design or construction phase have not been includedin this edition. These metrics might cover aspects such asinherently safety design.Lastly, this is a living document and we expect the metricsand their tracking systems to evolve over time. If you arerecording other metrics that are proving useful, keeprecording them, but please give us with feedback so wecan review for possible future inclusion.This project reviewed a substantial number of metrics,many of which were not selected for inclusion. If youwould like to know what these were, please contact ISC.Contactthe ISCemail: safetycentre@icheme.orgAcknowledgementsThe ISC would like to acknowledge the efforts ofthe following companies, who participated in thedevelopment of this guidance: Apache Energy - Steve Fogarty, Philip Weerakody Orica - Allan McGregor Todd Corporation - Grant Slater Woodside - Simon Bugg MMI Engineering - Paul Heierman-Rix, Garry Law EnVizTec - John Cormican, Andrew Marcer Simon Casey Risk and Safety Consultant - SimonCasey35
ContentsPreface3Acknowledgements5Terminology and acronyms7How to use this guidance8The metrics9Knowledge & competence10Engineering & design12Systems & procedures18Assurance28Human factors32Culture36Appendix 139Process safety audit39Process safety barriers39Process safety audit org42
Terminology and acronymsAssurance TaskLeading metricThis could be a system audit performed on specificprocess safety elements or a simple checklist or inspectionor a hardware test for full functionality of a barrier. Theassurance task needs to be designed to test the health ofthe barrier, taking into account the multiple failure modespossible.At this point in the document it is important to definethe meaning of leading. There are two interpretations ofleading metrics. In the first, leading points to doing thingsright (positive re-enforcement), ie doing all that is requiredfor equipment integrity monitoring, following criticalprocedures every time and getting them right, havingall the required information available and accessible etc.So for this type of metric a 100% compliance is an idealtarget. In the second interpretation a leading metric isakin to holes starting to appear in a layer of Swiss cheese7(Reason, 1997). So it is failure of one barrier but otherbarriers still exist and continue to prevent an incident. Soin a sense it is actually a lagging indicator of a single barrierfailure or barrier weakness. For this metric you want todrive the target down. Put simply, the first one looksfor the barrier being always present and strong and thesecond one tracks weaknesses in a barrier after they havehappened. The other publications mentioned have severalindicators of the second type. ISC has strived to achieve abalance between these two types of leading metrics.BarrierDifferent organisations have different terminology forsimilar elements, such as control, barriers, layers ofprotection etc. This guidance uses the term “barriers” toavoid duplication. It is also important to recognise thatsome barriers are passive (eg the design of a pressurevessel), while some are active (eg an automated pressureshutdown), and the management of these varies.DeviationA deviation is where a failure mechanism occurs, makinga system no longer operate as designed, or where it hasbeen taken out of service or is bypassed.Failure on demandManagement of Change (MOC)A barrier may be deemed to have failed on demand whenit has been called upon to perform its designed functionand has not met the requirements. An example may bea pressure relief valve relieving at a pressure other thanits set pressure (outside of its acceptable tolerance) or ashutdown system that did not shut down when initiatingtriggers were reached.This is about conducting structured risk-based reviewson changes to hardware, systems or organisationstructures prior to effecting the change, to ensure allhazards and risks have been identified and addressed.Depending on time frames, facility requirements andthe type of changes, there can be several different typesof management of change. These include emergency,temporary and permanent. An emergency change is onedone during an emergency or time-critical situation toeffect a change to ensure the facility continues to functionsafely. A temporary change is one that is put in place fora fixed period of time and then reversed. An example ofthis may be a temporary barrier while a more permanentbarrier is implemented. A permanent change is one thatis implemented with the intent for it to be in place for theforeseeable future. An example of this would be installinga new barrier on a system.Failure on testA barrier may be deemed to have failed on test when ithas been called upon to perform its designed function andhas not met the requirements, or it no longer meets thedefined standards. An example may be a pressure reliefvalve during a bench test relieving at a pressure other thanits set pressure (outside of its acceptable tolerance) orcorrosion causing the equipment to be deemed not fit forservice during inspection.Fit for serviceFitness for service is defined in the joint AmericanPetroleum Institute, American Society of MechanicalEngineers publication API 579-1/ASME FFS-1, FitnessFor-Service (API/AMSE, 2007)8.Primary containmentPrimary containment is the first level of containment of afluid, such as a pipe, tank or vessel.Safety critical elements (SCE)This is a barrier that has been deemed to be critical by thefacility or organisation. This is usually done on the basis ofunderstanding what consequence the barrier is preventingor mitigating, the likelihood of that consequencehappening and the reliability of the barrier. SCEs can behardware, control system related, or administrative, suchas procedures. This document has not sought to definedifferent categories of SCE, as this is an additional taskoutside the development of this guidance.37
How to use this guidanceThis guidance defines a set of leading metrics across all functional elements of an organisation. These metrics have beentested and used in different industries and have been found to provide value and input into decision making.Recommended steps on how to implement this guidance:1. Determine the scope for implementationa. are the metrics to be applied across an entire organisation or an individual facility?2. Map your current leading metrics to the list in Table 1a. you may find you are already recording some of these metrics, or very similar ones3. Determine any gaps between your current metrics and the metrics outlined in Table 14. Where gaps are identified, determine if you have other metrics to cover thema. where you have metrics covering the gaps, and they are useful, continue to record themb. if the metrics covering the gaps are not useful, consider adopting the metrics in this guidancec. ensure that you have a comprehensive picture o
Petroleum Institute Recommended Practice 754, known as API RP 7542 (API, 2010), to focus on process safety metrics. Process safety metrics must be tracked and understood in addition to occupational safety metrics. We cannot infer from the lost-time injury rate, for example, whether we have a process safety problem developing. Tracking process safety metrics is vital, to help us understand