Transcription
Implementing the right Keywith thoughtful KeyPerformance Indicators (KPI’s) startsPerformance Questions (KPQ’s)Facility ManagementMetricsThat MatterOVERVIEWIN A WORLD OF INCREASING DATA, IT IS BECOMING MOREIMPORTANT TO EXTRACT THAT INFORMATION OF VALUE TO USWHEN AND WHERE WE NEED IT. UNDERSTANDING THE TYPESOF METRICS, FORMULATING USEFUL KPI’S, AND MAKING THESEREADILY AVAILABLE TO US AND OUR COLLEAGUES CAN LET USDEVELOP FACILITY MANAGEMENT METRICS THAT MATTER.
Facility Management Metrics That MatterIntroductionInformation Overload?Types of Metrics234Measurements4Indicators4Key Indicators / Key Performance Indicators4Lagging (Past Results)5Leading (Future Performance Prediction)5KPI “Matrix”5Useful Metrics Are Situational6Establish KPI’s using KPQ’s7Base KPQ’s on The Organizational Scorecard8Design KPI’s To Answer The KPQs9FM Metrics Need Non-FM Data10Presentation of 12Graphic Displays Help Communication12Group or Nest Large Quantity of KPIs12Conclusion13About the Authors14White Paper FM Metrics that Matter1
IntroductionFacilities Managers (like everyone else) are being deluged withdata, and in turn are being asked to generate data for others.The problem is, data on its own does not tell a story that canlead to action. Data can be sorted and totalled to show whatyou did in the past but does not tell you where you are going.It is when data is used in combination with objectives that itenables smarter, more efficient facility management.2White Paper FM Metrics that Matter
Information Overload?Data, data everywhere – we are being bombarded with it andthere is more to come. All of our business systems, sensors inthe environment, the internet of things, even the apps on oursmartphones are vying for our attention. Sometimes it can feellike keeping up with all this information is just one more thingwe have to do rather than something that helps us worksmarter.Common data sources for facilities managers include all of thefollowing and more:Enterprise financesystemsBuilding AutomationsystemsEnterprise HR systemsEnergy ManagementsystemsFacility workorder/CMMS systemsEmailCAFM/CADD/BIMsystemsText messagesConstruction plans &specsOnline data servicesProject managementreportsCloud systemsIndustry publicationsBenchmarking reportsEquipment sensorsCommissioning reportsOccupancy sensorsSocial mediaSecurity systemsPhotographsCamerasTechnical/design reportsMeter readingsRegulations & standardsSpreadsheetsIndustry cost guidesBuilding AuditsEquipment AlarmsWhite Paper FM Metrics that Matter3
Types of MetricsFor simplicity, all the types of data and information will be calledmetrics in this whitepaper. The exact terminology used is notimportant, but it is essential that we understand the differencebetween data, information, and knowledge.MeasurementsEmergency work orders wrench timelast monthMeasurements are just data, consisting of a value for definedunit of measure and time/date stamp. Examples include thingssuch as cost, size, temperature, status, and a range of yes/noconditions.Total wrench time worked last monthIndicatorsIndicators Require:Indicators are a sum of measurements about a single topic. For1. A unit of measure ( , hrs, sum)example, number of work orders completed for a designated2. A dimension of timeperiod. On their own they do not provide any insight other thanmagnitude which is the lowest level of information.Key Indicators RequireKey Indicators / Key Performance Indicators1. Indicators or other KPI’sKey Indicators use a math calculation (typically the divide key)2. A math calculationbetween multiple Indicators to bring perspective to the results3. The desired target/rangeand provide meaningful information. For example;Indicatorsopen work ordersKey Indicator % of work orders completedtotal work ordersKey Performance Indicators (KPI’s) usually add a target or goalto define the desired or acceptable values for an Indicator thatis believed to be important.4White Paper FM Metrics that Matter
Lagging (Past Results)Lagging indicators are those that report past results. These canbe considered “factual” representation of past performanceResults Indicatorbecause they are based on actual measurements. An exampleTells you what you have doneis the number of scheduled work orders completed on time byPerformance Indicatorwho performed the work.Lagging indicators are best used to review recent performanceand historical trends. Lagging indicators are certainly validinformation, and many times contribute towards knowledge andTells you what to doKey Results IndicatorProvides perspective on how youleading indicators.have performedLeading (Future Performance Prediction)Key Performance IndicatorLeading indicators are those that are believed to showTells you what to do to increaseinformation that suggests likely future performance. Implicit inperformancethese indicators is some type of knowledge of cause and effect.An example is a forecast for hot humid weather as a leadingindicator for increased air conditioning demand and higherenergy usage.Leading indicators are best used by managers to guide actiontowards desired outcomes. Because of the challenge inmeasurable items with reliable forecasting capability, we oftenuse “real time” lagging indicators as proxies for valid leadingindicators. This at least allows much less elapsed time betweenthe measure and any corrective action.KPI “Matrix”We can create a matrix of Indicator/Key Indicator xLagging/Leading as a way to organize our various KPI’s toprovide a blend of metrics.White Paper FM Metrics that Matter5
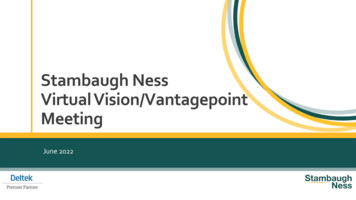
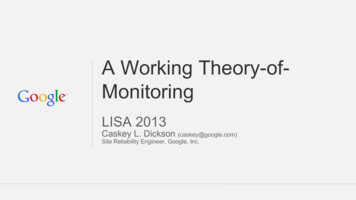
Useful Metrics Are SituationalNow let’s answer the question asked as the title of this paper:Which Facility Management Metrics Really Matter?The answer is: It depends. (Yes it was a trick question.)The metrics that matter depend upon the situation: Who isusing the metric and why do they need it?Typically the complexity of the metric will increase with thedistance from hands-on performance of facility work.For a Building Engineer, measurements can be useful metrics: Which open work orders need to be done today? What is the current equipment temperature for unit 1? How long has pump A been running?For the Regional Building Manager, more complex indicatorsare needed to be useful:Corporate LevelStrategic Level Parts inventory as a percentage of asset valueService request on-time completion percentage Work orders completed within 10% of allotted timeThe Director of Facilities is probably looking for even morecomplex indicators, including data sets outside of any FacilitiesManagement systems: Staff satisfaction rate with building services Operating cost per occupied square foot Utilization rate for office space by departmentFunctional LevelQuantity of MetricsAnd the CFO is only interested in very high level metrics of theoverall business, of which Facilities Management is just aportion: 6Total Facility Cost as Earnings per Share.Return on Net Asset for PropertiesWhite Paper FM Metrics that Matter
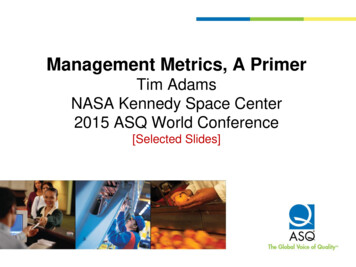
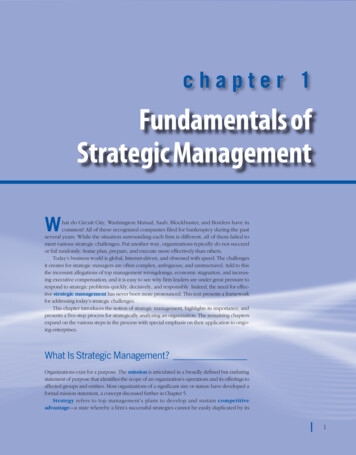
Establish KPI’s using KPQ’sMany organizations have difficulty identifying KPI’s that willassist them in measuring their facility managementperformance. The purpose of a KPI is to provide information fordecision makers and other users about the performance of theiroperations and actions needed to stay on course.A common approach to designing KPI’s is to look at the dataavailable and then try to figure out how to use that data. Thereare two problems with this approach: 1) When we startcollecting data without knowing what answers we are looking forthen we often end up wasting time collecting the wrong orunnecessary data. 2) When we start from the data that wehave, we end up with KPIs on things that might be easy tomeasure but which offer few insights about the really importantquestions we need answered.Another tendency is to copy the KPI’s used by peers. There issome benefit to learning from others with similar needs as longas we confirm that our KPIs help us make the best progresstowards our own organization goals, which may or may not bethe same as our peers.Here is where Key Performance Questions (KPQ’s) come inhandy – ask the questions that need to be answered toaccomplish our strategic objectives. The best KPIs will bethe answers to these very questions. Understanding thequestion we are trying to answer also clarifies why we are usingKPIKPQStrategicObjectiveKPIKPIKPQKPIKPIa particular KPI so it is easier to see when it needs to bechanged.White Paper FM Metrics that Matter7
Base KPQ’s on The Organizational ScorecardKPQKPIThe starting point for choosing which performance indicatorsKPIare key to a particular organization should be those that seniorKPIKPQKPIKPImanagement use. We probably have some type of strategicscorecard, so that is the place to start.Structure key performance questions to initiate discussion andthe search for useful answers. As we can see from the list onQuestions that lead to KPI’sthe side, the questions may not have a simple answer. TheDo our facilities provide a safe andproductive environment forcustomers and employees?resulting discussion on how to answer it could determine thatseveral KPI’s will be required.The most powerful KPQ’s will be those focused on desiredHow well do we react to spikes inservice requests?Is our facility cost as low as it canbe without jeopardizing thebuilding condition?future outcomes. While we use historical data to buildknowledge, a primary value of KPI’s is to provide decisionmakers with actionable information that helps us achievedesired results.Do we have qualified staff readyand willing to fill vacancies whenneeded?As noted earlier, the actionable information varies by situationDo our buildings perform (energy)as well as they should?ensuring alignment with the larger organizational objectives.(user role) so it is important to refine the KPQ’s as we cascadedown the organization to make them relevant to the user whileManagement should also periodically review the chosen KPQ’s.What sustainability investmentswould provide the largest benefitper cost?8Needs and objectives change over time, making it important toupdate the KPI’s accordingly.White Paper FM Metrics that Matter
Design KPI’s To Answer The KPQsOnce we have good KPQ’s, Key Performance Indicators (KPI’s)KPIKPQcan be developed to measure progress towards theorganization’s goals. Developing key performance indicatorscan be challenging because we need to understand whichStrategicObjectiveKPIKPIKPQKPIactions will contribute to success and how to measure them.KPIThis is why good leading indicators are particularly difficult todefine.A good KPI is one that:KPI Design Considerations: Helps to answer one or more KPQ. Is based on relevant, available data.1. Link to Strategy Provides actionable information for the intended user.2. Definition Is available on the required frequency.3. CalculationA good KPI design will include the factors in the list to the side.4. PurposeIn this way the organization’s strategic objective will generate5. Data SourcesKPQ’s, and the answers to these KPQ’s will be provided by the6. Future TargetsKPI’s.Bernard Marr lists “75 KPIs Every Manager Needs to Know”described in a book of the same name. Note that while hespecifically defines this for “manager,” not all of these areappropriate for all levels of managers in an organization. Also,this list is offered only to provide some examples; these are notnecessarily recommended as the KPIs that everyone should knowWhite Paper FM Metrics that Matter9
FM Metrics Need Non-FM DataAn area of growing sophistication and value is in integratingtraditional facilities management metrics (energy usage, area,occupancy) with other business operation metrics.An easy to understand example of this for retail is “sales persquare foot.”This is increasingly important for us in order to understand andcommunicate the importance of facilities management and itsimpact on organizational performance.Ideally, information from IWMS, CRM, ERP and other systemsin our organization would all be brought together and beavailable to us when we need, whether on our mobile device ordesktop. Business intelligence systems offer this capability butmay require significant effort to accomplish this goal.In the meantime, we can realize most of the benefits prettyefficiently with less automated integration – merged exports andselective data entry, especially when dealing with unstructureddata. Example where data entry is efficient would be addingutility meter readings or the number of workplace injuries(where the volume of data entry does not justify an expensive ITintegration).10White Paper FM Metrics that Matter
Presentation of KPI’sThe usefulness of a KPI depends on the situation, so does themethod of its presentation.ScorecardsMany organizations use Scorecards to track and reportprogress on multiple concurrent performance measures againsta pre-set goal. Scorecards are typically higher level KPI’s thatalign with the larger strategic objectives of the business,updated annually or quarterly.Facilities management may have their own scorecard, usuallywith items that cascade down from a few designated items atthe overall organization level.DashboardsDashboards are typically less focused on a strategic objectiveand more tied to specific operational issues. Dashboards maybe real-time or at least updated daily, to provide the user withactionable information in a format that is both intuitive andinsightful. Information on a dashboard could range from rawdata measures to KPI’s.ReportsReports are best used to present information that is lessdynamic in nature, including complicated data calculations andlonger term trends. Since reports typically summarize pastinformation, they are most useful for administrative review ofpast performance and technical analysis to identify trends forfuture planning.White Paper FM Metrics that Matter11
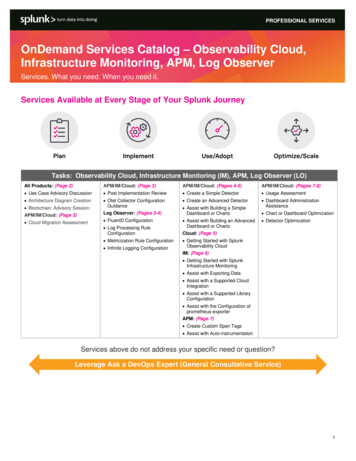
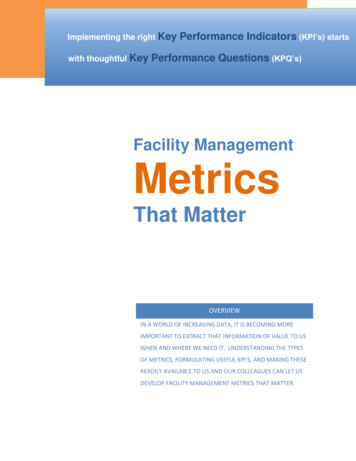
TrendingA KPI displaying performance in isolation over a single periodmay not provide us with enough information to take action. Anindication on whether performance is improving or not may bemore valuable for us in assessing the need for action. (Theexample on the side displays a color coded arrow thatcommunicates the current trend.)Graphic Displays Help CommunicationThere are “human factors” to consider in the presentation of ourIneffective KPI GraphicDoes not assist the user inunderstanding if action is requiredKPI’s, typical of any system user interface.While the top chart on the side provides all the “data” for thisindicator it does not provide any insight on whether action isrequired or not. The “information” is more effectively conveyedMore Effective KPI Graphicwith the lower graphic that intuitively shows if the value isEasy to understand currentposition and desired position.“better” or “worse” relative to our goal. It instantlycommunicates whether or not I need to take action on this item.Group or Nest Large Quantity of KPIsMost reporting includes far more metrics than we can reallyfocus upon. Studies suggest that humans can only focus on 4to 7 things at once (Miller's Law says 7 2 but others say 4) –far less than the 75 “Key” Performance Indicators we referencecategories).Even simple design is important to help us make sense of aUse Icons for Multiple KPIsStoplights are one way tosimplify large data sets.12large number of metrics and then drill down into those ofinterest by grouping, “chunking” or otherwise simplifying theinformation presented.White Paper FM Metrics that Matter
ConclusionThis overview identified the types of metrics that can be usedfor Facilities Management, and the value of each type. It alsoidentified how useful metrics are situational – both over timeand by the job function of the user.Key Performance Questions can be the best way to developKPI’s that are useful, and these need to be reviewed to ensurethey still align with organizational needs and are appropriate forthe designated user.Finally, the typical metric interfaces were reviewed to describeconsiderations for selecting the presentation most appropriatefor the desired purpose.Interested readers may also want to consider one of thepublications listed as references.White Paper FM Metrics that Matter13
About the AuthorsChris Dodds is the President of Facility Team, an IntegratedWorkplace Management Software (IWMS) system that allowsusers to create and track whatever metrics and KPIs they want.www.FacilityTeam.comBob Lambe is the President of RAL Location Strategies, aconsulting firm that helps organizations identify the facilityassets and associated data/systems that best support theirbusiness objectives. www.RALStrategies.comThe Following References are all available on Amazon:Key Performance Indicators, Developing, Implementing, and Using Winning KPIsBy David ParmenterKey Performance Indicators, The 75 Measures Every Manager Needs to KnowBy Bernard MarrThe Maintenance Scorecard, Creating Strategic AdvantageBy Daryl MatherAnalytics at Work, Smarter Decisions, Better ResultsThomas Davenport, Jeanne Harris and Robert MorisonHow to Measure Anything, Finding the Value of Intangibles in BusinessBy Douglas HubbardKey Performance Indicators For DummiesBy Bernard MarrThis document may be shared in its entirety.14White Paper FM Metrics that Matter
Facility Management Metrics That Matter Introduction 2 Information Overload? 3 Types of Metrics 4 Measurements 4 Indicators 4 Key Indicators / Key Performance Indicators 4 Lagging (Past Results) 5 Leading (Future Performance Prediction) 5 KPI "Matrix" 5 Useful Metrics Are Situational 6 Establish KPI's using KPQ's 7 Base KPQ's on The Organizational Scorecard 8 Design KPI's To Answer .