Transcription
Management Metrics, A PrimerTim AdamsNASA Kennedy Space Center2015 ASQ World Conference[Selected Slides]
Objectives Answer the “journalisticquestions” aboutmanagement metrics,metrics for managing. Use these answers tomotivate the manager tobuild and use metrics forhis/her organization.1
Metric – a mathematical view In Mathematics, a metricis an abstraction of thenotion of distance. Not all topologies* have ametric space, and not allmetric spaces measuredistance the same way.* Topology is concerned with properties of geometric figures that remain invariant when thefigures are deformed in any way that does not create new points or fuse existing points.2
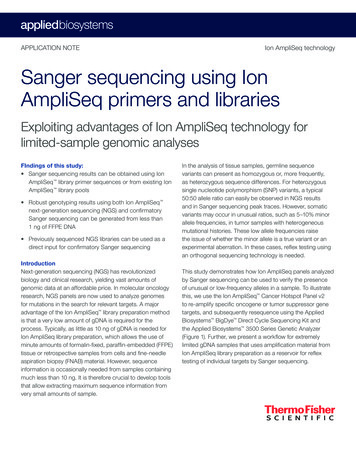
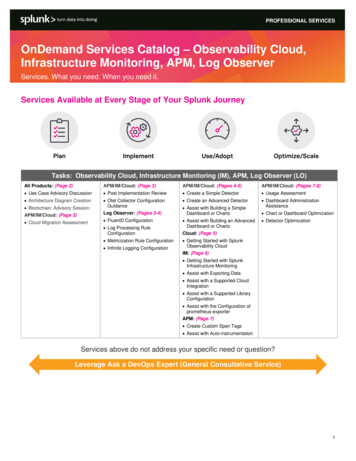
Management metric – flow diagramNot isionRiskAnalysisCurrentStateOK A management metric assigns ameasure to the performance gap.3
What is a management metric? A mathematical function thatassigns a measure to the “gap”between the output’s currentstate (c) and the goal’s desiredstate (d).4
Math for metrics – getting started Absolute Error ΔAE d - c . Relative Error ΔRE (d - c)/d where d 0. Relative Change ΔRC (c - d)/ d where d 0.5
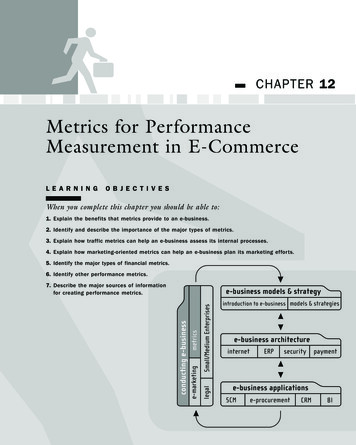
Management metrics – 2 types Subjective Produced by a state of mindParticular to an individualExample: “We are safe.” Objective Material object, not mental conceptActual existenceNot influenced by emotion or opinionExample: “No accidents occurred.”
“Subjective” metrics – example7
“Objective” metrics – 3 types1. Effectiveness ( Quality) How well results accomplishedthe stated purpose.2. Efficiency ( Quantity) How well resources were usedor consumed.3. Appeal ( Acceptance) How well human preferencewas satisfied.8
Effectiveness metrics – 2 types Technical characteristicsPhysical characteristics (e.g., size,shape) and functional capability.“On the drawing.” Operating characteristicsNon-physical characteristics beingoperating behaviors and outcomes(examples on next page).“Inferred by the drawing.”9
Operating characteristics – 9 typesSafety:Usability:Freedom fromaccident and lossHuman interfacesSupportabilityandServiceability:Service throughoutthe planned life lihood of havingan uptime (failurefree) state for astated duration orloadLikelihood ofreturning to anuptime state due tomaintenance orrepairLikelihood arepairable item hasan uptime state;A f (R, M)Producibility:Affordability:Disposability:Ease and economyof producing ormanufacturingTotal cost ofownership and notonly systemacquisition costDisassembly anddisposal(environmentalstewardship)10
Where should metrics be used? Metrics are needed:With imperfect systems. When desired state is critical. When management has a highdesire to obtain the desired state. Metrics are not needed With perfect or low-risk systems.11
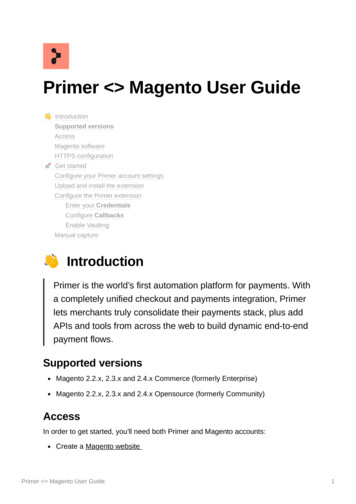
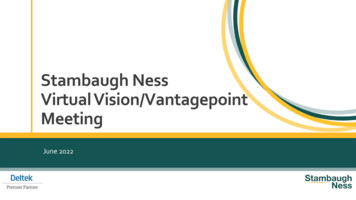
Why do metrics? To quantitatively characterizethe performance gap and tosupport the decision to Continue as is, Make adjustments (changes), or Obtain more information tomake a risk-informed decision. Graphs can be misleading. 12
Great graph; why metric formulas?Desired state 2400 hr; Avg current state 1300 hr)13
Example What is the trend? (d ?)14
Trending without graphs All graphs used the same data! To test for a trend in discrete eventswithout graphing, use the LaplaceTest, a test statistic.nz [(( ti ) / n) T / 2] T 1 /(12n)i ti is the time from the start time to the time of the ith event. n is the number of events. T is the time from the start time to the end time of the observation period.15
Graphs instead of metric formulas? Sometimes “a picture isworth a 1000 words” –and sometimes it can bemisleading or confusing. When there is sufficientamount of data, do both:Plot the data Treat the data. 16
When are metrics collected? During the game (Formative) In process; is inferential. End of the game (Summative) End of process; is descriptive. Not at all (not in the game?)“Not keeping score” still allowsactivity to be reported, or Use subjective (self-rating) metrics. 17
How many metrics are needed? Consider a dashboard,a combination ofmetrics, for yourorganization. Performance is seldomassessed by a singlemetric. Consider 18
Pick one: “I need you to be ”1. Effective Complete task “x” with no errors.2. Efficient Produce “y” units per hour, cost.3. Appealing Check your work, support lastminute changes, be teamoriented, be safe.19
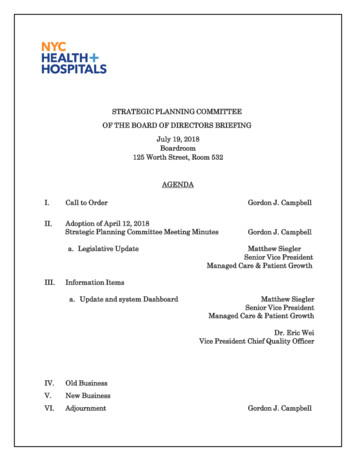
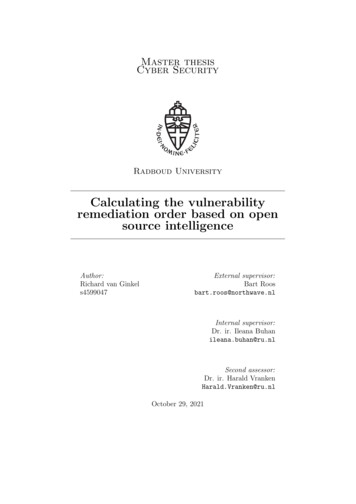
Example – aggregating unlike scalesSink, D.S., Productivity Management: Planning, Measurement and Evaluation, Control and Improvement, 1985, pp. 198-202.20
Method – aggregating unlike scales The “Objectives Matrix” method:Combines multiple-unlike measuresbased on any scale into one score. Different weights can be assigned toeach performance area. The resulting composite value can betrended over time. Called multicriteria performance /productivity measurement technique. 21
Who should make the metrics? The manager! Why, because Making (not buying) yourmanagement metrics:Provides “expert/information power” Can be revealing 22
One reason to do your own metrics“What is most remarkable is that themere effort to measure a difficult-tomeasure construct can lead to amuch deeper understanding andmore effective management of thatdimension or asset.”Source is Dean Spitzer, author of Transforming PerformanceMeasurement, AMACOM, 2007. (Balestracci, D., “MeasurementAs a Framework for Strategy,” Qualitydigest.com, May 08, 2013).23
Benchmarking: Do your metrics Measure distance or length?Distance is between two points. For management, the two states are:o What you want, ando What you have. Length is a measure from zero.o It does not compare states.o It only measures one state. 24
Benchmarking: Do your metrics Focus on what should bemeasured, and not whatcan be measured? Objectively measure all areas oforganizational performance?Effectiveness, Efficiency, and Human Appeal? 25
A management metric is not a Statistic, a function of the sample data. Trend when it uses length (not distance). Figure of merit, aggregated quantities usedto characterize performance and options. Risk measure, Prob. of Failure x Impact. Any single count or measure or just lengths.Why? Because a metric is a functionof two points (states) and not one.26
Contact InformationTimothy C. AdamsReliability & Risk EngineerNASA Kennedy Space CenterEngineering & Technology DirectorateTechnical Performance & Integration DivisionTim.Adams@NASA.gov321-867-226727
Management metrics -2 types "Subjective" metrics -example 7 "Objective" metrics-3 types 1. Effectiveness ( Quality) . Consider a dashboard, a combination of metrics, for your organization. Performance is seldom assessed by a single metric. Consider