Transcription
Volume Estimation by Monte-Carlo Simulation using Customized Distribution Functions:A Comparative StudyHimanshu Sachdeva*, Surajit Gorain*, *Prize Petroleum Company Limited, New Delhi (a wholly ownedsubsidiary of Hindustan Petroleum Corporation ty; Volume estimation; Monte-Carlo Simulation; Distribution function; Stochastic methodSummaryHigh risk is associated with each exploration andproduction (E&P) asset due to uncertainties related tovarious geologic and financial factors. The reservoirproperties (porosity (Φ), water saturation (Sw) etc.)describing the hydrocarbon resources in place are uncertainand accurate determination of these properties is essentialto assess the economic viability of any E&P asset.In general, standard distribution functions (normal, lognormal, gamma etc.) of reservoir properties (porosity (Φ),water saturation (Sw), net pay (h) etc.) are taken as inputsin Monte-Carlo Simulation for volume estimation. Thoughthis method takes care of the variability in input data set, itis likely that assumed standard distribution functions willnot always fit to the actual variation of data. Therefore acustomized distribution function which fits to the actualvariation of reservoir properties is crucial for betteraccuracy in volume estimation.In this paper, a modified statistical approach has beenadopted and a comparative study has been carried out toprovide the difference between the volume estimatesderived from standard distribution functions as well ascustomized distribution functions for input parameters inMonte-Carlo Simulation. These customized distributionfunctions for reservoir properties are well log data driven.The volume estimates derived in two cases show ameasureable difference. Hence it is recommended to usethe proposed approach on routine basis for better accuracyof results.Monte-Carlo Simulations are computational algorithms thatdepend on repeated random sampling to obtain numericalresults. These techniques help in estimation of uncertaintyin quantitative analysis and decision making. In principle,Monte-Carlo Methods can be used to solve any problemhaving a probabilistic explanation.Monte-Carlo Simulation method simulates a test whichresults in a probabilistic distribution of a random variableusing a mathematical function of a number of input randomvariables. In this method each random variable is assignedwith a probability distribution function which generates anumber of possible values for each input variable. Adeterministic calculation based up on the mathematicalrelationship between the output and input random variablesis performed which results in the probability distributionfunction for the output (Yashrakshita, 2013)A number of standard probability distribution functions(uniform, triangular, normal, gamma distribution etc.) arepossible for each input variables. The selection of thesedistribution functions depends upon the input datavariability. In practical cases it is likely that the assumedstandard distribution function is not fitting the actual datawhich affects the accuracy level.Therefore, it is required to have a customized distributionfunction of input variables. In the present paper acomparative analysis has been carried out using MonteCarlo Simulation taking standard as well customizeddistribution functions for input variables.MethodologyIntroductionResource/Reserve estimation for a prospect depends upon anumber of reservoir properties. There are a number ofmethods available in the industry for volume estimation.Stochastic method based on Monte-Carlo Simulation is oneof the most useful methods (Thander et. al., 2014). Instochastic approach multiple values for each parameter areconsidered resulting in multiple values of output honoringvariation/uncertainty of the data.As per the American Association of Petroleum Geologists(AAPG) guidelines the petroleum initial in place (PIIP) isdefined as(PIIP STB or scf) A*h*Φ*(1-Sw)/FVF (1)Where,PIIP Petroleum initially in-place (for oil OIIP andfor gas GIIP)11th Biennial International Conference & Exposition
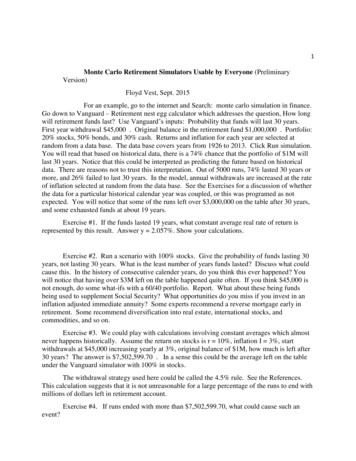
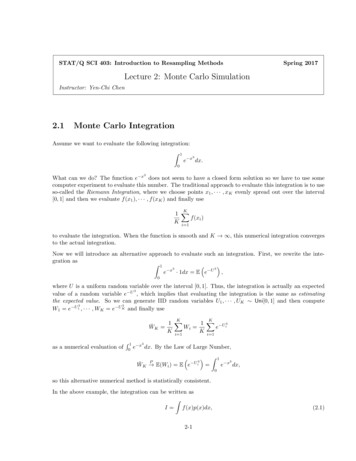
Volume Estimation by Monte-Carlo Simulation using Customized Distribution FunctionsA Areal extent of the reservoir pool (m2)h Net pay (m)Φ Porosity (fraction)Sw Water saturationFVF Formation volume factor [for oil (RB/STB)or gas (Rcf/scf)]Oil initially in-place or Gas initially in-place ismeasured in barrels or cubic feet.Stochastic MethodIn this method each parameters (A, h, Sw, Φ and FVF) isassigned with a probability distribution function whichgenerates a number of possible values for each inputparameter.In conventional approach standard distribution functions(normal distribution, uniform distribution, log normaldistribution etc.) are used for populating the parameters.Distribution properties (mean, variance etc.) for thesefunctions are determined from the input data set (Lipschutzand Schiller, 2005)Figure 1: Flow chart for Monte-Carlo SimulationIt is likely that the resulting standard distribution curvewhose distribution properties (mean, variance etc.) arederived from the input data set is not representing the actualvariation in data.In the modified approach a customized distributionfunction is used which is derived from the actual datadistribution.In the present study Monte-Carlo Simulation using standardas well as customized distribution functions has been runfor multiple realizations. The process flow chart is shownin figure 1. One representative well data (Well A) has beenutilized for volume estimation. The basic data input for thisprocess is derived from open hole well log data sets.Gamma ray (GR), Neutron Porosity (NPHI), Bulk Density(RHOB) & Laterolog Deep (LLD) logs have been used forestimation of reservoir properties (Glower, 2001): porosity(Φ), water saturation (Sw) and net pay (h). The flow chartfor determination of these parameters is shown in figure 2.Three logs namely effective porosity (Φe) water saturation(Sw) and net pay (h) are generated from input logs.All the input parameters (A, h, Sw, FVF and Φ) for volumeestimation are discussed in details below:Figure 2: Flow chart for determining reservoir properties11th Biennial International Conference & Exposition
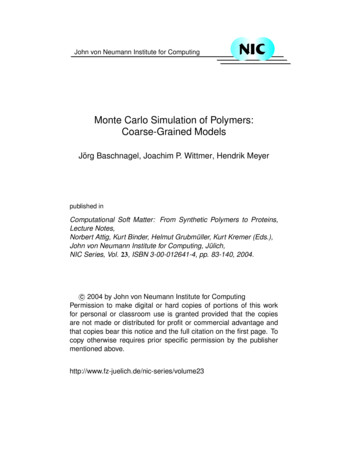
Volume Estimation by Monte-Carlo Simulation using Customized Distribution Functions1.) Porosity(Φe)Porosity has been estimated for the following two cases: using standard distribution function and using customized distribution functions.In first case, a log normal probablity distribution function isassumed for porosity with mean (µ) value equals to 0.20and standard deviation(σ) of 0.07. The distribution functionfor this case is shown in figure 3.In first case, a log normal probablity distribution function isassumed for Sw with mean (µ) value equals to 0.30 andstandard deviation(σ) of 0.1. The distribution function forthis case is shown in figure 5.Figure 5: Log normal Sw distribution curveFigure 3: Log normal porosity distribution curveIn second case, the customized probablity distributionfunction is created from the data distribution of Sw log forthe range 0.0- 1.0 The function generated is shown in figure6.In second case, a customized probablity distributionfunction is created from the data distribution of porositylog. In this case histrogram for porosity log for the range0.0- 0.40 is created and then frquency for each data point isnormalized which resulted in a customized probablitydistribution function for porosity. The function generated isshown in figure 4.Figure 6: Customized Sw distribution curve3.) Net pay (h)Figure 4: Customized porosity distribution curve2.) Water Saturation (Sw)Water saturation has also been estimated for two casesfollowing the same method as used for estimating theporosity.The net pay for the reservoir zone in Well A is estimatedusing the cut-off equation as discussed in flow chart (figure2). The estimated net pay after applying the cut-offs is ofthe order of 7m.The thickness for detrmining the net pay is dervided fromthe thickness of reservoir zone encountered in the wellwhich may not be the true stratigraphic thickness ofreservoir. Moreover since the net pay is derived from thecut-offs for Vsh, Sw and Φe which are user defined; thevalue for net pay will differ for different cut-offs.11th Biennial International Conference & Exposition
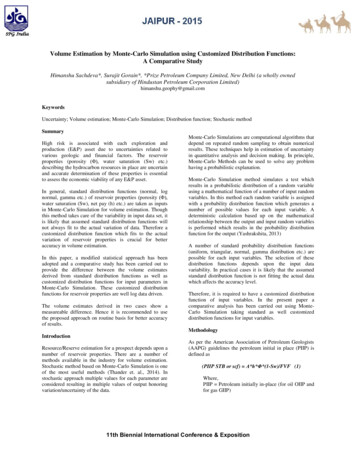
Volume Estimation by Monte-Carlo Simulation using Customized Distribution FunctionsConsidering above, uncertainity in the value of net pay hasbeen taken into account rather then considering a singlevalue.A uniform distribution function ranging from 6-8m isconsidered for the present computation. The distributioncurve for net pay is shown in figure 7.Considering above, uncertainity in the value of area hasbeen taken into account. A uniform ditrbution functionranging from 5-7 SKM is assumed. The distributionfunction for area is shown in figure 8.5.) Formation volume factor (FVF)Values for formation volume factor typically range fromapproximately 1.0 bbl/STB for crude oil containing little orno solution gas to nearly 3.0 bbl/STB for highly volatileoils (Al-Marhoun, 1992). In the present study a uniformdistribution taking into account all possible values of FVFbetween 1 and 3 are considered. The distribution curve forFVF is shown in figure 9.Figure 7: Uniform net pay distribution curve4.) Area(A)In the present computation an assumed value equals to 6SKM of area is considered.The area for a structural closure is estimated from the lastclosing contour of the structure or from the oil watercontact (OWC). It is observed in general that there exist atransition zone between base of clean oil bearing zone andoil water contact (OWC) or free water level. Part of thearea which is present in the transition zone in the subsurface will contribute to water production with oil.Therfore the area above the base of clean oil bearing zoneshould be considered for volume estimation. However topof trasition zone may not always be known accuratelywhich imposes an uncertainty on area estimation.Figure 9: Uniform FVF distribution curveResultsVolumetric estimation (PIIP in million barrels) has beencarried out using Monte-Carlo Simulation for the two caseswith 1000 trials. The results are discussed below:1.) Stochastic estimation using standard distributionfunction:In first case, the stochastic volumetric estimation byMonte-Carlo Simulation is carried out using standarddistribution functions. The PIIP (MMBBLS) probabilityand cumulative probability distribution plots are shown infigure 10.2.) Stochastic estimation using customized distributionfunction:Figure 8: Uniform area distribution curveIn second case, the stochastic volumetric estimation byMonte-Carlo Simulation is carried out using customizeddistribution functions. The PIIP (MMBBLS) probabilityand cumulative probability distribution plots are shown infigure 11.11th Biennial International Conference & Exposition
Volume Estimation by Monte-Carlo Simulation using Customized Distribution FunctionsFigure 12: Comparison plot showing differences inpercentiles in two stochastic casesFigure 10: PIIP (MMBBLS) probability and cumulativedistribution plots using standard distribution functionsFigure 11: PIIP (MMBBLS) probability and cumulativedistribution plots using customized distribution functionsThe percentile values (P10-P90) along with absolute valuesof difference between two estimates are plotted in order todraw a comparison between two cases (figure 12). It can beobserved from plot that there is a measureable difference intwo cases.Conclusions Accurate determination of volume estimation isessential to assess the economic viability of any E&Passet.Reservoir properties (porosity, water saturation etc.) arenot single valued function rather a range of values existfor each of these parameters. In conventional method of volume estimation byMonte-Carlo Simulation, assumed standard distributionfunction (normal, gamma etc.) may not always considerthe actual variation of reservoir properties i.e. thestandard distribution function assumed may not fit theactual data. The present study reflect that there is a measureabledifference in volume estimates by Monte-CarloSimulation using both standard as well as customizeddistribution function for reservoir properties. The difference in percentile values for two stochasticcases observed with present data set is as large as 2.25MMBBLS (P90). A customized distribution function which fits the actualvariation in the values of reservoir properties isrecommended for better accuracy in volume estimationby Monte-Carlo Simulation.ReferencesAl-Marhoun M.A., 1992, New correlations for formationvolume factors of oil and gas mixtures; JCPT,Volume 31 No. 3, 22-26.Ellis, D. V. and Singer, J.M., 2008, Well Logging forEarth Scientists (Second Edition). Netherland:Springer.Glower, P., 2001, Petrophysics MSc course notes.Lipschutz, S. and Schiller, J. J., 2005, Schaum’s outline oftheory and problems of introduction to probabilityand statistics.11th Biennial International Conference & Exposition
Volume Estimation by Monte-Carlo Simulation using Customized Distribution FunctionsSuslick, S. B., Schiozer, D. and Rodriquez, M. R., 2009,Uncertainty and Risk Analysis in PetroleumExploration and Production; TERRAE, 30-41.Thander, B., Sircar, A. and Karmakar G.P., 2014,Hydrocarbon Resource Estimation: Application ofMonte-Carlo Simulation; IJLTEMAS, Volume III,Issue IV, 30-47.Yashrakshita, 2013, Estimating Uncertainty in Well LogAnalysis by Monte-Carlo Simulation, 10th BiennialInternational Conference & Exposition, SPG, PID: P005https://en.wikipedia.org/wiki/Monte Carlo methodAcknowledgementsThe authors are thankful to Mr. M. K. Surana, CEO-PrizePetroleum, Dr. Prabhakar Thakur, DGM-Prize Petroleumand Mrs. Kavita Bhardwaj, Manager-Prize Petroleum, fortheir continual support and encouragement during thetenure of this work.11th Biennial International Conference & Exposition
Monte-Carlo Simulation, assumed standard distribution function (normal, gamma etc.) may not always consider the actual variation of reservoir properties i.e. the standard distribution function assumed may not fit the actual data. The present study reflect that there is a measureable difference in volume estimates by Monte-Carlo .