Transcription
HR Shared ServicesBenchmarking Study HighlightsScottMadden and APQC HR Shared ServicesBenchmarking StudyJuly 2016Copyright 2016 ScottMadden, Inc. All rights reserved.Overhead 2016
IntroductionAbout the SurveySurvey Project and Timeline Identified gaps in HRSS benchmarking data specific to service center andcenter of expertise (CoE) staffing and performance metrics Engaged APQC to conduct study; ScottMadden designed questions Leveraged APQC’s benchmarking methodology and member network Conducted four cycles to date: Fall 2011 Fall 2012 Fall 2013 – Winter 2014 Fall 2015 – Winter 20161Copyright 2016 by ScottMadden, Inc. All rights reserved.
IntroductionAbout the Study Targeted HR shared services organizationsthat include a service center and CoEsNew questions wereincluded this year toexamine global deliverymodels, staffing, andperformance across globalregions Included scope covering four major areas,with a mix of qualitative and quantitativequestionsDelivery Model andOperationsStaffingPerformanceSSO ManagementInfrastructure andTechnology36 Metrics14 Qualitative Questions2Copyright 2016 by ScottMadden, Inc. All rights reserved.
IntroductionMetrics List Total customers (employees retirees) per total HR headcountTotal company employees per HRIS headcountTotal company employees per continuousimprovement headcountTotal company employees per talent acquisition CoEheadcountTotal company employees per talent managementCoE headcountTotal company employees per compensation CoEheadcountTotal company employees per benefits CoEheadcountTotal company employees per employee and laborrelations CoE headcountTotal company employees per HR business partnerheadcountTotal company employees per HR generalistheadcountTotal company employees per HR administratorheadcountTotal company employees per field HR headcountHR service center employee turnover for NorthAmerican Shared Services Center Average speed to answer for North American SharedServices CenterFirst contact resolution for North American SharedServices CenterPortal hits per 1,000 employees for North AmericanShared Services CenterTotal service center cost per customer (employees retirees)Total requisitions per North American SharedServices Center recruiting/staffing specialistheadcountTotal hires handled per North American SharedServices Center recruiting/staffing specialistheadcountTotal company employees per North American ShareServices Center recruiting/staffing service centerspecialist headcountTotal company employees per North AmericanShared Services Center workforce administrationspecialist headcountTotal company employees per North AmericanShared Services Center training administrationspecialist headcountStudy participants receive detailed data for the full set of metrics in the study3Copyright 2016 by ScottMadden, Inc. All rights reserved.
IntroductionMetrics List (Cont’d) Total company employees per North AmericanShared Services Center leave of absenceadministration specialist headcount Total company employees per North AmericanShared Services Center employee relationsspecialist headcount Number of transactions per service center employee Number of calls/inquiries per service centeremployee Number of employees served per service centeremployee Number of retirees served per service centeremployee Self-service transaction volume per employee Self-service inquiry per employee Tier 1 employees per Tier 1 manager/supervisors Transaction volume per Tier 1 employee4Copyright 2016 by ScottMadden, Inc. All rights reserved. Call/inquiry volume per Tier 1 employeeTier 2 employees per Tier 2 manager/supervisorsTransaction volume per Tier 2 employeeCall/inquiry volume per Tier 2 employee
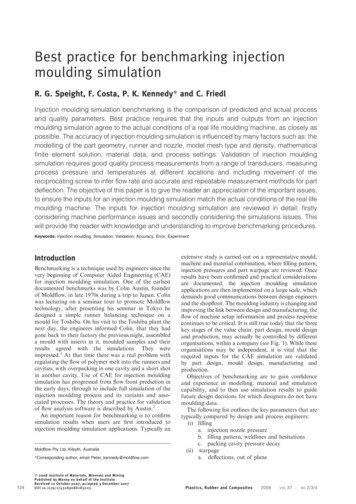
IntroductionParticipant DemographicsOur benchmark study includes data on more than 275 sharedservices centers from more than 100 organizations, acrossrevenue ranges, industries, and operating maturities. The majority of this year’s participants come from mature shared servicesoperations (SSOs)Organization RevenueEmployees ServedSSO Maturity16%18%30%35%46%60%23%37%35%Small ( 3 billion or less)10,000 or lessLess than five yearsMedium (Between 3 billion and 10 billion)Between 10,000 and 20,000At least five years but less than ten yearsLarge ( 10 billion or greater)20,000 or moreTen or more years5Copyright 2016 by ScottMadden, Inc. All rights reserved.
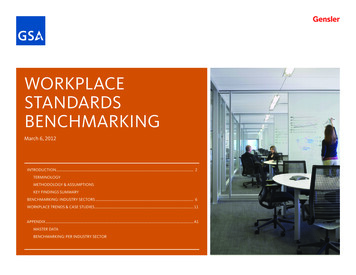
Survey HighlightsShared Services Center CharacteristicsA variety of global models exist; more than 70% of therespondents that have global operations indicate a GBSmodel.Which of the following geographic models is used?2%2% 11%Single global center24%14%GBS Model: 72%Regional centers, with global management and integrationSite/country-specific centers with global management and integrationRegional centers, but run locallySite/country-specific center run locallyOther47%6Copyright 2016 by ScottMadden, Inc. All rights reserved.
Survey HighlightsShared Services Center LocationsTop US Service Center Locations1.2.3.4.5.6.7.8.9.10.New York, NYChicago, ILCharlotte, NCPhoenix, AZHouston, TXMinneapolis, MNPittsburgh, PAAndover, MAAtlanta, GABaltimore, MDLocation of Service Centersin StudyNorth America55%EMEAAsia PacificLatin America27%16%2%7Copyright 2016 by ScottMadden, Inc. All rights reserved.Top Global Service Center Locations1.2.3.4.5.6.7.8.9.10.London, United KingdomSingapore, SingaporeDubai, UAEHong Kong, Hong KongShanghai, ChinaBangalore, IndiaMelbourne, AustraliaPrague, Czech RepublicBeijing, ChinaDublin, Ireland
Survey HighlightsShared Services Center Global Reach EMEA and Asia Pacific areboth primarily served byin-region SSCs Latin America is nearlyequally served by SSCswithin and outside of theregionCustomer Geographies Served by SSCs in Each RegionNorth AmericaNorthAmericaSSCs97%EMEASSCs91%Asia PacificAsiaPacificSSCs93%8Copyright 2016 by ScottMadden, Inc. All rights reserved.EMEALatin AmericaLatinAmericaSSCs,46%NorthAmericaSSCs, 23%EMEASSCs,31%North America SSCsEMEA SSCsAsia Pacific SSCsLatin America SSCs
Survey HighlightsDelivery Model and Operations – Organization Structure A tiered approach continues to be most common for service center staffing Use of a tiered model does not appear related to SSO maturityIs a tiered approach used as part of the service centerstaffing model?100%80%78%60%65%66%56%40%20%0%20129Copyright 2016 by ScottMadden, Inc. All rights reserved.201320142015
Survey HighlightsDelivery Model and Operations – Specialist Staffing Among Tier 2 specialist groups,workforce administration andrecruiting and staffing groups showthe highest staffing levels, whiletraining administration and leave ofabsence administration groupsshow the lowest staffing levelsTotal company employees per SSCspecialist headcountRecruiting/StaffingWorkforce AdministrationTraining AdministrationLeave of AbsenceAdministrationEmployee Relations010Copyright 2016 by ScottMadden, Inc. All rights reserved.3,0006,0009,000
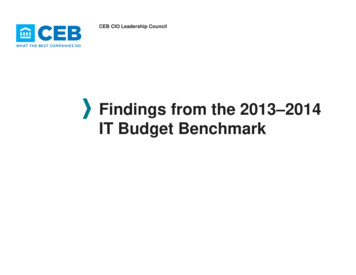
Survey HighlightsDelivery Model and Operations – CoEs Almost 90% employ CoEs as part oftheir model Staffing levels vary by type of CoE,but talent acquisition and employeeand labor relations CoEs generallyshow higher staffing levels relative tocompany employeesDoes your SSO have defined CoE as partof your HR delivery model?Total company employees per CoEheadcountTalent AcquisitionTalent ManagementCompensation11%BenefitsEmployee and LaborRelations89%11YesNoCopyright 2016 by ScottMadden, Inc. All rights reserved.03,0006,0009,000
SummaryTop-Performer CharacteristicsAn analysis of top performing organizations across keymetrics in the study was used to identify commoncharacteristics.Top performers Are more mature Are part of a global SSO Are governed by a lead HR executive Use a tiered approach with higher use of Tier 2 specialists Use more robust portals Use more self-service12Copyright 2016 by ScottMadden, Inc. All rights reserved.
SummaryOverall Findings A variety of global models exist; more than 70% of the respondents thathave global operations indicate a GBS model. Companies with greaterglobal integration exhibit lower service center cost and overall HR staffing North American service centers have relatively higher staffing levels but aremore efficient in handling transactions and inquiries A tiered approach continues to be most common for service center staffing The use of robust portals has trended up, and self-service is the norm Top-performing SSOs continue to have better staffing ratios and are moreefficient and cost effective in their operations Mature service centers are more likely to leverage the top-performercharacteristics and thus reap greater benefits13Copyright 2016 by ScottMadden, Inc. All rights reserved.
SummaryWant to Find Out How You Compare?1. Contact us at info@scottmadden.com2. We will contact you when we begin our next cycle in spring 2017 There is no cost to participate All participants receive a detailed reportof all metrics and qualitative results Peer group comparisons are providedwhere relevant14Copyright 2016 by ScottMadden, Inc. All rights reserved.
Thank YouType nameScottB. ManninghereType rate & SharedServices Practice LeadType title herePartnerScottMadden, Inc.2626 Piedmont3495GlenwoodRoadAvenueSuite 48010, Suite madden.comsbmanning@scottmadden.comO: 404-814-0020919-781-4191 M: 404-456-1176xxx-xxx-xxxxScottMadden, Inc.3495 Glenwood2626Piedmont RoadAvenueBuildingSuite48010, Suite 805Atlanta, @scottmadden.comO: 919-781-4191404-814-0020 M: 919-824-7560xxx-xxx-xxxx15Copyright 2016 by ScottMadden, Inc. All rights reserved.
Targeted HR shared services organizations . American Shared Services Center . of your HR delivery model? Yes No 0 3,000 6,000 9,000 Employee and Labor Relations Benefits Compensation Talent Management Talent Acquisition Total company employees per CoE headcount .