Transcription
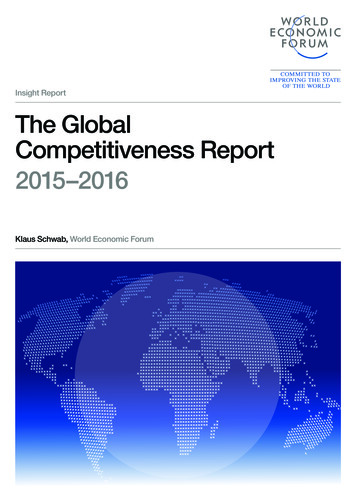
National Science BoardScience and Engineering Indicators2018OUR NATION’S FUTURE COMPETITIVENESSRELIES ON BUILDING A STEM-CAPABLE U.S. WORKFORCEA Policy Companion Statement to Science and Engineering Indicators 2018The number of jobs in the United States (U.S.) requiring substantial science, technology, engineering, and mathematics(STEM) expertise has grown nearly 34% over the past decade. As of 2015, nearly one in seven workers with at least afour-year degree say that their job requires a “bachelor’s level” of STEM expertise.1 Another 16 million skilled technicaljobs–more than one in nine–do not require a bachelor’s degree, yet require significant expertise in at least onetechnical field.2At the same time, other countries are challenging U.S. leadership in science and technology. Between 2000 and 2014,the number of Americans with a four-year degree in S&E grew by 53% (483,764 to 741,763); in China, this number was360% (359,478 to 1,653,565).3 China’s investments in higher education and research and development (R&D) havefueled the rapid growth of its high-technology industries.4 Their high-tech manufacturing output now ranks numbertwo in the world, trailing only the U.S.5 China is not alone–other countries are increasing investments in R&D andeducation to compete with the U.S. (Figure 1).6We Must Take Advantage of our Nation’s Greatest Asset–Our PeopleAs science and technology transform our economy and global competition grows, our Nation must focus on its greatestasset–our people. The U.S. can no longer rely on a distinct and relatively small “STEM workforce.”7 Instead, we needa STEM-capable U.S. workforce that leverages the hard work, creativity, and ingenuity of women and men of all ages,all education levels, and all backgrounds.8 We need scientists searching for cures for genetic disorders, engineersrevolutionizing and securing our electrical grid, skilled technicians improving the operations of our research facilitiesand hospitals, and farmers producing healthier crops utilizing new technologies that at the same time consume fewerresources.A STEM-capable workforce provides the U.S. with an enduring competitive advantage. Building and sustaining it willrequire cooperation and commitment from local, state, and federal governments, education institutions at all levels,non-governmental organizations, and businesses large and small. As a nation, we must work together to ensure allsegments of our population have access to affordable, high-quality education and training opportunities beginningas early as kindergarten and lasting well beyond graduation. Today’s workers need “on-ramps” to develop the STEMexpertise and other critical capabilities so they can adapt and thrive.9 Most of all, we must ensure that no Americansare left behind. All our people must be armed with the skills and knowledge to meet the future head on.Among the groups that are underutilized, yet essential to our future competitiveness, are workers who use technicalskills in their jobs but who do not have a four-year degree (“skilled technical workers”) and people at all educationlevels who have been historically underrepresented in STEM. Growing the skilled technical workforce and reducingbarriers to participation in STEM will increase individual economic opportunity and support our Nation’s leadership inscience and technology.Advance Publication Copy, NSB-2018-7National Science Board NationalScienceBrd@nsf.gov 703.292.7000NSB Indicators Resource Page nsf.gov/nsb/seiNational Science Foundationnsf.gov/statistics/indicators NSB-2018-7
The Skilled Technical WorkforceThe most important and defining feature of a STEM-capable U.S. workforce is that it leverages the talents of people atall education levels and in all sectors. It not only includes traditional scientists and engineers performing research inuniversity, government, or industry labs, but also “skilled technical workers” who can install, repair, debug, and build, butwho do not have four-year degrees.10Though sometimes overlooked, the skilled technical workforce is large and diverse. These workers can be found in cities,towns, and rural areas throughout the U.S. Estimates of the size of the skilled technical workforce vary from just over 6.1million to over 16.1 million. The size of this workforce is growing. The composition of this segment of the U.S. workforceclosely mirrors U.S. population demographics. In 2015, about 13% of skilled technical workers in STEM jobs were black,10% were Hispanic, 4% were Asian, and about 11% were foreign born.11These workers are a crucial component of almost every sector of the U.S. economy, ranging from “blue collar”occupations, such as installation, maintenance, and repair, to healthcare and computer occupations. Skilled technicalworkers are also critical to the operation of our Nation’s research infrastructure. The Nobel-Prize winning discovery ofgravitational waves at NSF’s Laser Interferometer Gravitational-Wave Observatory (LIGO) would not have been possiblewithout the invaluable expertise of the people who assemble and maintain the facility’s large and complex heating,ventilation, vacuum, air conditioning, and electronic systems.Skilled technical jobs are in high demand and pay well. In 2015, the median earnings of skilled technical workers in S&E( 60,000) or S&E-related ( 45,000) occupations were significantly higher than the median earnings in other occupations( 29,000).12 These occupations are expected to have the fastest growth over the next decade.13 Despite this, employersin 80% of local areas said they had trouble filling jobs in occupations that depend on skilled technical workers, accordingto a survey conducted by the Government Accountability Office.14 Coordinated policies and investments aimed atbuilding and strengthening on-ramps into skilled technical careers will help address labor market demands, increase thenumber of STEM-capable workers, and provide workers with the knowledge and skills needed to adapt to an evolvingworkplace.Groups Underrepresented in STEMThe National Science Board believes that America’s demographic diversity is a distinct competitive advantage. Researchshows that diverse companies have better strategies, are more innovative, and win economically.15 Numerous entities,including the National Science Foundation (NSF), have undertaken a myriad of initiatives spanning decades aimed atleveraging the talents of all segments of our population, especially groups historically underrepresented in STEM. Yet, inspite of some progress, crippling disparities in STEM education remain (Figure 2).Although women have earned about half of all science and engineering (S&E) bachelor’s degrees since the late 1990s,their levels of participation vary widely across S&E fields (Figure 3). The proportion of bachelor’s degrees awardedto women in high demand fields such as computer sciences (18%) and engineering (20%) remain low.16 Overall,while women occupy half of all jobs in the U.S. workforce, they constitute slightly less than 28% of workers in S&Eoccupations.17The talents of minority groups in the U.S. are perhaps our greatest untapped resource. Hispanics, blacks, and AmericanIndians or Alaska Natives together make up 27% of the U.S. population age 21 and older, but only 15% of those whohold their highest degree in S&E and 11% of workers in S&E occupations.18 The proportion of S&E bachelor’s degreesawarded to blacks remained flat at 9% between 2000 and 2015 (32,993 to 53,649).19 These gaps are even morepronounced at the doctoral level where blacks earned 4% of all S&E doctoral degrees awarded in 2015.20 In 2015, blacksaccounted for 12% of the U.S. population 21 or older but only 5% of S&E job holders.21 The negative consequences ofthese gaps will only grow: according to a recent report, nearly 25% of black workers are concentrated in 20 occupationsthat are at high risk of automation, such as cashiers, cooks, security guards, drivers, and administrative assistants.222
The share of bachelor’s degrees in S&E awarded to Hispanics increased from 7% (27,980) to 12% (79,203) between 2000and 2015.23 Despite these gains, Hispanics accounted for 6% of employment in S&E occupations in 2015, well belowtheir share of the U.S. population age 21 and older (15%).24 The proportion of bachelor’s degrees earned by Hispanicsin high-demand fields such as computer science (10%) and engineering (10%) remain low.25 The changing demographicsof the U.S. population will amplify the consequences of these gaps since increased enrollment in higher education isexpected to come mainly from minority groups, particularly Hispanics.Military veterans returning from deployment are another group whose skills are often underutilized. Many possesstechnical training and have significant experience with advanced technologies and systems.26 Several initiatives focusedon academic advising, internships, networking services and peer support are underway to alleviate the roadblocksthat veterans encounter as they enter the civilian workforce.27 To help inform these efforts, the National ScienceFoundation’s National Center for Science and Engineering Statistics is beginning to collect data that will reveal therelationship between education and career pathways for veterans with four-year degrees.Attracting and Retaining the Best Internationally Mobile StudentsUp to this point, our Nation has compensated for the failure to take full advantage of all segments of the population byattracting the best students from around the globe. This is especially true at the graduate degree level, where foreignborn28 students earn over one-third of all U.S. STEM doctorates, including nearly half of the degrees in engineering andcomputer science.29 While the U.S. remains the top destination for internationally mobile students, its share of thesestudents declined from 25% in 2000 to 19% in 2015 as other countries increasingly compete for them.30Our Nation’s ability to attract students from around the world is important, but our competitive advantage in this areais fully realized when these individuals stay to work in the United States post-graduation. The overall “stay rates” forforeign-born non-citizens who received a Ph.D. from U.S. institutions have generally trended upwards since the turn ofthe century, reaching 70% for both the 5-year and 10-year stay rates in 2015.31 However, the percentage of new STEMdoctorates from China and India—the two top countries of origin—with definite plans to stay in the U.S. has declinedover the past decade (from 59% to 49% for China and 62% to 51% for India).32 As other nations build their innovationcapacity through investments in R&D and higher education, we must actively find ways to attract and retain foreigntalent and fully capitalize on our own citizens.Building the U.S. Workforce of the Future Requires Our Collective EffortSTEM knowledge and skills will continue to play a critical role in fostering individualopportunity and national competitiveness. Strengthening a diverse STEM-capableU.S. workforce that leverages the talents of all segments of our population has neverbeen more important. Considering the increasing demands placed on students,workers, businesses, and government budgets, institutions must partner to build theU.S. workforce of the future. These joint efforts are necessary in order to prosper inan increasingly globally competitive knowledge- and technology- intensive world. Governments at all levels should empower all segments of our populationthrough investments in formal and informal education and workforcedevelopment throughout an individual’s life-span. This includes redoubling ourcommitment to training the next generation of scientists and engineers throughsustained and predictable Federal investments in graduate education and basicresearch.3NSF must continue to do its part.In recognition of theimportance of catalyzingcross-sector partnerships, NSFlaunched the Inclusion acrossthe Nation of Communities ofLearners of UnderrepresentedDiscoverers in Engineering andScience (INCLUDES) programin 2016. INCLUDES aims toexpand the composition ofthe STEM-capable workforceby developing scalable waysto grow the STEM-capableworkforce by building newand strengthening existingpartnerships.
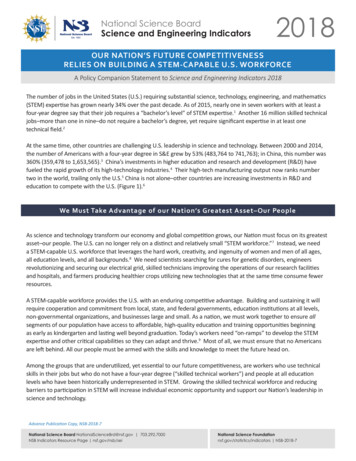
Businesses should invest in workplace learning programs–such as apprenticeships and internships–that utilize localtalent. By leveraging partnerships between academic institutions and industry, such as those catalyzed by NSF’sAdvanced Technological Education Program (ATE), businesses will be less likely to face a workforce “skills gap.” Governments and businesses should expand their investments in community and technical colleges, whichcontinue to provide individuals with on-ramps into skilled technical careers as well as opportunities for skill renewaland development for workers at all education levels throughout their careers. To accelerate progress on diversifying the STEM-capable U.S. workforce, the Nation should continue to invest inunderrepresented segments of the population and leverage Minority Serving Institutions to this end.33Collectively, we must proceed with urgency and purpose to ensure that this Nation and all our people are ready to meetthe challenges and opportunities of the future.FIGURE 1: Gross domestic expenditures on R&D, by the U.S., China, and selected other countries: 2000–2015EU European Union; PPP purchasing power parityNotes: Data are selected R&D-performing countries and the EU. Data are not available for all countries for all years. Data for the United States in this figurereflect international standards for calculating gross expenditures on R&D, which vary slightly from the National Science Foundation’s protocol for tallyingU.S. total R&D.Sources: National Science Foundation, National Center for Science and Engineering Statistics, National Patterns of R&D Resources (annual series); Organisation for Economic Co-operation and Development, Main Science and Technology Indicators (2017/1); United Nations Educational, Scientific and CulturalOrganization Institute for Statistics Data Centre, data.uis.unesco.org, accessed 13 October 2017. Adapted from Figure 4-6, Science and Engineering Indicators2018. (Also see Appendix Table 4–12.)4
FIGURE 2: Share of S&E bachelor’s degrees among U.S. citizens and permanent residents: 2000-15By race and ethnicityNotes: Hispanic may be any race. American Indian or Alaska Native, Asian or Pacific Islander, black or African American, and white refer to individuals who arenot of Hispanic origin.Sources: National Center for Education Statistics, Integrated Postsecondary Education Data System (IPEDS), Completions Survey; National Science Foundation, National Center for Science and Engineering Statistics, WebCASPAR database, https://ncsesdata.nsf.gov/webcaspar/. Adapted from Figure 2-12, Scienceand Engineering Indicators 2018.FIGURE 3: Women in S&E occupations: 1993–2015Notes: National estimates were not available from the Scientists and Engineers Statistical Data System (SESTAT) in 2001.Sources: National Science Foundation, National Center for Science and Engineering Statistics, SESTAT (1993–2013), https://www.nsf.gov/statistics/sestat/,and the National Survey of College Graduates (NSCG) (2015), https://www.nsf.gov/statistics/srvygrads/. Adapted from Figure 3-27, Science and EngineeringIndicators 2018.5
627282930313233Survey data collected using the National Survey of College Graduates (NSCG) showed that 19,366,000 respondents stated that their job requires S&E technicalexpertise at the bachelor’s level. See National Science Board, Science and Engineering Indicators 2018 (Alexandria, VA: National Science Board, 2018), Table 3-3.For more information on the NSCG, see https://nsf.gov/statistics/srvygrads/#sd.Jonathan Rothwell, “Defining Skilled Technical Work,” (Washington, DC: National Academies, 2015). Retrieved from: te/documents/webpage/pga 167744.pdf.Indicators 2018, Appendix Table 2-35.The pace of China’s increase in R&D performance (measured as expenditures) has been exceptionally high over numerous years, averaging 20.5% annually over2000–10 and 13.9% for 2010–15 (or 18.0% and 12.0%, respectively, when adjusted for inflation). This represents an increase in gross expenditures on R&D andexpenditures for R&D (GERD) from 40.4 billion in 2000 to 371.6 billion in 2015 (2009 constant PPP billions). Indicators 2018, Appendix Table 4-12.Indicators 2018, 6-5.For example, between 2000 and 2010 South Korea experienced 11% average annual growth in R&D spending and 7.3% growth rate between 2010-15 (or 8.6%and 5.5%, respectively, when adjusted for inflation). South Korea now accounts for 4% of global R&D spending. Indicators 2018, Appendix Table 4-12.According to the Bureau of Labor Statistics (BLS), the majority of net job openings (57%) and largest growth rate (15%) in NSF-identified S&E occupations forthe period 2014-2024 are projected to be in computer and mathematical science occupations. Engineering occupations, the second largest subcategory ofS&E occupations, are expected to generate about one-fourth (27%) of all job openings in S&E occupations during the same period. It is important to note thatprojected changes in the labor force and employment do not necessarily imply a labor shortage or surplus. For more on BLS occupational projections, seehttps://www.bls.gov/emp/.Paul M. Romer, “Human capital and growth: Theory and evidence,” Carnegie-Rochester Conference Series on Public Policy 32, no. 1 (Spring 1990): 251-286;Eric A. Hanushek and Ludger Woessmann, “Do better schools lead to more growth? Cognitive skills, economic outcomes, and causation,” Journal of EconomicGrowth 17, no. 4 (December 2012): 267-321.Other critical capabilities include communication skills, the ability to work in teams, and problem solving and critical thinking skills.In November 2017, the National Science Board established a Task Force on the Skilled Technical Workforce. For more information, see https://nsf.gov/nsb/committees/stwcmte.jsp.In 2015, the corresponding shares among workers in STEM occupations with four-year degrees were 7% black, 6% Hispanic, 17% Asian, and 24% foreign born.Indicators 2018, 3-84.Indicators 2018, 3-84.For more information on employment projections published by the Bureau of Labor Statistics, see https://www.bls.gov/emp/ep table 103.htm.For example, employers had trouble filling jobs in the following occupational categories: Installation, Maintenance, and Repair; Construction and Extraction;Healthcare Practitioners and Technical Occupations; Production; and Computer and Mathematical Occupations. In the report, the term “local areas” refers tothe areas overseen by both local and statewide Workforce Investment Boards (WIBs). For more information, see https://www.gao.gov/assets/660/659322.pdf.See Robin J. Ely and David A. Thomas, “Cultural Diversity at Work: The Effects of Diversity Perspectives on Work Group Processes and Outcomes,” AdministrativeScience Quarterly 46, 2 (June 2001): 229-273; David A. Thomas, “Diversity as Strategy,” Harvard Business Review 89, no. 9 (September 2004): 98; Sylvia AnnHewlett, Melinda Marshall, and Laura Sherbin, “How diversity can drive innovation,” Harvard Business Review 91, no. 12 (December 2013): 30; Vivian Hunt,Dennis Layton and Sara Prince, Diversity Matters (McKinsey & Company, 2015). Retrieved from: zation/our-insights/why-diversity-matters.National Science Foundation, Women, Minorities, and Persons with Disabilities in Science and Engineering (Arlington, VA: National Center for Science andEngineering Statistics, 2017). Retrieved from: t/about-this-report/.Indicators 2018, 3-8.Indicators 2018, 3-8.Indicators 2018, Appendix Table 2-22.Indicators 2018, Appendix Table 2-32.Indicators 2018, Table 3-19.Spencer Overton, “The Impact of Automation on Black Jobs,” (Washington, DC: Joint Center for Political and Economic Studies, 2017). Retrieved from: mpact%20of%20Automation%20on%20Black%20Jobs.pdf. For the impact on innovation, see David Leonhardt, “LostEinsteins: The Innovations We’re Missing,” New York Times, 3 December 2017. Retrieved from: nsteinsinnovation-inequality.html.These rates are for U.S. citizens and permanent residents as a proportion of all earned bachelor’s degrees awarded in S&E. Indicators 2018, Appendix Table 2-22.Indicators 2018, 3-116.Indicators 2018, Appendix Table 2-22.Numerous programs designed to maximize employment opportunities for veterans have focused on helping veterans transition from the military to the civilianworkforce. These programs range from changes to the GI Bill, the Transition Assistance Program, and Vocational Rehabilitation and Employment services. For anoverview of the range of transition programs for veterans as well as key challenges, see National Academies, “Building America’s Skilled Technical Workforce,”(Washington, DC: National Academies Press, 2017), 115-121.See H.R.3218 - Harry W. Colmery Veterans Educational Assistance Act of 2017, -bill/3218/text?q %7B%22search%22%3A%5B%22hr 3218%22%5D%7D&r 1.Foreign-born is a broad category, ranging from long-term U.S. residents with strong roots in the United States to recent immigrants who compete in global jobmarkets and whose main social, educational, and economic ties are in their countries of origin.Indicators 2018, Appendix Table 2-29.According to data from UNESCO/UIS, the number of internationally mobile students who pursued a higher education degree more than doubled between 2000and 2014, to 4.3 million. For discussion of internationally mobile students see Indicators 2018, 2-96.Long-term stay rates indicate the degree to which foreign-born non-citizens recipients of U.S. S&E doctorates enter and remain in the U.S. workforce to pursuetheir careers. The 10-year and 5-year stay rates in 2015 refer to the proportion of 2005 and 2010 graduating cohorts, respectively, who reported living in theUnited States in 2015. See Indicators 2018, Table 3-27.Indicators 2018, Appendix Table 3-21.Minority Serving Institutions include Historically Black Colleges & Universities (HBCUs), Hispanic Serving Institutions (HSIs), and Tribal Colleges and Universities(TCUs).Advance Publication Copy, NSB-2018-7National Science Board NationalScienceBrd@nsf.gov 703.292.7000NSB Indicators Resource Page nsf.gov/nsb/sei National Science Foundationnsf.gov/statistics/indicators NSB-2018-76
The share of bachelor's degrees in S&E awarded to Hispanics increased from 7% (27,980) to 12% (79,203) between 2000 and 2015.23 Despite these gains, Hispanics accounted for 6% of employment in S&E occupations in 2015, well below their share of the U.S. population age 21 and older (15%).24 The proportion of bachelor's degrees earned by Hispanics .