Transcription
HR Shared Services BenchmarkingStudy HighlightsScottMadden and APQC HR Shared Services Benchmarking StudyOctober 2019Copyright 2019 by ScottMadden, Inc. All rights reserved.
IntroductionAbout the StudyHistory and Timelinen First cycle – Fall 2011n Second cycle – Fall 2012Delivery Model &OperationsStaffingPerformanceSSO ManagementInfrastructure andTechnologyn Third cycle – Fall 2013 to Winter 2014n Fourth cycle – Fall 2015 to Winter 2016n Fifth cycle – Spring 2017 to Summer 2017n Sixth cycle – Spring 2019 to Summer 201946 Metrics29 Qualitative QuestionsA few topics were added this cycle to assess adoption of artificial intelligence or intelligent automationapplications, robotic process automation maturity, and payroll services within HR.Copyright 2019 by ScottMadden, Inc. All rights reserved.1
IntroductionMetric ListnnnnnnnnnnnnnnnnnnnnnnnnTotal customers (employees retirees) served per total HR headcountTotal company employees served per total HR headcountTotal company employees served per HRIS headcountTotal company employees served per continuous improvement headcountTotal company employees served per HR business partner headcountTotal company employees served per HR generalist headcountTotal company employees served per HR administrator headcountTotal company employees served per field HR headcountTotal company employees served per talent acquisition CoE headcountTotal company employees served per talent management CoE headcountTotal company employees served per compensation CoE headcountTotal company employees served per benefits CoE headcountTotal company employees served per employee and labor relations CoEheadcountTotal company employees served per payroll CoE headcountTotal company employees served per payroll processing employee headcountNumber of employees served per HR shared services organization employeeNumber of retirees served per HR shared services organization employeeHR service center employee turnover for North American shared services centerAverage speed to answer for North American HR shared services centerFirst contact resolution for North American HR shared services centerPortal hits per 1,000 employees for North American HR shared services centerTotal requisitions per North American HR shared services centerrecruiting/staffing specialist headcountTotal hires handled per North American HR shared services centerrecruiting/staffing specialist headcountTotal company employees served per North American HR shared services centerrecruiting/staffing specialist headcountn Total company employees served per North American HR shared services centerworkforce administration specialist headcountn Total company employees served per North American HR shared services centertraining administration specialist headcountn Total company employees served per North American HR shared services centerleave of absence administration specialist headcountn Total company employees served per North American HR shared services centeremployee relations specialist headcountn Total North American HR shared services center cost per employeen Total North American HR shared services center cost per customer (employees retirees)n North American HR shared services center in-house cost per transactionn North American HR shared services center in-house cost per call/inquiryn Number of employees served per service center employeen Number of retirees served per service center employeen Number of employees served per tier 1 headcountn Number of employees served per tier 2 headcountn Number of tier 1 employees per tier 1 manager/supervisorn Number of tier 2 employees per tier 2 manager/supervisorn Number of transactions per service center employeen Number of calls/inquiries per service center employeen Self-service transaction volume per 1,000 employees servedn Self-service inquiry volume per 1,000 employees servedn Tier 1 transaction volume per tier 1 headcountn Tier 1 call/inquiry volume per tier 1 headcountn Tier 2 transaction volume per tier 2 headcountn Tier 2 call/inquiry volume per tier 2 headcountCopyright 2019 by ScottMadden, Inc. All rights reserved.2
About the StudyParticipant DemographicsOur benchmark study includes data on shared services operations (SSOs) across revenue ranges,industries, and operating maturities. The majority of participants come from mature SSOs.Organization Revenue 20B 15B to 20B 10B to 15B 5B to 10B 1B to 5B 500M to 1B 100M19%7%9%21%38%5%1%Maturity1 to 3 years,15%Employees Served 100,00080,000 to 100,00060,000 to 80,00040,000 to 60,00020,000 to 40,00010,000 to 20,000 10,000LATAM, 3% 10 years,32%APAC, 15%Europe,17%3 to 5 years,21%5 to 10years, 29%ServicesIndustrial ProductsConsumer Products/Packaged GoodsFinancial Services/Banking19%Healthcare27%Retail and tyInsuranceMEA, 2%Petroleum/ChemicalAutomotiveMedia and . &MiningCanada,Aerospace63%Rental13%5%1%8%9%Service Center 1 year, right 2019 by ScottMadden, Inc. All rights reserved.3
Highlights from Latest HR BenchmarksService Delivery Model and GovernanceUse of Tiered ModelMore organizations are using a tiered approach as part of their servicecenter staffing modeln Tier 1 median staffing is 1:545 relative to employees served84%n Tier 2 specialist roles are heavily utilized, and top performers show higherstaffing at Tier 2 versus Tier 1A decreasing number of organizations indicated reporting to corporateHR/lead HR executiveWhich best describes the governance model for your HR shared services organization?13%7%14%40%19%21%24%79%45%35%OtherHR SSO reports to another non-HR executiveHR SSO has a matrix reporting relationship to HR and multi-function SSOHR SSO reports to lead of multi-function SSOHR SSO reports to corporate HR/lead HR executive201520172019Copyright 2019 by ScottMadden, Inc. All rights reserved.4
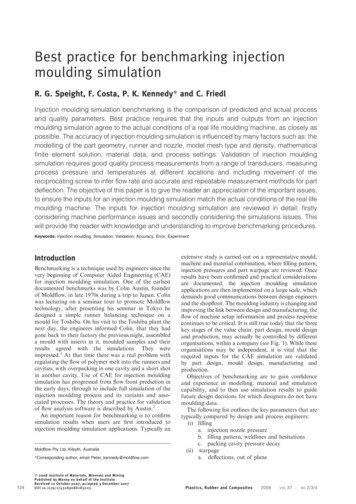
Highlights from Latest HR BenchmarksStaffing – Tier 2 SpecialistsAmong Tier 2 specialist groups, workforceadministration and employee relations groupsshow the highest staffing levels, while trainingadministration and leave of absenceadministration groups show the lowest staffinglevels.Median Number of Employees perService Center Specialist HeadcountRecruiting/StaffingWorkforce Administration3,2002,261Training Administration4,750Leave of Absence AdministrationEmployee Relations5,0502,363Copyright 2019 by ScottMadden, Inc. All rights reserved.5
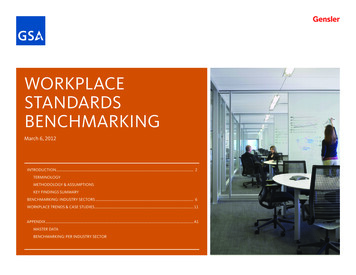
Highlights from Latest HR BenchmarksStaffing – CoEsMore than 80% of SSOs employ CoEs as part oftheir model. Staffing levels vary by type of CoE,but talent acquisition and employee and laborrelations CoEs generally show higher staffinglevels relative to company employees.Use of Centers of Expertise86%Median Number of Employees perCoE HeadcountBenefits4,258Compensation4,000Employee and Labor RelationsTalent AcquisitionTalent Management3,1001,0863,438Copyright 2019 by ScottMadden, Inc. All rights reserved.6
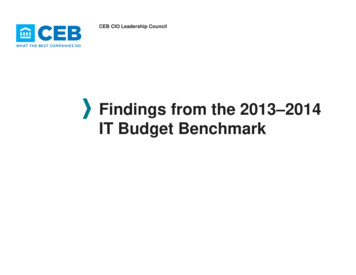
Highlights from Latest HR BenchmarksStaffing – Field HRShifting transactional work to service centersand/or leveraging technology enables field HR tooperate more efficiently. Top performers showlower use of the field HR administrator role andlower total field staffing.Median Number of Employees perField HR HeadcountTotal Field HRHR AdministratorHR GeneralistHR Business Partner4131,0561,4003,089Copyright 2019 by ScottMadden, Inc. All rights reserved.7
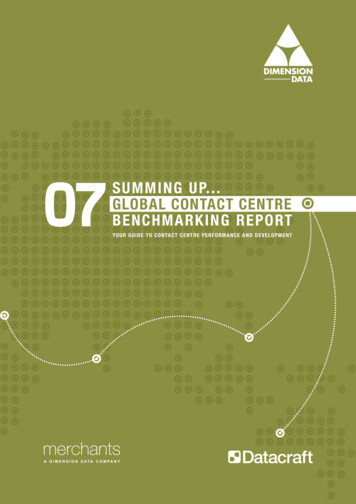
Highlights from Latest HR BenchmarksGlobal Operations78% of participants reportedusing a GBS modeln 10% have a single global centern 20% have regional centers withglobal management andintegrationn 48% have site/country-specificcenters with global managementand integration10%of participants operate witha single global centerGeographic Model68%of participants have regionalor country-specific centerswith global managementintegration22%of participants have a nonGBS model, includingregional centers runindependently, countryspecific centers, or othergeographic modelCopyright 2019 by ScottMadden, Inc. All rights reserved.8
Highlights from Latest HR BenchmarksGlobal Operations (Cont’d)North America has been the primary focus of our study and therefore remains the top location,followed by Europe.Service Center Location by RegionU.S. & Canada3%n Chicago, ILn New York, NYn London, United Kingdomn Hong Kong, Hong KongAPACn Charlotte, NCn Atlanta, GAn Dubai, United Arab Emiraten Shanghai, China15%n San Francisco, CAn Melbourne, Australian Philadelphia, PAn Houston, TXn Mumbai, Indian Hyderabad, Indian Seattle, WAn Denver, COn Gurgaon, Indian Prague, Czech Republicn Los Angeles, CAn Dallas, TXn Bangalore, Indian Dublin, Irelandn Milwaukee, WIn São Paulo, BrazilMEA2%LATAMTop Global LocationsEurope17%63%Top U.S. LocationsCopyright 2019 by ScottMadden, Inc. All rights reserved.9
Highlights from Latest HR BenchmarksStaffing – Service CenterTotal service center staffing across global regions varies, and the overall median is nearly 200employees per service center headcount.Number of Employees Served per Service Center EmployeeTop Quartile400300257Median205200204175Bottom Quartile1511000US & CanadaEuropeAsia-PacificAfrica & Middle EastCentral & SouthAmericaCopyright 2019 by ScottMadden, Inc. All rights reserved.10
Highlights from Latest HR BenchmarksTechnology StandardizationHalf of the participants have fully standardized to a single solution for HRIS and customer care tools.Global SSOs show slightly less standardization of payroll technologies compared to HRIS and ServiceCenter/Customer Care technologies.To what degree are your technology platforms standardized across your global centers?HRISPayrollService Center/Customer Care51%47%52%27%28%22%24%26%21%Single instance used across all centers (full standardization)Common tool used but different configurations for centers or regionsMultiple tools used with some centers using standard toolsNo common tools or standardizationCopyright 2019 by ScottMadden, Inc. All rights reserved.11
Highlights from Latest HR BenchmarksIntelligent AutomationMore than 40% of SSOs reported having implemented or are piloting IA applications within theirservice center. Another 35% are thinking about using.To what extent does your shared services center use intelligent automation applications?ImplementedBy IndustryConsumer Products/Packaged GoodsInsurance17%Retail and WholesaleHealthcareIndustrial ProductsConducting Pilot to Validate cial Services/BankingThinking about UsingPetroleum/ChemicalServices35%UtilityBy SizeNot UsingServing more than 50,000 employeesServing 10,000 to 50,000 employees24%Serving 5,000 to 10,000 employeesServing less than 5,000 employeesCopyright 2019 by ScottMadden, Inc. All rights reserved.12
Highlights from Latest HR BenchmarksIntelligent Automation (Cont’d)Among organizations who are harnessing the power of IA, the majority are using desktop automationfor simple transactional data or use rule-based RPA for structured data.Which of the following best describes your HR organization's maturity with regard to process automation?AI-Based Cognitive AutomationBy Industry6%Consumer Products/Packaged GoodsInsuranceHealthcareRetail and WholesaleKnowledge-Based Autonomic Process AutomationIndustrial Products9%AutomotivePharmaceuticalRules-Based Robotic Process AutomationFinancial op AutomationPetroleum/Chemical29%By SizeDo Not Use Automation to Any Significant Degree36%Serving more than 50,000 employeesServing 10,000 to 50,000 employeesServing 5,000 to 10,000 employeesServing less than 5,000 employeesCopyright 2019 by ScottMadden, Inc. All rights reserved.13
Highlights from Latest HR BenchmarksIntelligent Automation (Cont’d)40% of participants selected research/analytics/reporting as a purpose of using IA, followed by 39% forcall center replacement/augmentation via chat bots or virtual agents.For which purposes are you using intelligent automation applications?Research/Analytics/ReportingCall sDocument ht 2019 by ScottMadden, Inc. All rights reserved.14
Highlights from Latest HR BenchmarksIntelligent Automation (Cont’d)Lack of executive support was rated as the top challenge in adopting IA or cognitive capabilities,followed by availability of skilled resources or technical expertise.Main Challenges in AdoptingArtificial Intelligence orCognitive ComputingCapabilities1.Lack of executive support2.Availability of skilled resources ortechnical expertise3.Lack of organizational buy-in/readiness/cultural fit4.Degree of partner or stakeholder readiness5.Degree of customer readinessCopyright 2019 by ScottMadden, Inc. All rights reserved.15
Highlights from Latest HR BenchmarksPayroll in HRWithin which function are payroll serviceslocated within your company?How are payroll services delivered in Finance?How are payroll services delivered in HR?Service Center(s)Service Center(s)69%57%Center of Expertise46%Finance,32%Center of Expertise72%HR, 68%OtherOther6%0%Total Company Employees perPayroll Processing Employee Headcount2,310Total Company Employees perPayroll CoE Headcount5,1430Bottom 00Top QuartileCopyright 2019 by ScottMadden, Inc. All rights reserved.16
Top Performer AnalysisWho Are the Top Performers?An analysis of top-performing organizationsacross key metrics in the study was used toidentify common characteristics. Top performers:n Are more maturen Are larger entitiesn Have fewer centers (less distributed)n Use a tiered approachTop-Performer GroupComparison GroupSSO Maturity71%in operationfor five or more years59%in operationfor five or more yearsNumber of Employees Servedn Have higher use of Tier 2 specialistsn Remove administrative work from field HRn Use more robust portalsn Use more self-service38,215 employees served28,598 employees servedNumber of Centers in SSO1.3 centers within SSO2.0 centers within SSOCopyright 2019 by ScottMadden, Inc. All rights reserved.17
Want to Find Out How You Compare?n Contact us at info@scottmadden.comn Sign up to be notified of our next cyclen Unique benchmarking studyn No cost to participaten Receive detailed report of all metrics and qualitativeresultsn Peer group comparisons are provided where relevantCopyright 2019 by ScottMadden, Inc. All rights reserved.18
nAverage speed to answer for North American HR shared services center nFirst contact resolution for North American HR shared services center nPortal hits per 1,000 employees for North American HR shared services center nTotal requisitions per North American HR shared services center recruiting/staffing specialist headcount