Transcription
CEB CIO Leadership CouncilFindings from the 2013–2014IT Budget Benchmark
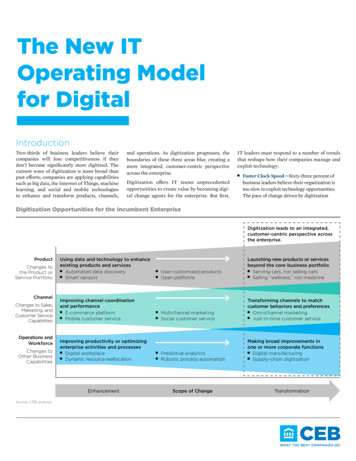
Participants in CEB’s2013–2014 IT BudgetBenchmarkingSurvey represent 165organizations and 47billion in IT spending. The survey’s scopeincludes:–Total IT expenditure–IT capital expendituresand IT project budgets–IT operating expenditureallocationsRESPONDENT PROFILEBy gistics5%Retail–Staffing andorganizational structure–IT service models. After data were collected,we conducted validationtests to surface responsesthat were inconsistent orimplausible. These datawere either corrected by therespondent or removed.This presentation often looksat the entire dataset. Visit ouronline analysis tool to accessdata cuts for your peergroups by industry, revenueband, oods8%Manufacturing/Chemicals11%Energy/Metals andMining–Outsourcing andoffshoringBy Headquarters h-Tech10%Asia-Pacific2%Africa/Middle East2%Latin America17%Europe69%North American 165.Source: CEB analysis.7%FinancialServices(ExcludingBanking /PublicSector/Non-Profit/Educationn 165.Source: CEB analysis. 2013 The Corporate Executive Board Company.All Rights Reserved. CIO7201913SYN5
THE STORY FOR 20141. CIOs expect 3% growth in Total IT Spending for 2014, at the median.2. IT organizations are investing less in new work environment opportunities, at the same time they say those opportunities are a priority.3. CIOs estimate that central corporate functions (outside of IT) are spending, on average, above 4% of their budgets on IT, primarily drivinginnovation in new work environment-focused projects.4. Despite flat IT staff growth for 2014, IT organizations will see considerable change in the mix of roles.5. CIOs remain ambitious about pursuing End-to-End IT Services, but the hurdles to implementation have slowed progress.6. Successful implementations of End-to-End IT Services have greatly changed the service delivery model of those organizations. 2013 The Corporate Executive Board Company.All Rights Reserved. CIO7201913SYN8
ROADMAP FOR THE PRESENTATIONIntroductionIT Spending LevelsSpending andOrganizationalTrendsKey Takeaways 2013 The Corporate Executive Board Company.All Rights Reserved. CIO7201913SYN9
CIOs report expectedgrowth for 2014 that ishigher than expectationsfrom previous years.Participants in CEB’s2013–2014 IT BudgetBenchmarkingSurvey represent 165organizations and 47billion in IT spending.STRONG FORECAST FOR 2014Median Expected Change in Total IT Expenditure from the Previous YearExpected Change, 2010–20144.0%3.0% This increase in ITexpenditure for 2014 (3.0% atthe median) is almost entirelydriven by expected increasesin operatingexpenditure (3.1%) as capitalexpenditure growth remainsflat 012–20132013–2014Source: CEB IT Budget Benchmarking Survey 2010-2013.Note: Total IT expenditure includes IT operating expenditure, depreciation/amortization, and IT capital expenditure. 2013 The Corporate Executive Board Company.All Rights Reserved. CIO7201913SYN10
Similar to theexpectations of thelast several years,capital expenditure isexpected to remainflat at the median.FLAT CAPEX FORECASTS AT THE MEDIANMedian Expected Change in IT Capital Expenditure from the Previous YearExpected Change, 2010–20140.6%0.6% At present, roughlytwo-in-five CIOs expect5% increases in capitalspending for 2014,while only 19% report anexpected 5% 012–20132013–2014Source: CEB IT Budget Benchmarking Survey 2010-2013.Percentage of Organizations Changing IT Capital Expenditure from the Previous YearExpected Change, 2011–2014100%Greater Than 5% Increase46%52%41%Less Than 5% ChangeGreater Than 5% 0%2011Source: CEB IT Budget Benchmarking Survey 2010-2013. 2013 The Corporate Executive Board Company.All Rights Reserved. CIO7201913SYN11
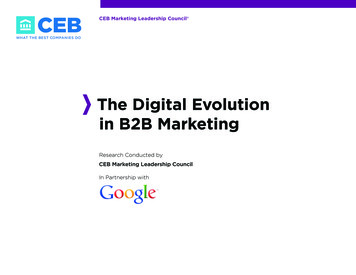
Flat capital expendituregrowth projections havehistorically given way togrowth, as additionalbudget for new projectsoften frees up over thecourse of the year asopportunities arise. CIOs expecting little changein their capital budgetfor 2014 should still build apipeline of potentialinvestments so as not to becaught short as additionalbudget becomes available.For roughly one-thirdof organizations, actualgrowth is consistent withtheir forecasts, however,approximately half oforganizations experiencemore positive actual growththan forecasted for the year.CAPEX ACTUALS OFTEN OUTPACE EXPECTATIONSMedian Change in IT Capital Expenditure from the Previous YearExpected Versus Actual, 2010–201426. 0%Expected23. –20120.3%0.0%2012–20132013–2014Source: CEB IT Budget Benchmarking Survey 2010-2013.Distribution of Expected and Actual IT Capital Expenditure ChangePercentage of Organizations, 2012–2013100%Greater Than 5% IncreaseLess Than 5% Change29%58%50%Greater Than 5% 2013(Actual)n 52 organizations participating in CEB’s 2012–2013 IT Budget Benchmark and CEB’s 2013–2014 IT Budget Benchmark.Source: CEB 2013–2014 IT Budget Benchmarking Survey; CEB 2012–2013 IT Budget Benchmarking Survey. 2013 The Corporate Executive Board Company.All Rights Reserved. CIO7201913SYN12
While a 3.1% expectedincrease in IT operatingexpenditure seemsmodest, it more thancovers inflation. The 3.1% median expectedincrease in IT operatingexpenditure for 2014 isbelow the 4.1% realizedgrowth in 2013.IT operating expendituregrowth expectations aresubject to some variability,but not to the same extentas IT capital spendingexpectations.ADDITIONAL OPEX GROWTH EXPECTED AT THE MEDIANMedian Change in IT Operating Expenditure from the Previous YearIndex, 2012 IT Operating Expenditure 100, Median, 2012–2014(E)120 4.1%(Actual) 3.1%(Expected)10410710060For organizations expectingnear median growth for2014, actual growth willlikely be roughly onepercentage point higher thancurrent expectations.0201220132014(Expected)n 146.Source: CEB 2013–2014 IT Budget Benchmarking Survey. 2013 The Corporate Executive Board Company.All Rights Reserved. CIO7201913SYN13
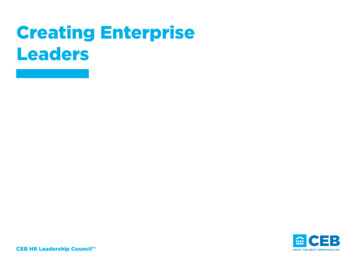
For many organizations,there remains anuntapped opportunity toshift spendingtowards innovation andbusiness opportunity. SHIFT TOWARDS INNOVATION AND BUSINESSOPPORTUNITY ELUDESAllocation of Total IT Expenditure by Asset Class2011–2014(E)Organizations areslowly gaining smallefficiencies and shiftingabout one percentage pointa year away frommaintenance spending.Mandatory spending, oftenregulatory, however, isconsuming these gains.100%CIOs must more closely tiethe investment prioritizationprocess to the strategicobjectives of the enterpriseto ensure that experimentalprojects with great (but hardto quantify) business impactpotential are not consistentlypushed out in favor offoundational investmentswith clear ROI.50%Business Opportunityand 59%58%7%8%10%10%2011201220132014(E)Source: CEB IT Budget Benchmarking Survey 2010-2013. 2013 The Corporate Executive Board Company.All Rights Reserved. CIO7201913SYNSPENDING ALLOCATIONSTAFFING TRENDSIT SERVICES17
While almost allorganizations plan toinvest more in newwork environmentopportunities, veryfew have been able toreallocate thenecessary capital. Driving employeeproductivity is the primaryobjective of new workenvironment projects.NEW WORK ENVIRONMENT INTENT BUT SLOWPROGRESSPlan to Move Spending Toward CapabilitiesNeeded in the New Work Environment 2013 The Corporate Executive Board Company.All Rights Reserved. CIO7201913SYNPercentage of OrganizationsPercentage of Organizations5%No10%YesThese experimentalinvestments tend to be smallin scale with short lifecycles(e.g., collaboration tools,business intelligence, mobileapplications, and digitalmarketing.)IT functions are at riskof missing a significantopportunity to impact howemployees get work done, butonly a small number of CIOsare successfully puttingresources towards thisopportunity.Have Realized This Objective90%No95%Yesn 29 IT organizations.n 29 IT organizations.Source: : CEB 2012 Change Readiness Diagnostic.Source: : CEB 2012 Change Readiness Diagnostic.SPENDING ALLOCATIONSTAFFING TRENDSIT SERVICES19
Mobile applicationdevelopment is one areaof new work environmentinvestments where IT hassuccessfully allocatedmore resources.INVESTING MORE IN MOBILE APPLICATIONSShare of Total IT Expenditure Allocated to Mobile Application DevelopmentPercentage of Organizations, 2012–2014 (E)100% While total investmentin mobile applicationdevelopment remainsmodest, the dramaticacceleration in spendingsince 2012 reflects thegrowing importance ofenabling a mobile workforce.With 65% of employeesdissatisfied with the mobilecapabilities available to themfor work purposes, ITorganizations must continueto accelerate investments inthis area.4%Greater than 4% of Total ITExpenditure10%15%10%2–4% of Total IT ExpenditureLess than 2% of Total 2013?2014 (E)n 137.Source: CEB 2013–2014 IT Budget Benchmarking Survey, CEB Global Labor Market Survey.Note: Mobile application development spending includes costs associated with foundational efforts to prepare for mobile appli cation development (e.g.,investments in new hardware, training, SOA services), developing new-to-world mobile applications, and converting currently existing applicationsto mobile versions. This spending does not include the cost of buying or supporting mobile devices. 2013 The Corporate Executive Board Company.All Rights Reserved. CIO7201913SYNSPENDING ALLOCATIONSTAFFING TRENDSIT SERVICES20
Movement to cloud- basedsolutions continues as ITorganizationsprepare for futureinvestment in new workenvironment projects.STEADY MIGRATION TO THE CLOUDShare of Total IT Expenditure Allocated to Cloud SourcingPercentage of Organizations, 2012–2014 (E)100%8% Most cloud spending ison Software-as-aService (SaaS), followedby Infrastructure-as- aService (IaaS).13%13%24%18%Greater Than 4% of Total ITExpenditure17%20%4%Less Than 2% of Total ITExpenditure7%25%13%20%2–4% of Total IT %17%0%201220132014 (E)2012SaaSn 130.20132014 (E)IaaSn 124.Source: CEB 2013–2014 IT Budget Benchmarking Survey.Note: 1. 2013 The Corporate Executive Board Company.All Rights Reserved. CIO7201913SYNSoftware-as-a-Service (SaaS): Applications accessible through a web browser where the consumer does not manage the underlying cloudinfrastructure or even individual application capabilities, e.g., Salesforce.com.2. Infrastructure-as-a-Service (IaaS): Fundamental computing resources like processing, storage, and networks, where the consumer does notmanage the underlying cloud infrastructure but has control over the deployed application and the operating systems, e.g., Amazon EC2.SPENDING ALLOCATIONSTAFFING TRENDSIT SERVICES21
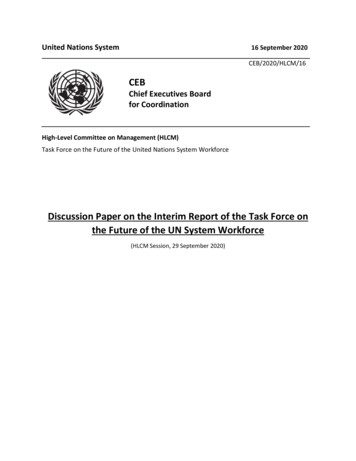
CIOs estimate thatother central corporatefunctions’ spending on ITis, on average, above 4%of their budgets. Ownership of new workenvironment projects will shiftto business partners who areeager to experiment on theirown.IT will need to redesign itsbusiness engagement modelto ensure that technologyspending outside of IT is“healthy”, i.e., spending thatenables businesspartner innovation andexperimentation.BUSINESS-LED TECHNOLOGY EXPERIMENTATIONIT Estimate of Percentage of Non-IT Function Budget Allocated to Technology20136. 1%HR5.2%Operations4. 7%Finance4. %3.3%6.6%n at least 50 responses, per function.Source: CEB 2013–2014 IT Budget Benchmarking Survey.Note: Estimates were included if the respondent rated their confidence in the estimate at least five, on a 10 point scale (where 10 very confident). 2013 The Corporate Executive Board Company.All Rights Reserved. CIO7201913SYNSPENDING ALLOCATIONSTAFFING TRENDSIT SERVICES22
While total IT headcountis expected to remainunchanged in 2014, CIOscontinue to focus onshifting staff to servicemanagement andemployee productivityenablement roles.FLAT IT FTE GROWTH, BUT DIVERSITY OF ROLESDistribution of Emerging IT Role DevelopmentPercentage of Organizations with Role in Place Currently or Within the Next 18 Months, 2012 and 2013100%2012201388% The implication is that even ifthe IT function is notgrowing, there may still beconsiderable activity on thestaffing front as CIOs seek tohire or develop scarce chitectUserExperienceDesignern 137.Source: CEB 2013–2014 IT Budget Benchmarking Survey. 2013 The Corporate Executive Board Company.All Rights Reserved. CIO7201913SYNSPENDING ALLOCATIONSTAFFING TRENDSIT SERVICES23
Source: CEB IT Budget Benchmarking Survey 2010-2013. n 52 organizations participating in CEB's 2012-2013 IT Budget Benchmark and CEB's 2013-2014 IT Budget Benchmark. Source: CEB 2013-2014 IT Budget Benchmarking Survey; CEB 2012-2013 IT Budget Benchmarking Survey. 0% 50% 100% 34% 37% 29% 19% 23% 58% 2012-2013 2012 (Expected) -2013